

Key Insights
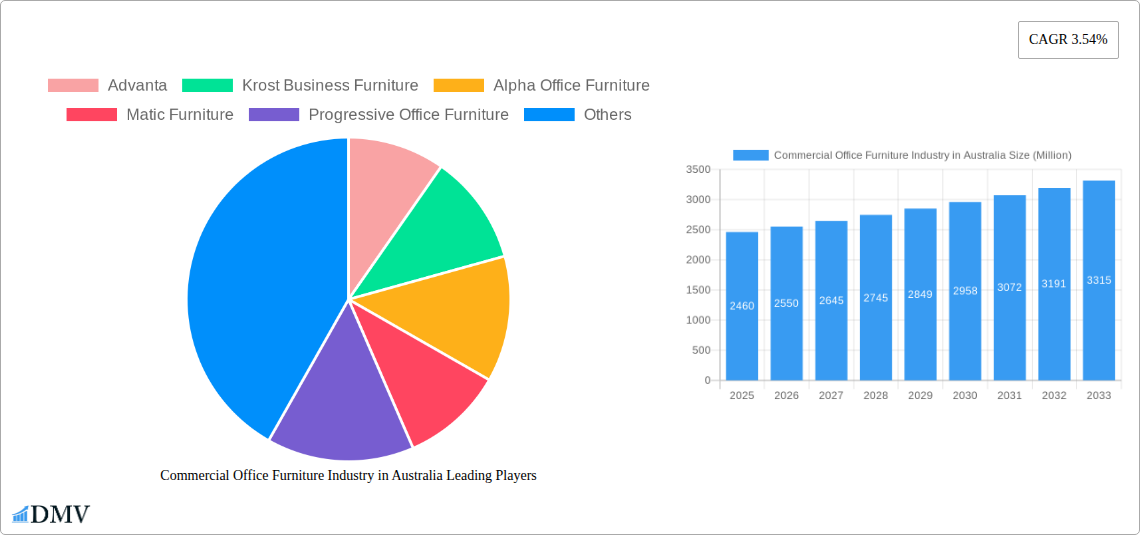
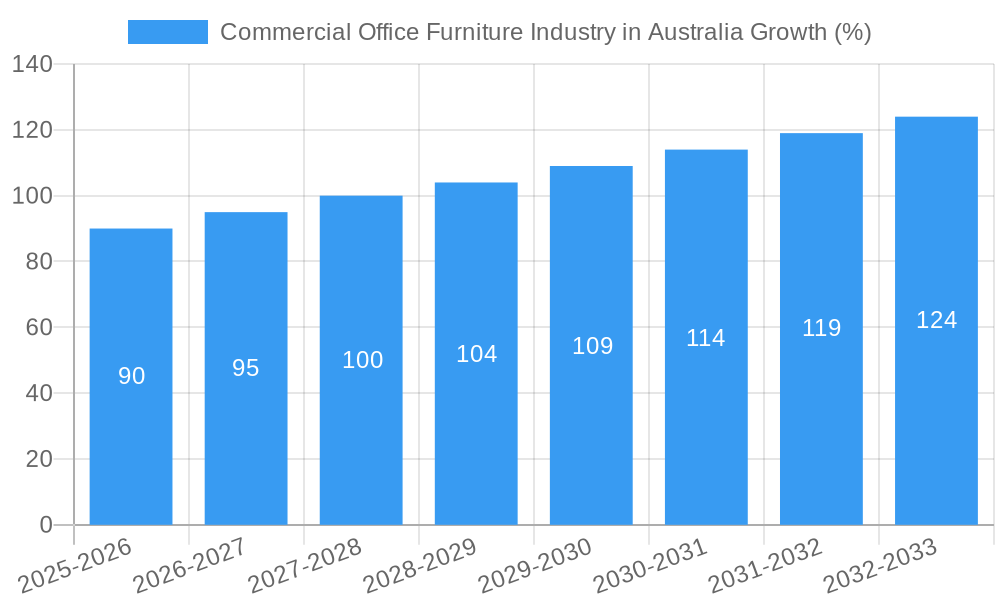
The Australian commercial office furniture market, valued at $2.46 billion in 2025, is projected to experience steady growth, driven by a compound annual growth rate (CAGR) of 3.54% from 2025 to 2033. This expansion is fueled by several key factors. The increasing number of startups and established businesses in Australia necessitates a continuous demand for functional and aesthetically pleasing office spaces. The ongoing trend toward hybrid work models is also impacting market growth; companies are investing in high-quality furniture to create productive and comfortable work environments for both in-office and remote employees. This includes ergonomic seating, adaptable workspaces, and collaborative furniture solutions. Furthermore, the focus on employee wellbeing and productivity is driving demand for furniture that promotes better posture and physical comfort, boosting sales of ergonomic chairs and adjustable desks. While economic fluctuations could present a challenge, the long-term outlook remains positive, fueled by continued urbanization and a strong focus on creating modern, efficient workplaces.
However, the market also faces some headwinds. Supply chain disruptions, increasing material costs (particularly for wood and metal), and global economic uncertainty pose potential challenges to market expansion. Competition among established and emerging furniture manufacturers remains intense, necessitating continuous product innovation and competitive pricing strategies. The rise of e-commerce in the furniture industry also requires businesses to adapt their sales and distribution channels. Despite these challenges, the growth in Australia's commercial sector, coupled with ongoing investment in office infrastructure modernization, indicates a sustained demand for commercial office furniture across various segments, including seating, storage, and tables. The market's diverse range of products, catering to various office styles and functional needs, ensures its sustained relevance in the coming years.
Commercial Office Furniture Industry in Australia: Market Report 2019-2033
This comprehensive report provides an in-depth analysis of the Australian commercial office furniture industry, offering invaluable insights for stakeholders, investors, and businesses operating within this dynamic sector. Covering the period 2019-2033, with a focus on 2025, this report unveils market trends, growth drivers, challenges, and future opportunities. The report leverages robust data analysis, incorporating historical (2019-2024), base year (2025), and forecast data (2025-2033) to provide a holistic view of the market's evolution. The total market value in 2025 is estimated at AU$XX Million.
Commercial Office Furniture Industry in Australia Market Composition & Trends
This section delves into the intricate composition of the Australian commercial office furniture market, examining its competitive landscape, innovation drivers, regulatory environment, and market dynamics. We analyze the market concentration, revealing the market share distribution amongst key players like Advanta, Krost Business Furniture, Alpha Office Furniture, and others. The report also explores the impact of substitute products, the evolving profiles of end-users (corporates, SMEs, government), and the influence of mergers and acquisitions (M&A) activities. M&A deal values in the past five years totalled approximately AU$XX Million, with a notable increase in activity observed in [mention specific year if data is available].
- Market Share Distribution: Advanta (XX%), Krost Business Furniture (XX%), Alpha Office Furniture (XX%), Others (XX%).
- Innovation Catalysts: Sustainable materials, ergonomic designs, smart office technologies.
- Regulatory Landscape: Compliance with Australian Standards for workplace safety and accessibility.
- Substitute Products: Home office furniture, repurposed/recycled furniture.
- End-User Profiles: Shift towards flexible workspaces impacting demand for modular furniture.
- M&A Activities: Consolidation amongst major players driving increased market concentration.
Commercial Office Furniture Industry in Australia Industry Evolution
This section meticulously charts the evolution of the Australian commercial office furniture industry, analyzing market growth trajectories from 2019 to 2033. We delve into the influence of technological advancements, such as the integration of smart technologies and sustainable manufacturing processes. The changing consumer demands, including preferences for ergonomic designs, flexible workspaces, and sustainable materials, are also thoroughly examined. The market witnessed a Compound Annual Growth Rate (CAGR) of XX% during the historical period (2019-2024), projected to grow at a CAGR of XX% during the forecast period (2025-2033). Adoption rates for smart office furniture are expected to rise from XX% in 2025 to XX% by 2033.
Leading Regions, Countries, or Segments in Commercial Office Furniture Industry in Australia
This segment identifies the dominant regions, countries, or market segments within the Australian commercial office furniture industry. We analyze key drivers for dominance, considering investment trends and regulatory support.
Dominant Segments:
- Material: Wood remains a dominant material, followed by metal and plastic. Other materials (e.g., recycled plastics, bamboo) are gaining traction due to increasing sustainability concerns.
- Product: Seating (office chairs, guest chairs) represents the largest segment, followed by tables (conference and occasional). Storage units are a consistently strong performer.
- Distribution Channel: Offline channels (dealers, showrooms) still dominate, but online sales are showing significant growth, particularly amongst younger demographics.
Key Drivers:
- Investment Trends: Significant investments in office fit-outs in major cities are boosting demand.
- Regulatory Support: Government initiatives promoting sustainable practices are driving adoption of eco-friendly furniture.
Commercial Office Furniture Industry in Australia Product Innovations
Recent innovations focus on ergonomic designs that prioritize employee well-being, incorporating smart technologies for enhanced functionality and sustainability. This includes adjustable height desks, smart chairs with posture correction features, and modular furniture systems promoting flexible workspace configurations. Unique selling propositions increasingly center on sustainability credentials, durability, and enhanced user experience. The integration of technology extends to smart sensors for space utilization optimization and remote management capabilities within office furniture.
Propelling Factors for Commercial Office Furniture Industry in Australia Growth
Several factors contribute to the growth of the Australian commercial office furniture industry. Strong economic growth fuels investments in office spaces, creating increased demand. Technological advancements, such as ergonomic designs and smart furniture, enhance productivity and appeal to businesses. Government regulations pushing for sustainable workplace practices drive the adoption of eco-friendly furniture. Furthermore, the growth of flexible workspaces and co-working spaces creates consistent demand for adaptable and modular furniture solutions.
Obstacles in the Commercial Office Furniture Industry in Australia Market
Challenges include supply chain disruptions impacting material availability and pricing, leading to production delays and higher costs. Increasing competition among both domestic and international players intensifies pressure on pricing and profitability. Fluctuations in raw material prices, coupled with labor costs, create price volatility. The economic climate also impacts businesses’ willingness to invest in new office furniture.
Future Opportunities in Commercial Office Furniture Industry in Australia
Emerging opportunities lie in the increasing demand for sustainable and eco-friendly furniture made from recycled or sustainable materials. The rising adoption of smart office technologies and the expanding flexible workspace market create demand for modular, easily reconfigurable furniture. There’s potential growth in bespoke design and specialized furniture catering to specific industry needs.
Major Players in the Commercial Office Furniture Industry in Australia Ecosystem
- Advanta
- Krost Business Furniture
- Alpha Office Furniture
- Matic Furniture
- Progressive Office Furniture
- AMS Furniture
- Aspen Commercial Interiors
- Emanate Design
- Diami
- Burgtec
- Fursys
- BFX Furniture
Key Developments in Commercial Office Furniture Industry in Australia Industry
- 2022 Q3: Advanta launched a new line of sustainable office chairs.
- 2023 Q1: Krost Business Furniture announced a strategic partnership with a leading European manufacturer.
- [Add more developments with year/month and impact on market dynamics]
Strategic Commercial Office Furniture Industry in Australia Market Forecast
The Australian commercial office furniture market is poised for continued growth, driven by economic expansion, technological advancements, and a focus on sustainable practices. Emerging trends, including flexible workspaces and smart office solutions, present significant opportunities for innovation and market expansion. The projected growth rate indicates a substantial market potential for companies that can effectively adapt to evolving consumer demands and technological advancements. The market is expected to reach AU$XX Million by 2033.
Commercial Office Furniture Industry in Australia Segmentation
-
1. Material
- 1.1. Wood
- 1.2. Metal
- 1.3. Plastic
- 1.4. Other Materials
-
2. Product
- 2.1. Seating
- 2.2. Storage Units (Bins & Shelves, Cabinets, Others)
- 2.3. Tables (
-
3. Distribution Channel
- 3.1. Offline
- 3.2. Online
Commercial Office Furniture Industry in Australia Segmentation By Geography
-
1. North America
- 1.1. United States
- 1.2. Canada
- 1.3. Mexico
-
2. South America
- 2.1. Brazil
- 2.2. Argentina
- 2.3. Rest of South America
-
3. Europe
- 3.1. United Kingdom
- 3.2. Germany
- 3.3. France
- 3.4. Italy
- 3.5. Spain
- 3.6. Russia
- 3.7. Benelux
- 3.8. Nordics
- 3.9. Rest of Europe
-
4. Middle East & Africa
- 4.1. Turkey
- 4.2. Israel
- 4.3. GCC
- 4.4. North Africa
- 4.5. South Africa
- 4.6. Rest of Middle East & Africa
-
5. Asia Pacific
- 5.1. China
- 5.2. India
- 5.3. Japan
- 5.4. South Korea
- 5.5. ASEAN
- 5.6. Oceania
- 5.7. Rest of Asia Pacific
Commercial Office Furniture Industry in Australia REPORT HIGHLIGHTS
| Aspects | Details |
|---|---|
| Study Period | 2019-2033 |
| Base Year | 2024 |
| Estimated Year | 2025 |
| Forecast Period | 2025-2033 |
| Historical Period | 2019-2024 |
| Growth Rate | CAGR of 3.54% from 2019-2033 |
| Segmentation |
|
Table of Contents
- 1. Introduction
- 1.1. Research Scope
- 1.2. Market Segmentation
- 1.3. Research Methodology
- 1.4. Definitions and Assumptions
- 2. Executive Summary
- 2.1. Introduction
- 3. Market Dynamics
- 3.1. Introduction
- 3.2. Market Drivers
- 3.2.1. Rise in New Offices in South Korea; Wide Range of Design Broadening Consumer Base
- 3.3. Market Restrains
- 3.3.1. Fluctuations in Raw Material Prices and Rise in Shipping Prices; Intense Competition from Both Local and International Players
- 3.4. Market Trends
- 3.4.1. Rise in Commercial Space Construction
- 4. Market Factor Analysis
- 4.1. Porters Five Forces
- 4.2. Supply/Value Chain
- 4.3. PESTEL analysis
- 4.4. Market Entropy
- 4.5. Patent/Trademark Analysis
- 5. Global Commercial Office Furniture Industry in Australia Analysis, Insights and Forecast, 2019-2031
- 5.1. Market Analysis, Insights and Forecast - by Material
- 5.1.1. Wood
- 5.1.2. Metal
- 5.1.3. Plastic
- 5.1.4. Other Materials
- 5.2. Market Analysis, Insights and Forecast - by Product
- 5.2.1. Seating
- 5.2.2. Storage Units (Bins & Shelves, Cabinets, Others)
- 5.2.3. Tables (
- 5.3. Market Analysis, Insights and Forecast - by Distribution Channel
- 5.3.1. Offline
- 5.3.2. Online
- 5.4. Market Analysis, Insights and Forecast - by Region
- 5.4.1. North America
- 5.4.2. South America
- 5.4.3. Europe
- 5.4.4. Middle East & Africa
- 5.4.5. Asia Pacific
- 5.1. Market Analysis, Insights and Forecast - by Material
- 6. North America Commercial Office Furniture Industry in Australia Analysis, Insights and Forecast, 2019-2031
- 6.1. Market Analysis, Insights and Forecast - by Material
- 6.1.1. Wood
- 6.1.2. Metal
- 6.1.3. Plastic
- 6.1.4. Other Materials
- 6.2. Market Analysis, Insights and Forecast - by Product
- 6.2.1. Seating
- 6.2.2. Storage Units (Bins & Shelves, Cabinets, Others)
- 6.2.3. Tables (
- 6.3. Market Analysis, Insights and Forecast - by Distribution Channel
- 6.3.1. Offline
- 6.3.2. Online
- 6.1. Market Analysis, Insights and Forecast - by Material
- 7. South America Commercial Office Furniture Industry in Australia Analysis, Insights and Forecast, 2019-2031
- 7.1. Market Analysis, Insights and Forecast - by Material
- 7.1.1. Wood
- 7.1.2. Metal
- 7.1.3. Plastic
- 7.1.4. Other Materials
- 7.2. Market Analysis, Insights and Forecast - by Product
- 7.2.1. Seating
- 7.2.2. Storage Units (Bins & Shelves, Cabinets, Others)
- 7.2.3. Tables (
- 7.3. Market Analysis, Insights and Forecast - by Distribution Channel
- 7.3.1. Offline
- 7.3.2. Online
- 7.1. Market Analysis, Insights and Forecast - by Material
- 8. Europe Commercial Office Furniture Industry in Australia Analysis, Insights and Forecast, 2019-2031
- 8.1. Market Analysis, Insights and Forecast - by Material
- 8.1.1. Wood
- 8.1.2. Metal
- 8.1.3. Plastic
- 8.1.4. Other Materials
- 8.2. Market Analysis, Insights and Forecast - by Product
- 8.2.1. Seating
- 8.2.2. Storage Units (Bins & Shelves, Cabinets, Others)
- 8.2.3. Tables (
- 8.3. Market Analysis, Insights and Forecast - by Distribution Channel
- 8.3.1. Offline
- 8.3.2. Online
- 8.1. Market Analysis, Insights and Forecast - by Material
- 9. Middle East & Africa Commercial Office Furniture Industry in Australia Analysis, Insights and Forecast, 2019-2031
- 9.1. Market Analysis, Insights and Forecast - by Material
- 9.1.1. Wood
- 9.1.2. Metal
- 9.1.3. Plastic
- 9.1.4. Other Materials
- 9.2. Market Analysis, Insights and Forecast - by Product
- 9.2.1. Seating
- 9.2.2. Storage Units (Bins & Shelves, Cabinets, Others)
- 9.2.3. Tables (
- 9.3. Market Analysis, Insights and Forecast - by Distribution Channel
- 9.3.1. Offline
- 9.3.2. Online
- 9.1. Market Analysis, Insights and Forecast - by Material
- 10. Asia Pacific Commercial Office Furniture Industry in Australia Analysis, Insights and Forecast, 2019-2031
- 10.1. Market Analysis, Insights and Forecast - by Material
- 10.1.1. Wood
- 10.1.2. Metal
- 10.1.3. Plastic
- 10.1.4. Other Materials
- 10.2. Market Analysis, Insights and Forecast - by Product
- 10.2.1. Seating
- 10.2.2. Storage Units (Bins & Shelves, Cabinets, Others)
- 10.2.3. Tables (
- 10.3. Market Analysis, Insights and Forecast - by Distribution Channel
- 10.3.1. Offline
- 10.3.2. Online
- 10.1. Market Analysis, Insights and Forecast - by Material
- 11. Competitive Analysis
- 11.1. Global Market Share Analysis 2024
- 11.2. Company Profiles
- 11.2.1 Advanta
- 11.2.1.1. Overview
- 11.2.1.2. Products
- 11.2.1.3. SWOT Analysis
- 11.2.1.4. Recent Developments
- 11.2.1.5. Financials (Based on Availability)
- 11.2.2 Krost Business Furniture
- 11.2.2.1. Overview
- 11.2.2.2. Products
- 11.2.2.3. SWOT Analysis
- 11.2.2.4. Recent Developments
- 11.2.2.5. Financials (Based on Availability)
- 11.2.3 Alpha Office Furniture
- 11.2.3.1. Overview
- 11.2.3.2. Products
- 11.2.3.3. SWOT Analysis
- 11.2.3.4. Recent Developments
- 11.2.3.5. Financials (Based on Availability)
- 11.2.4 Matic Furniture
- 11.2.4.1. Overview
- 11.2.4.2. Products
- 11.2.4.3. SWOT Analysis
- 11.2.4.4. Recent Developments
- 11.2.4.5. Financials (Based on Availability)
- 11.2.5 Progressive Office Furniture
- 11.2.5.1. Overview
- 11.2.5.2. Products
- 11.2.5.3. SWOT Analysis
- 11.2.5.4. Recent Developments
- 11.2.5.5. Financials (Based on Availability)
- 11.2.6 AMS Furniture
- 11.2.6.1. Overview
- 11.2.6.2. Products
- 11.2.6.3. SWOT Analysis
- 11.2.6.4. Recent Developments
- 11.2.6.5. Financials (Based on Availability)
- 11.2.7 Aspen Commercial Interiors
- 11.2.7.1. Overview
- 11.2.7.2. Products
- 11.2.7.3. SWOT Analysis
- 11.2.7.4. Recent Developments
- 11.2.7.5. Financials (Based on Availability)
- 11.2.8 Emanate Design
- 11.2.8.1. Overview
- 11.2.8.2. Products
- 11.2.8.3. SWOT Analysis
- 11.2.8.4. Recent Developments
- 11.2.8.5. Financials (Based on Availability)
- 11.2.9 Diami
- 11.2.9.1. Overview
- 11.2.9.2. Products
- 11.2.9.3. SWOT Analysis
- 11.2.9.4. Recent Developments
- 11.2.9.5. Financials (Based on Availability)
- 11.2.10 Burgtec
- 11.2.10.1. Overview
- 11.2.10.2. Products
- 11.2.10.3. SWOT Analysis
- 11.2.10.4. Recent Developments
- 11.2.10.5. Financials (Based on Availability)
- 11.2.11 Fursys
- 11.2.11.1. Overview
- 11.2.11.2. Products
- 11.2.11.3. SWOT Analysis
- 11.2.11.4. Recent Developments
- 11.2.11.5. Financials (Based on Availability)
- 11.2.12 BFX Furniture
- 11.2.12.1. Overview
- 11.2.12.2. Products
- 11.2.12.3. SWOT Analysis
- 11.2.12.4. Recent Developments
- 11.2.12.5. Financials (Based on Availability)
- 11.2.1 Advanta
List of Figures
- Figure 1: Global Commercial Office Furniture Industry in Australia Revenue Breakdown (Million, %) by Region 2024 & 2032
- Figure 2: Global Commercial Office Furniture Industry in Australia Volume Breakdown (K Unit, %) by Region 2024 & 2032
- Figure 3: Australia Commercial Office Furniture Industry in Australia Revenue (Million), by Country 2024 & 2032
- Figure 4: Australia Commercial Office Furniture Industry in Australia Volume (K Unit), by Country 2024 & 2032
- Figure 5: Australia Commercial Office Furniture Industry in Australia Revenue Share (%), by Country 2024 & 2032
- Figure 6: Australia Commercial Office Furniture Industry in Australia Volume Share (%), by Country 2024 & 2032
- Figure 7: North America Commercial Office Furniture Industry in Australia Revenue (Million), by Material 2024 & 2032
- Figure 8: North America Commercial Office Furniture Industry in Australia Volume (K Unit), by Material 2024 & 2032
- Figure 9: North America Commercial Office Furniture Industry in Australia Revenue Share (%), by Material 2024 & 2032
- Figure 10: North America Commercial Office Furniture Industry in Australia Volume Share (%), by Material 2024 & 2032
- Figure 11: North America Commercial Office Furniture Industry in Australia Revenue (Million), by Product 2024 & 2032
- Figure 12: North America Commercial Office Furniture Industry in Australia Volume (K Unit), by Product 2024 & 2032
- Figure 13: North America Commercial Office Furniture Industry in Australia Revenue Share (%), by Product 2024 & 2032
- Figure 14: North America Commercial Office Furniture Industry in Australia Volume Share (%), by Product 2024 & 2032
- Figure 15: North America Commercial Office Furniture Industry in Australia Revenue (Million), by Distribution Channel 2024 & 2032
- Figure 16: North America Commercial Office Furniture Industry in Australia Volume (K Unit), by Distribution Channel 2024 & 2032
- Figure 17: North America Commercial Office Furniture Industry in Australia Revenue Share (%), by Distribution Channel 2024 & 2032
- Figure 18: North America Commercial Office Furniture Industry in Australia Volume Share (%), by Distribution Channel 2024 & 2032
- Figure 19: North America Commercial Office Furniture Industry in Australia Revenue (Million), by Country 2024 & 2032
- Figure 20: North America Commercial Office Furniture Industry in Australia Volume (K Unit), by Country 2024 & 2032
- Figure 21: North America Commercial Office Furniture Industry in Australia Revenue Share (%), by Country 2024 & 2032
- Figure 22: North America Commercial Office Furniture Industry in Australia Volume Share (%), by Country 2024 & 2032
- Figure 23: South America Commercial Office Furniture Industry in Australia Revenue (Million), by Material 2024 & 2032
- Figure 24: South America Commercial Office Furniture Industry in Australia Volume (K Unit), by Material 2024 & 2032
- Figure 25: South America Commercial Office Furniture Industry in Australia Revenue Share (%), by Material 2024 & 2032
- Figure 26: South America Commercial Office Furniture Industry in Australia Volume Share (%), by Material 2024 & 2032
- Figure 27: South America Commercial Office Furniture Industry in Australia Revenue (Million), by Product 2024 & 2032
- Figure 28: South America Commercial Office Furniture Industry in Australia Volume (K Unit), by Product 2024 & 2032
- Figure 29: South America Commercial Office Furniture Industry in Australia Revenue Share (%), by Product 2024 & 2032
- Figure 30: South America Commercial Office Furniture Industry in Australia Volume Share (%), by Product 2024 & 2032
- Figure 31: South America Commercial Office Furniture Industry in Australia Revenue (Million), by Distribution Channel 2024 & 2032
- Figure 32: South America Commercial Office Furniture Industry in Australia Volume (K Unit), by Distribution Channel 2024 & 2032
- Figure 33: South America Commercial Office Furniture Industry in Australia Revenue Share (%), by Distribution Channel 2024 & 2032
- Figure 34: South America Commercial Office Furniture Industry in Australia Volume Share (%), by Distribution Channel 2024 & 2032
- Figure 35: South America Commercial Office Furniture Industry in Australia Revenue (Million), by Country 2024 & 2032
- Figure 36: South America Commercial Office Furniture Industry in Australia Volume (K Unit), by Country 2024 & 2032
- Figure 37: South America Commercial Office Furniture Industry in Australia Revenue Share (%), by Country 2024 & 2032
- Figure 38: South America Commercial Office Furniture Industry in Australia Volume Share (%), by Country 2024 & 2032
- Figure 39: Europe Commercial Office Furniture Industry in Australia Revenue (Million), by Material 2024 & 2032
- Figure 40: Europe Commercial Office Furniture Industry in Australia Volume (K Unit), by Material 2024 & 2032
- Figure 41: Europe Commercial Office Furniture Industry in Australia Revenue Share (%), by Material 2024 & 2032
- Figure 42: Europe Commercial Office Furniture Industry in Australia Volume Share (%), by Material 2024 & 2032
- Figure 43: Europe Commercial Office Furniture Industry in Australia Revenue (Million), by Product 2024 & 2032
- Figure 44: Europe Commercial Office Furniture Industry in Australia Volume (K Unit), by Product 2024 & 2032
- Figure 45: Europe Commercial Office Furniture Industry in Australia Revenue Share (%), by Product 2024 & 2032
- Figure 46: Europe Commercial Office Furniture Industry in Australia Volume Share (%), by Product 2024 & 2032
- Figure 47: Europe Commercial Office Furniture Industry in Australia Revenue (Million), by Distribution Channel 2024 & 2032
- Figure 48: Europe Commercial Office Furniture Industry in Australia Volume (K Unit), by Distribution Channel 2024 & 2032
- Figure 49: Europe Commercial Office Furniture Industry in Australia Revenue Share (%), by Distribution Channel 2024 & 2032
- Figure 50: Europe Commercial Office Furniture Industry in Australia Volume Share (%), by Distribution Channel 2024 & 2032
- Figure 51: Europe Commercial Office Furniture Industry in Australia Revenue (Million), by Country 2024 & 2032
- Figure 52: Europe Commercial Office Furniture Industry in Australia Volume (K Unit), by Country 2024 & 2032
- Figure 53: Europe Commercial Office Furniture Industry in Australia Revenue Share (%), by Country 2024 & 2032
- Figure 54: Europe Commercial Office Furniture Industry in Australia Volume Share (%), by Country 2024 & 2032
- Figure 55: Middle East & Africa Commercial Office Furniture Industry in Australia Revenue (Million), by Material 2024 & 2032
- Figure 56: Middle East & Africa Commercial Office Furniture Industry in Australia Volume (K Unit), by Material 2024 & 2032
- Figure 57: Middle East & Africa Commercial Office Furniture Industry in Australia Revenue Share (%), by Material 2024 & 2032
- Figure 58: Middle East & Africa Commercial Office Furniture Industry in Australia Volume Share (%), by Material 2024 & 2032
- Figure 59: Middle East & Africa Commercial Office Furniture Industry in Australia Revenue (Million), by Product 2024 & 2032
- Figure 60: Middle East & Africa Commercial Office Furniture Industry in Australia Volume (K Unit), by Product 2024 & 2032
- Figure 61: Middle East & Africa Commercial Office Furniture Industry in Australia Revenue Share (%), by Product 2024 & 2032
- Figure 62: Middle East & Africa Commercial Office Furniture Industry in Australia Volume Share (%), by Product 2024 & 2032
- Figure 63: Middle East & Africa Commercial Office Furniture Industry in Australia Revenue (Million), by Distribution Channel 2024 & 2032
- Figure 64: Middle East & Africa Commercial Office Furniture Industry in Australia Volume (K Unit), by Distribution Channel 2024 & 2032
- Figure 65: Middle East & Africa Commercial Office Furniture Industry in Australia Revenue Share (%), by Distribution Channel 2024 & 2032
- Figure 66: Middle East & Africa Commercial Office Furniture Industry in Australia Volume Share (%), by Distribution Channel 2024 & 2032
- Figure 67: Middle East & Africa Commercial Office Furniture Industry in Australia Revenue (Million), by Country 2024 & 2032
- Figure 68: Middle East & Africa Commercial Office Furniture Industry in Australia Volume (K Unit), by Country 2024 & 2032
- Figure 69: Middle East & Africa Commercial Office Furniture Industry in Australia Revenue Share (%), by Country 2024 & 2032
- Figure 70: Middle East & Africa Commercial Office Furniture Industry in Australia Volume Share (%), by Country 2024 & 2032
- Figure 71: Asia Pacific Commercial Office Furniture Industry in Australia Revenue (Million), by Material 2024 & 2032
- Figure 72: Asia Pacific Commercial Office Furniture Industry in Australia Volume (K Unit), by Material 2024 & 2032
- Figure 73: Asia Pacific Commercial Office Furniture Industry in Australia Revenue Share (%), by Material 2024 & 2032
- Figure 74: Asia Pacific Commercial Office Furniture Industry in Australia Volume Share (%), by Material 2024 & 2032
- Figure 75: Asia Pacific Commercial Office Furniture Industry in Australia Revenue (Million), by Product 2024 & 2032
- Figure 76: Asia Pacific Commercial Office Furniture Industry in Australia Volume (K Unit), by Product 2024 & 2032
- Figure 77: Asia Pacific Commercial Office Furniture Industry in Australia Revenue Share (%), by Product 2024 & 2032
- Figure 78: Asia Pacific Commercial Office Furniture Industry in Australia Volume Share (%), by Product 2024 & 2032
- Figure 79: Asia Pacific Commercial Office Furniture Industry in Australia Revenue (Million), by Distribution Channel 2024 & 2032
- Figure 80: Asia Pacific Commercial Office Furniture Industry in Australia Volume (K Unit), by Distribution Channel 2024 & 2032
- Figure 81: Asia Pacific Commercial Office Furniture Industry in Australia Revenue Share (%), by Distribution Channel 2024 & 2032
- Figure 82: Asia Pacific Commercial Office Furniture Industry in Australia Volume Share (%), by Distribution Channel 2024 & 2032
- Figure 83: Asia Pacific Commercial Office Furniture Industry in Australia Revenue (Million), by Country 2024 & 2032
- Figure 84: Asia Pacific Commercial Office Furniture Industry in Australia Volume (K Unit), by Country 2024 & 2032
- Figure 85: Asia Pacific Commercial Office Furniture Industry in Australia Revenue Share (%), by Country 2024 & 2032
- Figure 86: Asia Pacific Commercial Office Furniture Industry in Australia Volume Share (%), by Country 2024 & 2032
List of Tables
- Table 1: Global Commercial Office Furniture Industry in Australia Revenue Million Forecast, by Region 2019 & 2032
- Table 2: Global Commercial Office Furniture Industry in Australia Volume K Unit Forecast, by Region 2019 & 2032
- Table 3: Global Commercial Office Furniture Industry in Australia Revenue Million Forecast, by Material 2019 & 2032
- Table 4: Global Commercial Office Furniture Industry in Australia Volume K Unit Forecast, by Material 2019 & 2032
- Table 5: Global Commercial Office Furniture Industry in Australia Revenue Million Forecast, by Product 2019 & 2032
- Table 6: Global Commercial Office Furniture Industry in Australia Volume K Unit Forecast, by Product 2019 & 2032
- Table 7: Global Commercial Office Furniture Industry in Australia Revenue Million Forecast, by Distribution Channel 2019 & 2032
- Table 8: Global Commercial Office Furniture Industry in Australia Volume K Unit Forecast, by Distribution Channel 2019 & 2032
- Table 9: Global Commercial Office Furniture Industry in Australia Revenue Million Forecast, by Region 2019 & 2032
- Table 10: Global Commercial Office Furniture Industry in Australia Volume K Unit Forecast, by Region 2019 & 2032
- Table 11: Global Commercial Office Furniture Industry in Australia Revenue Million Forecast, by Country 2019 & 2032
- Table 12: Global Commercial Office Furniture Industry in Australia Volume K Unit Forecast, by Country 2019 & 2032
- Table 13: Global Commercial Office Furniture Industry in Australia Revenue Million Forecast, by Material 2019 & 2032
- Table 14: Global Commercial Office Furniture Industry in Australia Volume K Unit Forecast, by Material 2019 & 2032
- Table 15: Global Commercial Office Furniture Industry in Australia Revenue Million Forecast, by Product 2019 & 2032
- Table 16: Global Commercial Office Furniture Industry in Australia Volume K Unit Forecast, by Product 2019 & 2032
- Table 17: Global Commercial Office Furniture Industry in Australia Revenue Million Forecast, by Distribution Channel 2019 & 2032
- Table 18: Global Commercial Office Furniture Industry in Australia Volume K Unit Forecast, by Distribution Channel 2019 & 2032
- Table 19: Global Commercial Office Furniture Industry in Australia Revenue Million Forecast, by Country 2019 & 2032
- Table 20: Global Commercial Office Furniture Industry in Australia Volume K Unit Forecast, by Country 2019 & 2032
- Table 21: United States Commercial Office Furniture Industry in Australia Revenue (Million) Forecast, by Application 2019 & 2032
- Table 22: United States Commercial Office Furniture Industry in Australia Volume (K Unit) Forecast, by Application 2019 & 2032
- Table 23: Canada Commercial Office Furniture Industry in Australia Revenue (Million) Forecast, by Application 2019 & 2032
- Table 24: Canada Commercial Office Furniture Industry in Australia Volume (K Unit) Forecast, by Application 2019 & 2032
- Table 25: Mexico Commercial Office Furniture Industry in Australia Revenue (Million) Forecast, by Application 2019 & 2032
- Table 26: Mexico Commercial Office Furniture Industry in Australia Volume (K Unit) Forecast, by Application 2019 & 2032
- Table 27: Global Commercial Office Furniture Industry in Australia Revenue Million Forecast, by Material 2019 & 2032
- Table 28: Global Commercial Office Furniture Industry in Australia Volume K Unit Forecast, by Material 2019 & 2032
- Table 29: Global Commercial Office Furniture Industry in Australia Revenue Million Forecast, by Product 2019 & 2032
- Table 30: Global Commercial Office Furniture Industry in Australia Volume K Unit Forecast, by Product 2019 & 2032
- Table 31: Global Commercial Office Furniture Industry in Australia Revenue Million Forecast, by Distribution Channel 2019 & 2032
- Table 32: Global Commercial Office Furniture Industry in Australia Volume K Unit Forecast, by Distribution Channel 2019 & 2032
- Table 33: Global Commercial Office Furniture Industry in Australia Revenue Million Forecast, by Country 2019 & 2032
- Table 34: Global Commercial Office Furniture Industry in Australia Volume K Unit Forecast, by Country 2019 & 2032
- Table 35: Brazil Commercial Office Furniture Industry in Australia Revenue (Million) Forecast, by Application 2019 & 2032
- Table 36: Brazil Commercial Office Furniture Industry in Australia Volume (K Unit) Forecast, by Application 2019 & 2032
- Table 37: Argentina Commercial Office Furniture Industry in Australia Revenue (Million) Forecast, by Application 2019 & 2032
- Table 38: Argentina Commercial Office Furniture Industry in Australia Volume (K Unit) Forecast, by Application 2019 & 2032
- Table 39: Rest of South America Commercial Office Furniture Industry in Australia Revenue (Million) Forecast, by Application 2019 & 2032
- Table 40: Rest of South America Commercial Office Furniture Industry in Australia Volume (K Unit) Forecast, by Application 2019 & 2032
- Table 41: Global Commercial Office Furniture Industry in Australia Revenue Million Forecast, by Material 2019 & 2032
- Table 42: Global Commercial Office Furniture Industry in Australia Volume K Unit Forecast, by Material 2019 & 2032
- Table 43: Global Commercial Office Furniture Industry in Australia Revenue Million Forecast, by Product 2019 & 2032
- Table 44: Global Commercial Office Furniture Industry in Australia Volume K Unit Forecast, by Product 2019 & 2032
- Table 45: Global Commercial Office Furniture Industry in Australia Revenue Million Forecast, by Distribution Channel 2019 & 2032
- Table 46: Global Commercial Office Furniture Industry in Australia Volume K Unit Forecast, by Distribution Channel 2019 & 2032
- Table 47: Global Commercial Office Furniture Industry in Australia Revenue Million Forecast, by Country 2019 & 2032
- Table 48: Global Commercial Office Furniture Industry in Australia Volume K Unit Forecast, by Country 2019 & 2032
- Table 49: United Kingdom Commercial Office Furniture Industry in Australia Revenue (Million) Forecast, by Application 2019 & 2032
- Table 50: United Kingdom Commercial Office Furniture Industry in Australia Volume (K Unit) Forecast, by Application 2019 & 2032
- Table 51: Germany Commercial Office Furniture Industry in Australia Revenue (Million) Forecast, by Application 2019 & 2032
- Table 52: Germany Commercial Office Furniture Industry in Australia Volume (K Unit) Forecast, by Application 2019 & 2032
- Table 53: France Commercial Office Furniture Industry in Australia Revenue (Million) Forecast, by Application 2019 & 2032
- Table 54: France Commercial Office Furniture Industry in Australia Volume (K Unit) Forecast, by Application 2019 & 2032
- Table 55: Italy Commercial Office Furniture Industry in Australia Revenue (Million) Forecast, by Application 2019 & 2032
- Table 56: Italy Commercial Office Furniture Industry in Australia Volume (K Unit) Forecast, by Application 2019 & 2032
- Table 57: Spain Commercial Office Furniture Industry in Australia Revenue (Million) Forecast, by Application 2019 & 2032
- Table 58: Spain Commercial Office Furniture Industry in Australia Volume (K Unit) Forecast, by Application 2019 & 2032
- Table 59: Russia Commercial Office Furniture Industry in Australia Revenue (Million) Forecast, by Application 2019 & 2032
- Table 60: Russia Commercial Office Furniture Industry in Australia Volume (K Unit) Forecast, by Application 2019 & 2032
- Table 61: Benelux Commercial Office Furniture Industry in Australia Revenue (Million) Forecast, by Application 2019 & 2032
- Table 62: Benelux Commercial Office Furniture Industry in Australia Volume (K Unit) Forecast, by Application 2019 & 2032
- Table 63: Nordics Commercial Office Furniture Industry in Australia Revenue (Million) Forecast, by Application 2019 & 2032
- Table 64: Nordics Commercial Office Furniture Industry in Australia Volume (K Unit) Forecast, by Application 2019 & 2032
- Table 65: Rest of Europe Commercial Office Furniture Industry in Australia Revenue (Million) Forecast, by Application 2019 & 2032
- Table 66: Rest of Europe Commercial Office Furniture Industry in Australia Volume (K Unit) Forecast, by Application 2019 & 2032
- Table 67: Global Commercial Office Furniture Industry in Australia Revenue Million Forecast, by Material 2019 & 2032
- Table 68: Global Commercial Office Furniture Industry in Australia Volume K Unit Forecast, by Material 2019 & 2032
- Table 69: Global Commercial Office Furniture Industry in Australia Revenue Million Forecast, by Product 2019 & 2032
- Table 70: Global Commercial Office Furniture Industry in Australia Volume K Unit Forecast, by Product 2019 & 2032
- Table 71: Global Commercial Office Furniture Industry in Australia Revenue Million Forecast, by Distribution Channel 2019 & 2032
- Table 72: Global Commercial Office Furniture Industry in Australia Volume K Unit Forecast, by Distribution Channel 2019 & 2032
- Table 73: Global Commercial Office Furniture Industry in Australia Revenue Million Forecast, by Country 2019 & 2032
- Table 74: Global Commercial Office Furniture Industry in Australia Volume K Unit Forecast, by Country 2019 & 2032
- Table 75: Turkey Commercial Office Furniture Industry in Australia Revenue (Million) Forecast, by Application 2019 & 2032
- Table 76: Turkey Commercial Office Furniture Industry in Australia Volume (K Unit) Forecast, by Application 2019 & 2032
- Table 77: Israel Commercial Office Furniture Industry in Australia Revenue (Million) Forecast, by Application 2019 & 2032
- Table 78: Israel Commercial Office Furniture Industry in Australia Volume (K Unit) Forecast, by Application 2019 & 2032
- Table 79: GCC Commercial Office Furniture Industry in Australia Revenue (Million) Forecast, by Application 2019 & 2032
- Table 80: GCC Commercial Office Furniture Industry in Australia Volume (K Unit) Forecast, by Application 2019 & 2032
- Table 81: North Africa Commercial Office Furniture Industry in Australia Revenue (Million) Forecast, by Application 2019 & 2032
- Table 82: North Africa Commercial Office Furniture Industry in Australia Volume (K Unit) Forecast, by Application 2019 & 2032
- Table 83: South Africa Commercial Office Furniture Industry in Australia Revenue (Million) Forecast, by Application 2019 & 2032
- Table 84: South Africa Commercial Office Furniture Industry in Australia Volume (K Unit) Forecast, by Application 2019 & 2032
- Table 85: Rest of Middle East & Africa Commercial Office Furniture Industry in Australia Revenue (Million) Forecast, by Application 2019 & 2032
- Table 86: Rest of Middle East & Africa Commercial Office Furniture Industry in Australia Volume (K Unit) Forecast, by Application 2019 & 2032
- Table 87: Global Commercial Office Furniture Industry in Australia Revenue Million Forecast, by Material 2019 & 2032
- Table 88: Global Commercial Office Furniture Industry in Australia Volume K Unit Forecast, by Material 2019 & 2032
- Table 89: Global Commercial Office Furniture Industry in Australia Revenue Million Forecast, by Product 2019 & 2032
- Table 90: Global Commercial Office Furniture Industry in Australia Volume K Unit Forecast, by Product 2019 & 2032
- Table 91: Global Commercial Office Furniture Industry in Australia Revenue Million Forecast, by Distribution Channel 2019 & 2032
- Table 92: Global Commercial Office Furniture Industry in Australia Volume K Unit Forecast, by Distribution Channel 2019 & 2032
- Table 93: Global Commercial Office Furniture Industry in Australia Revenue Million Forecast, by Country 2019 & 2032
- Table 94: Global Commercial Office Furniture Industry in Australia Volume K Unit Forecast, by Country 2019 & 2032
- Table 95: China Commercial Office Furniture Industry in Australia Revenue (Million) Forecast, by Application 2019 & 2032
- Table 96: China Commercial Office Furniture Industry in Australia Volume (K Unit) Forecast, by Application 2019 & 2032
- Table 97: India Commercial Office Furniture Industry in Australia Revenue (Million) Forecast, by Application 2019 & 2032
- Table 98: India Commercial Office Furniture Industry in Australia Volume (K Unit) Forecast, by Application 2019 & 2032
- Table 99: Japan Commercial Office Furniture Industry in Australia Revenue (Million) Forecast, by Application 2019 & 2032
- Table 100: Japan Commercial Office Furniture Industry in Australia Volume (K Unit) Forecast, by Application 2019 & 2032
- Table 101: South Korea Commercial Office Furniture Industry in Australia Revenue (Million) Forecast, by Application 2019 & 2032
- Table 102: South Korea Commercial Office Furniture Industry in Australia Volume (K Unit) Forecast, by Application 2019 & 2032
- Table 103: ASEAN Commercial Office Furniture Industry in Australia Revenue (Million) Forecast, by Application 2019 & 2032
- Table 104: ASEAN Commercial Office Furniture Industry in Australia Volume (K Unit) Forecast, by Application 2019 & 2032
- Table 105: Oceania Commercial Office Furniture Industry in Australia Revenue (Million) Forecast, by Application 2019 & 2032
- Table 106: Oceania Commercial Office Furniture Industry in Australia Volume (K Unit) Forecast, by Application 2019 & 2032
- Table 107: Rest of Asia Pacific Commercial Office Furniture Industry in Australia Revenue (Million) Forecast, by Application 2019 & 2032
- Table 108: Rest of Asia Pacific Commercial Office Furniture Industry in Australia Volume (K Unit) Forecast, by Application 2019 & 2032
Frequently Asked Questions
1. What is the projected Compound Annual Growth Rate (CAGR) of the Commercial Office Furniture Industry in Australia?
The projected CAGR is approximately 3.54%.
2. Which companies are prominent players in the Commercial Office Furniture Industry in Australia?
Key companies in the market include Advanta, Krost Business Furniture, Alpha Office Furniture, Matic Furniture, Progressive Office Furniture, AMS Furniture, Aspen Commercial Interiors, Emanate Design, Diami, Burgtec, Fursys, BFX Furniture.
3. What are the main segments of the Commercial Office Furniture Industry in Australia?
The market segments include Material, Product, Distribution Channel.
4. Can you provide details about the market size?
The market size is estimated to be USD 2.46 Million as of 2022.
5. What are some drivers contributing to market growth?
Rise in New Offices in South Korea; Wide Range of Design Broadening Consumer Base.
6. What are the notable trends driving market growth?
Rise in Commercial Space Construction.
7. Are there any restraints impacting market growth?
Fluctuations in Raw Material Prices and Rise in Shipping Prices; Intense Competition from Both Local and International Players.
8. Can you provide examples of recent developments in the market?
N/A
9. What pricing options are available for accessing the report?
Pricing options include single-user, multi-user, and enterprise licenses priced at USD 3800, USD 4500, and USD 5800 respectively.
10. Is the market size provided in terms of value or volume?
The market size is provided in terms of value, measured in Million and volume, measured in K Unit.
11. Are there any specific market keywords associated with the report?
Yes, the market keyword associated with the report is "Commercial Office Furniture Industry in Australia," which aids in identifying and referencing the specific market segment covered.
12. How do I determine which pricing option suits my needs best?
The pricing options vary based on user requirements and access needs. Individual users may opt for single-user licenses, while businesses requiring broader access may choose multi-user or enterprise licenses for cost-effective access to the report.
13. Are there any additional resources or data provided in the Commercial Office Furniture Industry in Australia report?
While the report offers comprehensive insights, it's advisable to review the specific contents or supplementary materials provided to ascertain if additional resources or data are available.
14. How can I stay updated on further developments or reports in the Commercial Office Furniture Industry in Australia?
To stay informed about further developments, trends, and reports in the Commercial Office Furniture Industry in Australia, consider subscribing to industry newsletters, following relevant companies and organizations, or regularly checking reputable industry news sources and publications.
Methodology
Step 1 - Identification of Relevant Samples Size from Population Database


Step 2 - Approaches for Defining Global Market Size (Value, Volume* & Price*)

Note*: In applicable scenarios
Step 3 - Data Sources
Primary Research
- Web Analytics
- Survey Reports
- Research Institute
- Latest Research Reports
- Opinion Leaders
Secondary Research
- Annual Reports
- White Paper
- Latest Press Release
- Industry Association
- Paid Database
- Investor Presentations

Step 4 - Data Triangulation
Involves using different sources of information in order to increase the validity of a study
These sources are likely to be stakeholders in a program - participants, other researchers, program staff, other community members, and so on.
Then we put all data in single framework & apply various statistical tools to find out the dynamic on the market.
During the analysis stage, feedback from the stakeholder groups would be compared to determine areas of agreement as well as areas of divergence
