

Key Insights
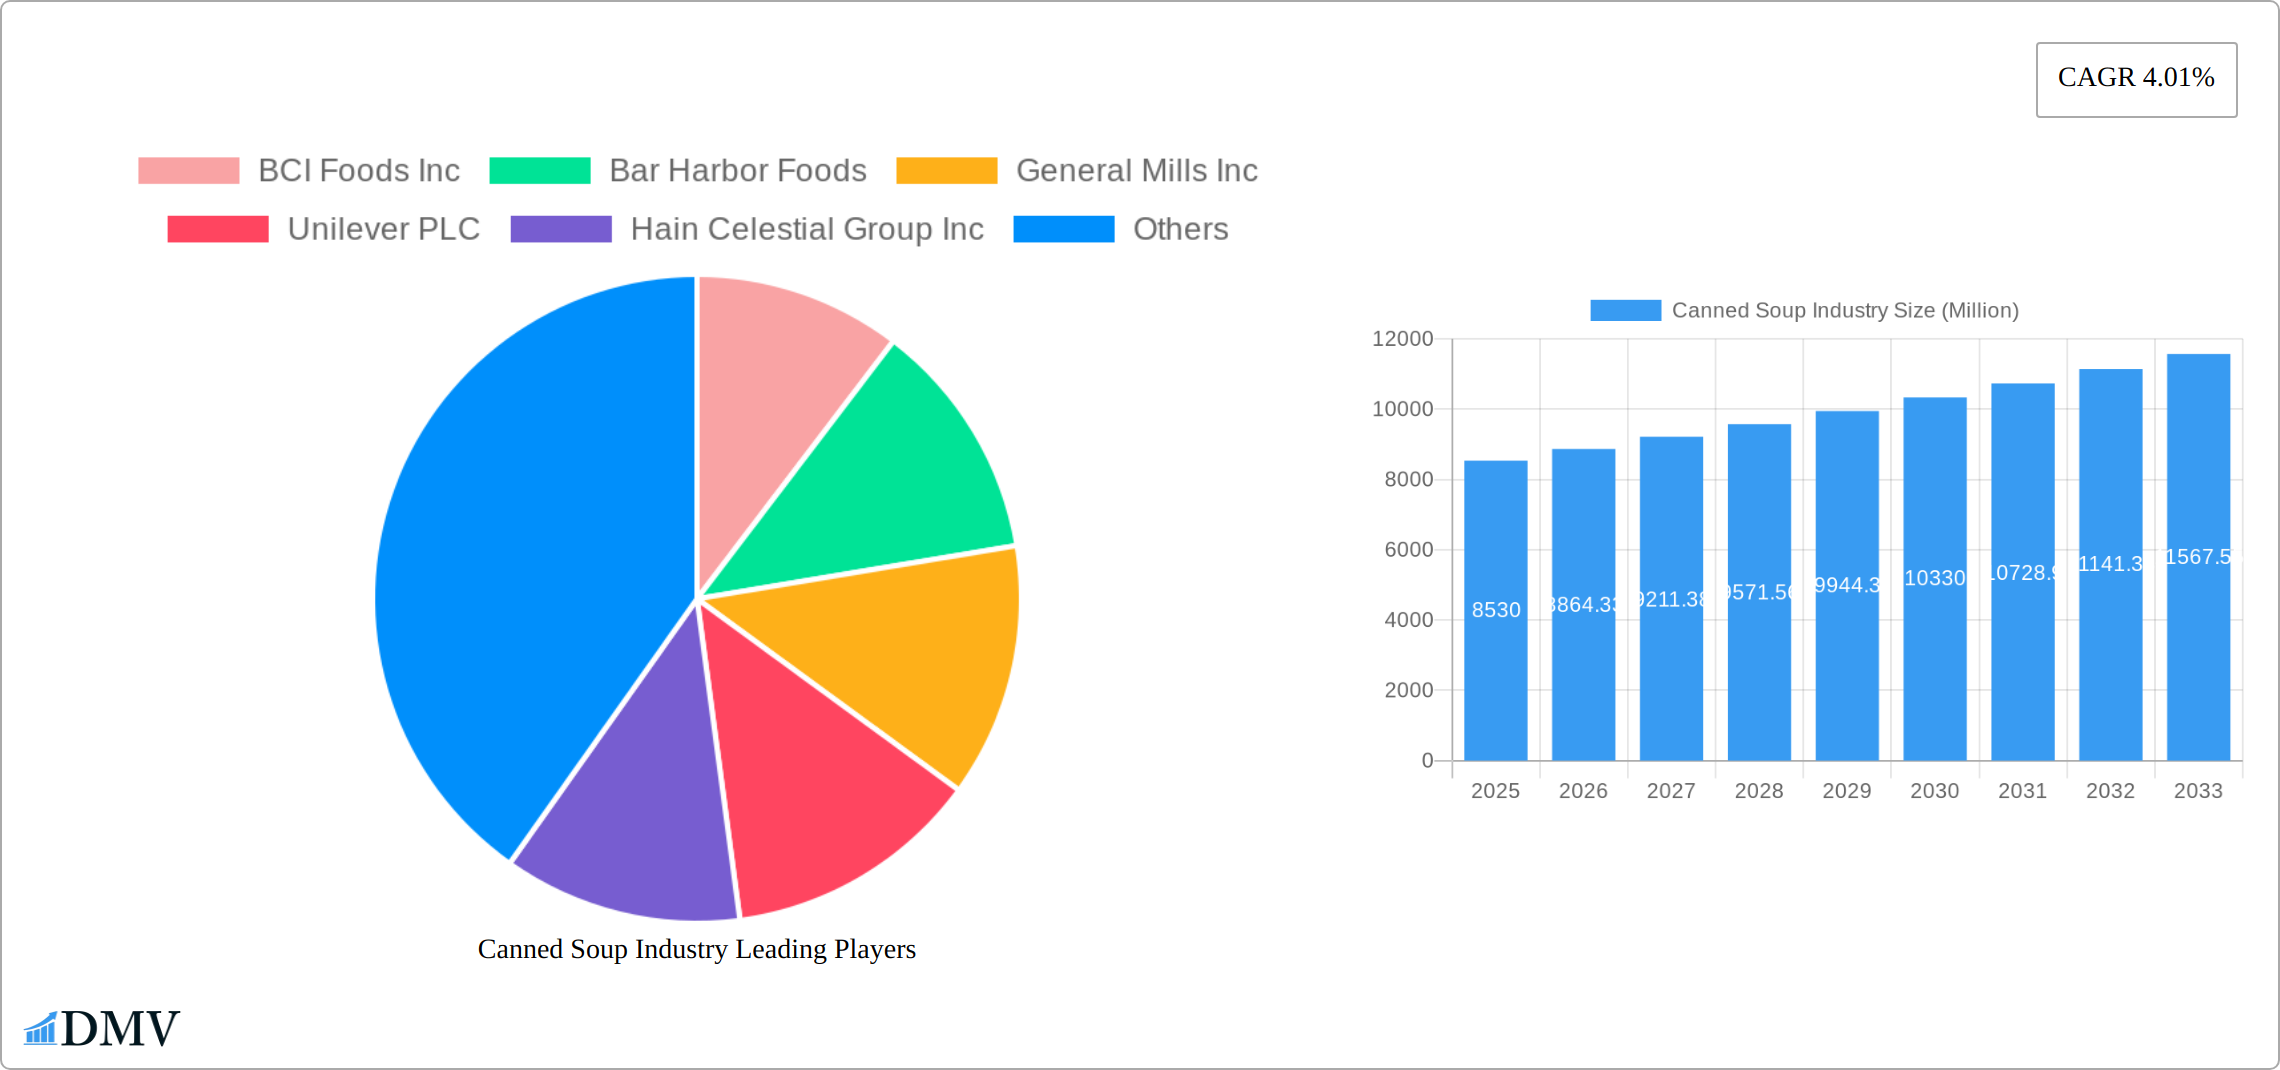
The canned soup market, valued at $8.53 billion in 2025, is projected to experience steady growth, driven by factors such as its convenience, affordability, and long shelf life, making it a staple in many households globally. The market's Compound Annual Growth Rate (CAGR) of 4.01% from 2019-2024 indicates consistent demand, even amidst evolving consumer preferences towards healthier and more diverse food options. Key growth drivers include the increasing urbanization and busy lifestyles leading to a higher demand for quick and convenient meal options. The ready-to-eat segment is expected to dominate due to its time-saving appeal. Furthermore, the organic segment is witnessing significant growth as consumers become more health-conscious. Distribution channels are diversifying, with online retail stores gaining traction, alongside traditional supermarkets and convenience stores. However, increasing competition from fresh and frozen alternatives, fluctuating raw material prices, and growing concerns about high sodium content in certain canned soups pose potential restraints to market expansion. Regional differences in consumer preferences and purchasing power also contribute to varying market growth rates across North America (strong established market), Europe (mature market with potential for premiumization), Asia-Pacific (high growth potential due to increasing disposable income and changing dietary habits), and other regions. Major players such as Campbell Soup Company, General Mills, and Unilever are actively involved in product innovation and diversification strategies to maintain their market share.
The canned soup market's segmentation plays a vital role in shaping its future trajectory. The condensed soup segment remains a significant portion of the market due to its versatility and affordability. However, the ready-to-eat segment is demonstrating robust growth, showcasing a preference for ease and convenience. Within the category segment, organic canned soups are gaining popularity, reflecting a rising consumer focus on health and wellness. The distribution channel analysis reveals the continued importance of supermarkets and hypermarkets. However, the rise of online retail channels signifies a shift towards e-commerce, emphasizing the need for manufacturers to adapt their strategies to reach consumers through multiple channels. Geographic variations highlight opportunities in emerging markets, particularly in Asia-Pacific, where rising incomes and changing lifestyles are driving demand for convenience foods. The competitive landscape reveals a blend of established players and smaller niche brands, indicating a dynamic market with opportunities for innovation and brand differentiation.
Canned Soup Industry: A Comprehensive Market Report (2019-2033)
This insightful report provides a detailed analysis of the global canned soup industry, offering valuable insights for stakeholders seeking to understand market dynamics, growth opportunities, and competitive landscapes. The study period spans from 2019 to 2033, with 2025 serving as both the base and estimated year. The report projects robust growth, with the market expected to reach xx Million by 2033.
Canned Soup Industry Market Composition & Trends
This section delves into the competitive dynamics of the canned soup market, analyzing market concentration, innovation drivers, regulatory influences, substitute products, and key end-user segments. The report assesses the market share distribution among major players like Campbell Soup Company, The Kraft Heinz Company, Unilever PLC, and General Mills Inc., revealing a moderately concentrated market with opportunities for both established players and emerging entrants. Furthermore, it examines the impact of mergers and acquisitions (M&A) activities, with an estimated xx Million in M&A deal values recorded during the historical period (2019-2024).
- Market Concentration: Moderately concentrated, with top players holding xx% market share.
- Innovation Catalysts: Growing demand for convenient, healthy, and diverse options fuels innovation.
- Regulatory Landscape: Government regulations concerning food safety and labeling influence industry practices.
- Substitute Products: Ready-made meals, fresh soups, and instant soups pose competitive challenges.
- End-User Profiles: Consumers across various demographics (age, income, lifestyle) constitute the end-user base.
- M&A Activity: Consolidation through acquisitions and mergers is a recurring theme, driving market concentration.

Canned Soup Industry Industry Evolution
This section offers a comprehensive overview of the canned soup industry's evolution from 2019 to 2033, analyzing market growth trajectories, technological advancements, and the shift in consumer preferences. The historical period (2019-2024) witnessed a Compound Annual Growth Rate (CAGR) of xx%, driven by factors such as increasing consumer demand for convenient food options and the introduction of innovative flavors and formats. Technological advancements in packaging and processing have improved product shelf life and quality, contributing to market expansion. Shifting consumer preferences towards healthier and more diverse options have also influenced product development, with a rise in demand for organic and plant-based canned soups. The forecast period (2025-2033) projects a CAGR of xx%, driven by continued innovation, expansion into new markets, and changing consumer habits.
Leading Regions, Countries, or Segments in Canned Soup Industry
The report identifies key regions, countries, and market segments driving growth within the canned soup industry. Analysis encompasses different soup types (Condensed, Ready-to-Eat), categories (Conventional, Organic), and distribution channels (Supermarkets/Hypermarkets, Convenience/Grocery Stores, Food Specialty Stores, Online Retail Stores, Other Distribution Channels).
Key Drivers:
- North America: Strong consumer base, established distribution networks, and high disposable income.
- Europe: Growing demand for convenient and healthy food options, particularly in Western Europe.
- Asia-Pacific: Rising urbanization and changing dietary habits fuel market expansion.
- Ready-to-Eat Segment: Fastest-growing segment due to convenience and increasing demand.
- Organic Category: Expanding rapidly driven by health-conscious consumers.
- Supermarkets/Hypermarkets: Dominant distribution channel due to wide reach and consumer preference.
Dominance Factors: Mature markets in North America and Europe continue to drive a significant portion of global sales, however, emerging economies in Asia-Pacific are demonstrating rapid growth due to expanding middle-class populations and increased urbanization. The preference for ready-to-eat soups over condensed variants is also a contributing factor to segment dominance.
Canned Soup Industry Product Innovations
Recent innovations include the introduction of plant-based options, gluten-free varieties, and unique flavor profiles catering to diverse consumer preferences. Technological advancements in packaging have enhanced product shelf life and convenience, further contributing to market growth. Companies are focusing on clean label initiatives, removing artificial colors, flavors, and preservatives, to meet the demand for healthier options. Unique selling propositions (USPs) include bold flavor combinations, convenient packaging formats, and health-focused ingredient lists.
Propelling Factors for Canned Soup Industry Growth
Key growth drivers include rising disposable incomes, increasing urbanization, changing lifestyles favoring convenience, and the launch of innovative products with diverse flavors and health benefits. Government regulations promoting food safety and healthy eating further contribute to the industry's growth trajectory. The rising demand for convenient and healthy food options, particularly among millennials and Gen Z, fuels market expansion.
Obstacles in the Canned Soup Industry Market
Challenges include intense competition from substitute products, fluctuating raw material prices, potential supply chain disruptions, and evolving consumer preferences. Stringent food safety regulations and changing consumer perceptions of canned foods also represent hurdles to overcome. These factors influence production costs, profitability, and overall market growth.
Future Opportunities in Canned Soup Industry
Emerging opportunities lie in expanding into untapped markets, particularly in developing economies, introducing innovative product formats and flavors, and leveraging online retail channels for increased market reach. Focusing on sustainability initiatives and promoting eco-friendly packaging options will also present significant growth opportunities.
Major Players in the Canned Soup Industry Ecosystem
- BCI Foods Inc
- Bar Harbor Foods
- General Mills Inc
- Unilever PLC
- Hain Celestial Group Inc
- F Whitlock & Sons
- The Kraft Heinz Company
- Baxters Food Group Limited
- Amy's Kitchen Inc
- Campbell Soup Company
- Sprague Foods Ltd
Key Developments in Canned Soup Industry Industry
- January 2023: Heinz UK launched its popular canned Plant-Based soup products, including Creamy Tomato Soup and Beanz & Sausages, expanding its vegan offerings and increasing its presence in the rapidly growing plant-based food market.
- January 2023: Campbell Soup Company introduced Chunky Ghost pepper chicken noodle soup, a significantly spicier version of its existing product, attracting consumers seeking adventurous flavor profiles and catering to a specific niche market.
- April 2023: F Whitlock & Sons launched a new range of canned soups with unique flavors (peri-peri chicken, Moroccan spiced carrot and lentil soup, Louisiana-style tomato, capsicum, and corn gumbo), emphasizing the use of natural ingredients and enhancing its appeal to health-conscious consumers.
Strategic Canned Soup Industry Market Forecast
The canned soup industry is poised for continued growth, driven by evolving consumer preferences, product innovations, and expanding distribution channels. The forecast period (2025-2033) anticipates significant market expansion, with opportunities for both existing players and new entrants. Technological advancements, such as improved packaging and processing techniques, will enhance product quality and shelf life. Focus on healthy, convenient, and diverse options will be crucial for success in this dynamic market.
Canned Soup Industry Segmentation
-
1. Type
- 1.1. Condensed
- 1.2. Ready-to-Eat
-
2. Category
- 2.1. Conventional
- 2.2. Organic
-
3. Distribution Channel
- 3.1. Supermarkets/Hypermarkets
- 3.2. Convenience/Grocery Stores
- 3.3. Food Specialty Stores
- 3.4. Online Retail Stores
- 3.5. Other Distribution Channels
Canned Soup Industry Segmentation By Geography
-
1. North America
- 1.1. United States
- 1.2. Canada
- 1.3. Mexico
- 1.4. Rest of North America
-
2. Europe
- 2.1. Spain
- 2.2. United Kingdom
- 2.3. Germany
- 2.4. France
- 2.5. Italy
- 2.6. Russia
- 2.7. Rest of Europe
-
3. Asia Pacific
- 3.1. China
- 3.2. Japan
- 3.3. India
- 3.4. Australia
- 3.5. Rest of Asia Pacific
-
4. South America
- 4.1. Brazil
- 4.2. Argentina
- 4.3. Rest of South America
-
5. Middle East and Africa
- 5.1. South Africa
- 5.2. United Arab Emirates
- 5.3. Rest of Middle East and Africa

Canned Soup Industry REPORT HIGHLIGHTS
| Aspects | Details |
|---|---|
| Study Period | 2019-2033 |
| Base Year | 2024 |
| Estimated Year | 2025 |
| Forecast Period | 2025-2033 |
| Historical Period | 2019-2024 |
| Growth Rate | CAGR of 4.01% from 2019-2033 |
| Segmentation |
|
Table of Contents
- 1. Introduction
- 1.1. Research Scope
- 1.2. Market Segmentation
- 1.3. Research Methodology
- 1.4. Definitions and Assumptions
- 2. Executive Summary
- 2.1. Introduction
- 3. Market Dynamics
- 3.1. Introduction
- 3.2. Market Drivers
- 3.2.1. Increasing Expenditure on Convenience Food Products; The Growing Trend of Vegan Food Products Drives the Market of Plant-based Canned Soup Market
- 3.3. Market Restrains
- 3.3.1. Food additives present in Canned Soup products can hinder the market growth
- 3.4. Market Trends
- 3.4.1. Rise in Spending on Convenience Products
- 4. Market Factor Analysis
- 4.1. Porters Five Forces
- 4.2. Supply/Value Chain
- 4.3. PESTEL analysis
- 4.4. Market Entropy
- 4.5. Patent/Trademark Analysis
- 5. Global Canned Soup Industry Analysis, Insights and Forecast, 2019-2031
- 5.1. Market Analysis, Insights and Forecast - by Type
- 5.1.1. Condensed
- 5.1.2. Ready-to-Eat
- 5.2. Market Analysis, Insights and Forecast - by Category
- 5.2.1. Conventional
- 5.2.2. Organic
- 5.3. Market Analysis, Insights and Forecast - by Distribution Channel
- 5.3.1. Supermarkets/Hypermarkets
- 5.3.2. Convenience/Grocery Stores
- 5.3.3. Food Specialty Stores
- 5.3.4. Online Retail Stores
- 5.3.5. Other Distribution Channels
- 5.4. Market Analysis, Insights and Forecast - by Region
- 5.4.1. North America
- 5.4.2. Europe
- 5.4.3. Asia Pacific
- 5.4.4. South America
- 5.4.5. Middle East and Africa
- 5.1. Market Analysis, Insights and Forecast - by Type
- 6. North America Canned Soup Industry Analysis, Insights and Forecast, 2019-2031
- 6.1. Market Analysis, Insights and Forecast - by Type
- 6.1.1. Condensed
- 6.1.2. Ready-to-Eat
- 6.2. Market Analysis, Insights and Forecast - by Category
- 6.2.1. Conventional
- 6.2.2. Organic
- 6.3. Market Analysis, Insights and Forecast - by Distribution Channel
- 6.3.1. Supermarkets/Hypermarkets
- 6.3.2. Convenience/Grocery Stores
- 6.3.3. Food Specialty Stores
- 6.3.4. Online Retail Stores
- 6.3.5. Other Distribution Channels
- 6.1. Market Analysis, Insights and Forecast - by Type
- 7. Europe Canned Soup Industry Analysis, Insights and Forecast, 2019-2031
- 7.1. Market Analysis, Insights and Forecast - by Type
- 7.1.1. Condensed
- 7.1.2. Ready-to-Eat
- 7.2. Market Analysis, Insights and Forecast - by Category
- 7.2.1. Conventional
- 7.2.2. Organic
- 7.3. Market Analysis, Insights and Forecast - by Distribution Channel
- 7.3.1. Supermarkets/Hypermarkets
- 7.3.2. Convenience/Grocery Stores
- 7.3.3. Food Specialty Stores
- 7.3.4. Online Retail Stores
- 7.3.5. Other Distribution Channels
- 7.1. Market Analysis, Insights and Forecast - by Type
- 8. Asia Pacific Canned Soup Industry Analysis, Insights and Forecast, 2019-2031
- 8.1. Market Analysis, Insights and Forecast - by Type
- 8.1.1. Condensed
- 8.1.2. Ready-to-Eat
- 8.2. Market Analysis, Insights and Forecast - by Category
- 8.2.1. Conventional
- 8.2.2. Organic
- 8.3. Market Analysis, Insights and Forecast - by Distribution Channel
- 8.3.1. Supermarkets/Hypermarkets
- 8.3.2. Convenience/Grocery Stores
- 8.3.3. Food Specialty Stores
- 8.3.4. Online Retail Stores
- 8.3.5. Other Distribution Channels
- 8.1. Market Analysis, Insights and Forecast - by Type
- 9. South America Canned Soup Industry Analysis, Insights and Forecast, 2019-2031
- 9.1. Market Analysis, Insights and Forecast - by Type
- 9.1.1. Condensed
- 9.1.2. Ready-to-Eat
- 9.2. Market Analysis, Insights and Forecast - by Category
- 9.2.1. Conventional
- 9.2.2. Organic
- 9.3. Market Analysis, Insights and Forecast - by Distribution Channel
- 9.3.1. Supermarkets/Hypermarkets
- 9.3.2. Convenience/Grocery Stores
- 9.3.3. Food Specialty Stores
- 9.3.4. Online Retail Stores
- 9.3.5. Other Distribution Channels
- 9.1. Market Analysis, Insights and Forecast - by Type
- 10. Middle East and Africa Canned Soup Industry Analysis, Insights and Forecast, 2019-2031
- 10.1. Market Analysis, Insights and Forecast - by Type
- 10.1.1. Condensed
- 10.1.2. Ready-to-Eat
- 10.2. Market Analysis, Insights and Forecast - by Category
- 10.2.1. Conventional
- 10.2.2. Organic
- 10.3. Market Analysis, Insights and Forecast - by Distribution Channel
- 10.3.1. Supermarkets/Hypermarkets
- 10.3.2. Convenience/Grocery Stores
- 10.3.3. Food Specialty Stores
- 10.3.4. Online Retail Stores
- 10.3.5. Other Distribution Channels
- 10.1. Market Analysis, Insights and Forecast - by Type
- 11. North America Canned Soup Industry Analysis, Insights and Forecast, 2019-2031
- 11.1. Market Analysis, Insights and Forecast - By Country/Sub-region
- 11.1.1 United States
- 11.1.2 Canada
- 11.1.3 Mexico
- 11.1.4 Rest of North America
- 12. Europe Canned Soup Industry Analysis, Insights and Forecast, 2019-2031
- 12.1. Market Analysis, Insights and Forecast - By Country/Sub-region
- 12.1.1 Spain
- 12.1.2 United Kingdom
- 12.1.3 Germany
- 12.1.4 France
- 12.1.5 Italy
- 12.1.6 Russia
- 12.1.7 Rest of Europe
- 13. Asia Pacific Canned Soup Industry Analysis, Insights and Forecast, 2019-2031
- 13.1. Market Analysis, Insights and Forecast - By Country/Sub-region
- 13.1.1 China
- 13.1.2 Japan
- 13.1.3 India
- 13.1.4 Australia
- 13.1.5 Rest of Asia Pacific
- 14. South America Canned Soup Industry Analysis, Insights and Forecast, 2019-2031
- 14.1. Market Analysis, Insights and Forecast - By Country/Sub-region
- 14.1.1 Brazil
- 14.1.2 Argentina
- 14.1.3 Rest of South America
- 15. Middle East and Africa Canned Soup Industry Analysis, Insights and Forecast, 2019-2031
- 15.1. Market Analysis, Insights and Forecast - By Country/Sub-region
- 15.1.1 South Africa
- 15.1.2 United Arab Emirates
- 15.1.3 Rest of Middle East and Africa
- 16. Competitive Analysis
- 16.1. Global Market Share Analysis 2024
- 16.2. Company Profiles
- 16.2.1 BCI Foods Inc
- 16.2.1.1. Overview
- 16.2.1.2. Products
- 16.2.1.3. SWOT Analysis
- 16.2.1.4. Recent Developments
- 16.2.1.5. Financials (Based on Availability)
- 16.2.2 Bar Harbor Foods
- 16.2.2.1. Overview
- 16.2.2.2. Products
- 16.2.2.3. SWOT Analysis
- 16.2.2.4. Recent Developments
- 16.2.2.5. Financials (Based on Availability)
- 16.2.3 General Mills Inc
- 16.2.3.1. Overview
- 16.2.3.2. Products
- 16.2.3.3. SWOT Analysis
- 16.2.3.4. Recent Developments
- 16.2.3.5. Financials (Based on Availability)
- 16.2.4 Unilever PLC
- 16.2.4.1. Overview
- 16.2.4.2. Products
- 16.2.4.3. SWOT Analysis
- 16.2.4.4. Recent Developments
- 16.2.4.5. Financials (Based on Availability)
- 16.2.5 Hain Celestial Group Inc
- 16.2.5.1. Overview
- 16.2.5.2. Products
- 16.2.5.3. SWOT Analysis
- 16.2.5.4. Recent Developments
- 16.2.5.5. Financials (Based on Availability)
- 16.2.6 F Whitlock & Sons
- 16.2.6.1. Overview
- 16.2.6.2. Products
- 16.2.6.3. SWOT Analysis
- 16.2.6.4. Recent Developments
- 16.2.6.5. Financials (Based on Availability)
- 16.2.7 The Kraft Heinz Company
- 16.2.7.1. Overview
- 16.2.7.2. Products
- 16.2.7.3. SWOT Analysis
- 16.2.7.4. Recent Developments
- 16.2.7.5. Financials (Based on Availability)
- 16.2.8 Baxters Food Group Limited
- 16.2.8.1. Overview
- 16.2.8.2. Products
- 16.2.8.3. SWOT Analysis
- 16.2.8.4. Recent Developments
- 16.2.8.5. Financials (Based on Availability)
- 16.2.9 Amy's Kitchen Inc
- 16.2.9.1. Overview
- 16.2.9.2. Products
- 16.2.9.3. SWOT Analysis
- 16.2.9.4. Recent Developments
- 16.2.9.5. Financials (Based on Availability)
- 16.2.10 Campbell Soup Company
- 16.2.10.1. Overview
- 16.2.10.2. Products
- 16.2.10.3. SWOT Analysis
- 16.2.10.4. Recent Developments
- 16.2.10.5. Financials (Based on Availability)
- 16.2.11 Sprague Foods Ltd
- 16.2.11.1. Overview
- 16.2.11.2. Products
- 16.2.11.3. SWOT Analysis
- 16.2.11.4. Recent Developments
- 16.2.11.5. Financials (Based on Availability)
- 16.2.1 BCI Foods Inc
List of Figures
- Figure 1: Global Canned Soup Industry Revenue Breakdown (Million, %) by Region 2024 & 2032
- Figure 2: North America Canned Soup Industry Revenue (Million), by Country 2024 & 2032
- Figure 3: North America Canned Soup Industry Revenue Share (%), by Country 2024 & 2032
- Figure 4: Europe Canned Soup Industry Revenue (Million), by Country 2024 & 2032
- Figure 5: Europe Canned Soup Industry Revenue Share (%), by Country 2024 & 2032
- Figure 6: Asia Pacific Canned Soup Industry Revenue (Million), by Country 2024 & 2032
- Figure 7: Asia Pacific Canned Soup Industry Revenue Share (%), by Country 2024 & 2032
- Figure 8: South America Canned Soup Industry Revenue (Million), by Country 2024 & 2032
- Figure 9: South America Canned Soup Industry Revenue Share (%), by Country 2024 & 2032
- Figure 10: Middle East and Africa Canned Soup Industry Revenue (Million), by Country 2024 & 2032
- Figure 11: Middle East and Africa Canned Soup Industry Revenue Share (%), by Country 2024 & 2032
- Figure 12: North America Canned Soup Industry Revenue (Million), by Type 2024 & 2032
- Figure 13: North America Canned Soup Industry Revenue Share (%), by Type 2024 & 2032
- Figure 14: North America Canned Soup Industry Revenue (Million), by Category 2024 & 2032
- Figure 15: North America Canned Soup Industry Revenue Share (%), by Category 2024 & 2032
- Figure 16: North America Canned Soup Industry Revenue (Million), by Distribution Channel 2024 & 2032
- Figure 17: North America Canned Soup Industry Revenue Share (%), by Distribution Channel 2024 & 2032
- Figure 18: North America Canned Soup Industry Revenue (Million), by Country 2024 & 2032
- Figure 19: North America Canned Soup Industry Revenue Share (%), by Country 2024 & 2032
- Figure 20: Europe Canned Soup Industry Revenue (Million), by Type 2024 & 2032
- Figure 21: Europe Canned Soup Industry Revenue Share (%), by Type 2024 & 2032
- Figure 22: Europe Canned Soup Industry Revenue (Million), by Category 2024 & 2032
- Figure 23: Europe Canned Soup Industry Revenue Share (%), by Category 2024 & 2032
- Figure 24: Europe Canned Soup Industry Revenue (Million), by Distribution Channel 2024 & 2032
- Figure 25: Europe Canned Soup Industry Revenue Share (%), by Distribution Channel 2024 & 2032
- Figure 26: Europe Canned Soup Industry Revenue (Million), by Country 2024 & 2032
- Figure 27: Europe Canned Soup Industry Revenue Share (%), by Country 2024 & 2032
- Figure 28: Asia Pacific Canned Soup Industry Revenue (Million), by Type 2024 & 2032
- Figure 29: Asia Pacific Canned Soup Industry Revenue Share (%), by Type 2024 & 2032
- Figure 30: Asia Pacific Canned Soup Industry Revenue (Million), by Category 2024 & 2032
- Figure 31: Asia Pacific Canned Soup Industry Revenue Share (%), by Category 2024 & 2032
- Figure 32: Asia Pacific Canned Soup Industry Revenue (Million), by Distribution Channel 2024 & 2032
- Figure 33: Asia Pacific Canned Soup Industry Revenue Share (%), by Distribution Channel 2024 & 2032
- Figure 34: Asia Pacific Canned Soup Industry Revenue (Million), by Country 2024 & 2032
- Figure 35: Asia Pacific Canned Soup Industry Revenue Share (%), by Country 2024 & 2032
- Figure 36: South America Canned Soup Industry Revenue (Million), by Type 2024 & 2032
- Figure 37: South America Canned Soup Industry Revenue Share (%), by Type 2024 & 2032
- Figure 38: South America Canned Soup Industry Revenue (Million), by Category 2024 & 2032
- Figure 39: South America Canned Soup Industry Revenue Share (%), by Category 2024 & 2032
- Figure 40: South America Canned Soup Industry Revenue (Million), by Distribution Channel 2024 & 2032
- Figure 41: South America Canned Soup Industry Revenue Share (%), by Distribution Channel 2024 & 2032
- Figure 42: South America Canned Soup Industry Revenue (Million), by Country 2024 & 2032
- Figure 43: South America Canned Soup Industry Revenue Share (%), by Country 2024 & 2032
- Figure 44: Middle East and Africa Canned Soup Industry Revenue (Million), by Type 2024 & 2032
- Figure 45: Middle East and Africa Canned Soup Industry Revenue Share (%), by Type 2024 & 2032
- Figure 46: Middle East and Africa Canned Soup Industry Revenue (Million), by Category 2024 & 2032
- Figure 47: Middle East and Africa Canned Soup Industry Revenue Share (%), by Category 2024 & 2032
- Figure 48: Middle East and Africa Canned Soup Industry Revenue (Million), by Distribution Channel 2024 & 2032
- Figure 49: Middle East and Africa Canned Soup Industry Revenue Share (%), by Distribution Channel 2024 & 2032
- Figure 50: Middle East and Africa Canned Soup Industry Revenue (Million), by Country 2024 & 2032
- Figure 51: Middle East and Africa Canned Soup Industry Revenue Share (%), by Country 2024 & 2032
List of Tables
- Table 1: Global Canned Soup Industry Revenue Million Forecast, by Region 2019 & 2032
- Table 2: Global Canned Soup Industry Revenue Million Forecast, by Type 2019 & 2032
- Table 3: Global Canned Soup Industry Revenue Million Forecast, by Category 2019 & 2032
- Table 4: Global Canned Soup Industry Revenue Million Forecast, by Distribution Channel 2019 & 2032
- Table 5: Global Canned Soup Industry Revenue Million Forecast, by Region 2019 & 2032
- Table 6: Global Canned Soup Industry Revenue Million Forecast, by Country 2019 & 2032
- Table 7: United States Canned Soup Industry Revenue (Million) Forecast, by Application 2019 & 2032
- Table 8: Canada Canned Soup Industry Revenue (Million) Forecast, by Application 2019 & 2032
- Table 9: Mexico Canned Soup Industry Revenue (Million) Forecast, by Application 2019 & 2032
- Table 10: Rest of North America Canned Soup Industry Revenue (Million) Forecast, by Application 2019 & 2032
- Table 11: Global Canned Soup Industry Revenue Million Forecast, by Country 2019 & 2032
- Table 12: Spain Canned Soup Industry Revenue (Million) Forecast, by Application 2019 & 2032
- Table 13: United Kingdom Canned Soup Industry Revenue (Million) Forecast, by Application 2019 & 2032
- Table 14: Germany Canned Soup Industry Revenue (Million) Forecast, by Application 2019 & 2032
- Table 15: France Canned Soup Industry Revenue (Million) Forecast, by Application 2019 & 2032
- Table 16: Italy Canned Soup Industry Revenue (Million) Forecast, by Application 2019 & 2032
- Table 17: Russia Canned Soup Industry Revenue (Million) Forecast, by Application 2019 & 2032
- Table 18: Rest of Europe Canned Soup Industry Revenue (Million) Forecast, by Application 2019 & 2032
- Table 19: Global Canned Soup Industry Revenue Million Forecast, by Country 2019 & 2032
- Table 20: China Canned Soup Industry Revenue (Million) Forecast, by Application 2019 & 2032
- Table 21: Japan Canned Soup Industry Revenue (Million) Forecast, by Application 2019 & 2032
- Table 22: India Canned Soup Industry Revenue (Million) Forecast, by Application 2019 & 2032
- Table 23: Australia Canned Soup Industry Revenue (Million) Forecast, by Application 2019 & 2032
- Table 24: Rest of Asia Pacific Canned Soup Industry Revenue (Million) Forecast, by Application 2019 & 2032
- Table 25: Global Canned Soup Industry Revenue Million Forecast, by Country 2019 & 2032
- Table 26: Brazil Canned Soup Industry Revenue (Million) Forecast, by Application 2019 & 2032
- Table 27: Argentina Canned Soup Industry Revenue (Million) Forecast, by Application 2019 & 2032
- Table 28: Rest of South America Canned Soup Industry Revenue (Million) Forecast, by Application 2019 & 2032
- Table 29: Global Canned Soup Industry Revenue Million Forecast, by Country 2019 & 2032
- Table 30: South Africa Canned Soup Industry Revenue (Million) Forecast, by Application 2019 & 2032
- Table 31: United Arab Emirates Canned Soup Industry Revenue (Million) Forecast, by Application 2019 & 2032
- Table 32: Rest of Middle East and Africa Canned Soup Industry Revenue (Million) Forecast, by Application 2019 & 2032
- Table 33: Global Canned Soup Industry Revenue Million Forecast, by Type 2019 & 2032
- Table 34: Global Canned Soup Industry Revenue Million Forecast, by Category 2019 & 2032
- Table 35: Global Canned Soup Industry Revenue Million Forecast, by Distribution Channel 2019 & 2032
- Table 36: Global Canned Soup Industry Revenue Million Forecast, by Country 2019 & 2032
- Table 37: United States Canned Soup Industry Revenue (Million) Forecast, by Application 2019 & 2032
- Table 38: Canada Canned Soup Industry Revenue (Million) Forecast, by Application 2019 & 2032
- Table 39: Mexico Canned Soup Industry Revenue (Million) Forecast, by Application 2019 & 2032
- Table 40: Rest of North America Canned Soup Industry Revenue (Million) Forecast, by Application 2019 & 2032
- Table 41: Global Canned Soup Industry Revenue Million Forecast, by Type 2019 & 2032
- Table 42: Global Canned Soup Industry Revenue Million Forecast, by Category 2019 & 2032
- Table 43: Global Canned Soup Industry Revenue Million Forecast, by Distribution Channel 2019 & 2032
- Table 44: Global Canned Soup Industry Revenue Million Forecast, by Country 2019 & 2032
- Table 45: Spain Canned Soup Industry Revenue (Million) Forecast, by Application 2019 & 2032
- Table 46: United Kingdom Canned Soup Industry Revenue (Million) Forecast, by Application 2019 & 2032
- Table 47: Germany Canned Soup Industry Revenue (Million) Forecast, by Application 2019 & 2032
- Table 48: France Canned Soup Industry Revenue (Million) Forecast, by Application 2019 & 2032
- Table 49: Italy Canned Soup Industry Revenue (Million) Forecast, by Application 2019 & 2032
- Table 50: Russia Canned Soup Industry Revenue (Million) Forecast, by Application 2019 & 2032
- Table 51: Rest of Europe Canned Soup Industry Revenue (Million) Forecast, by Application 2019 & 2032
- Table 52: Global Canned Soup Industry Revenue Million Forecast, by Type 2019 & 2032
- Table 53: Global Canned Soup Industry Revenue Million Forecast, by Category 2019 & 2032
- Table 54: Global Canned Soup Industry Revenue Million Forecast, by Distribution Channel 2019 & 2032
- Table 55: Global Canned Soup Industry Revenue Million Forecast, by Country 2019 & 2032
- Table 56: China Canned Soup Industry Revenue (Million) Forecast, by Application 2019 & 2032
- Table 57: Japan Canned Soup Industry Revenue (Million) Forecast, by Application 2019 & 2032
- Table 58: India Canned Soup Industry Revenue (Million) Forecast, by Application 2019 & 2032
- Table 59: Australia Canned Soup Industry Revenue (Million) Forecast, by Application 2019 & 2032
- Table 60: Rest of Asia Pacific Canned Soup Industry Revenue (Million) Forecast, by Application 2019 & 2032
- Table 61: Global Canned Soup Industry Revenue Million Forecast, by Type 2019 & 2032
- Table 62: Global Canned Soup Industry Revenue Million Forecast, by Category 2019 & 2032
- Table 63: Global Canned Soup Industry Revenue Million Forecast, by Distribution Channel 2019 & 2032
- Table 64: Global Canned Soup Industry Revenue Million Forecast, by Country 2019 & 2032
- Table 65: Brazil Canned Soup Industry Revenue (Million) Forecast, by Application 2019 & 2032
- Table 66: Argentina Canned Soup Industry Revenue (Million) Forecast, by Application 2019 & 2032
- Table 67: Rest of South America Canned Soup Industry Revenue (Million) Forecast, by Application 2019 & 2032
- Table 68: Global Canned Soup Industry Revenue Million Forecast, by Type 2019 & 2032
- Table 69: Global Canned Soup Industry Revenue Million Forecast, by Category 2019 & 2032
- Table 70: Global Canned Soup Industry Revenue Million Forecast, by Distribution Channel 2019 & 2032
- Table 71: Global Canned Soup Industry Revenue Million Forecast, by Country 2019 & 2032
- Table 72: South Africa Canned Soup Industry Revenue (Million) Forecast, by Application 2019 & 2032
- Table 73: United Arab Emirates Canned Soup Industry Revenue (Million) Forecast, by Application 2019 & 2032
- Table 74: Rest of Middle East and Africa Canned Soup Industry Revenue (Million) Forecast, by Application 2019 & 2032
Frequently Asked Questions
1. What is the projected Compound Annual Growth Rate (CAGR) of the Canned Soup Industry?
The projected CAGR is approximately 4.01%.
2. Which companies are prominent players in the Canned Soup Industry?
Key companies in the market include BCI Foods Inc, Bar Harbor Foods, General Mills Inc, Unilever PLC, Hain Celestial Group Inc, F Whitlock & Sons, The Kraft Heinz Company, Baxters Food Group Limited, Amy's Kitchen Inc, Campbell Soup Company, Sprague Foods Ltd.
3. What are the main segments of the Canned Soup Industry?
The market segments include Type, Category, Distribution Channel.
4. Can you provide details about the market size?
The market size is estimated to be USD 8.53 Million as of 2022.
5. What are some drivers contributing to market growth?
Increasing Expenditure on Convenience Food Products; The Growing Trend of Vegan Food Products Drives the Market of Plant-based Canned Soup Market.
6. What are the notable trends driving market growth?
Rise in Spending on Convenience Products.
7. Are there any restraints impacting market growth?
Food additives present in Canned Soup products can hinder the market growth.
8. Can you provide examples of recent developments in the market?
April 2023: F Whitlock & Sons announced the launch of its new range of canned soups in three flavors. The launch includes new flavors such as peri-peri chicken, Moroccan spiced carrot and lentil soup, Louisiana-style tomato, capsicum, and corn gumbo. The company also claims that the range has no artificial colors, preservatives, or flavors.
9. What pricing options are available for accessing the report?
Pricing options include single-user, multi-user, and enterprise licenses priced at USD 4750, USD 5250, and USD 8750 respectively.
10. Is the market size provided in terms of value or volume?
The market size is provided in terms of value, measured in Million.
11. Are there any specific market keywords associated with the report?
Yes, the market keyword associated with the report is "Canned Soup Industry," which aids in identifying and referencing the specific market segment covered.
12. How do I determine which pricing option suits my needs best?
The pricing options vary based on user requirements and access needs. Individual users may opt for single-user licenses, while businesses requiring broader access may choose multi-user or enterprise licenses for cost-effective access to the report.
13. Are there any additional resources or data provided in the Canned Soup Industry report?
While the report offers comprehensive insights, it's advisable to review the specific contents or supplementary materials provided to ascertain if additional resources or data are available.
14. How can I stay updated on further developments or reports in the Canned Soup Industry?
To stay informed about further developments, trends, and reports in the Canned Soup Industry, consider subscribing to industry newsletters, following relevant companies and organizations, or regularly checking reputable industry news sources and publications.
Methodology
Step 1 - Identification of Relevant Samples Size from Population Database


Step 2 - Approaches for Defining Global Market Size (Value, Volume* & Price*)

Note*: In applicable scenarios
Step 3 - Data Sources
Primary Research
- Web Analytics
- Survey Reports
- Research Institute
- Latest Research Reports
- Opinion Leaders
Secondary Research
- Annual Reports
- White Paper
- Latest Press Release
- Industry Association
- Paid Database
- Investor Presentations

Step 4 - Data Triangulation
Involves using different sources of information in order to increase the validity of a study
These sources are likely to be stakeholders in a program - participants, other researchers, program staff, other community members, and so on.
Then we put all data in single framework & apply various statistical tools to find out the dynamic on the market.
During the analysis stage, feedback from the stakeholder groups would be compared to determine areas of agreement as well as areas of divergence
