

Key Insights
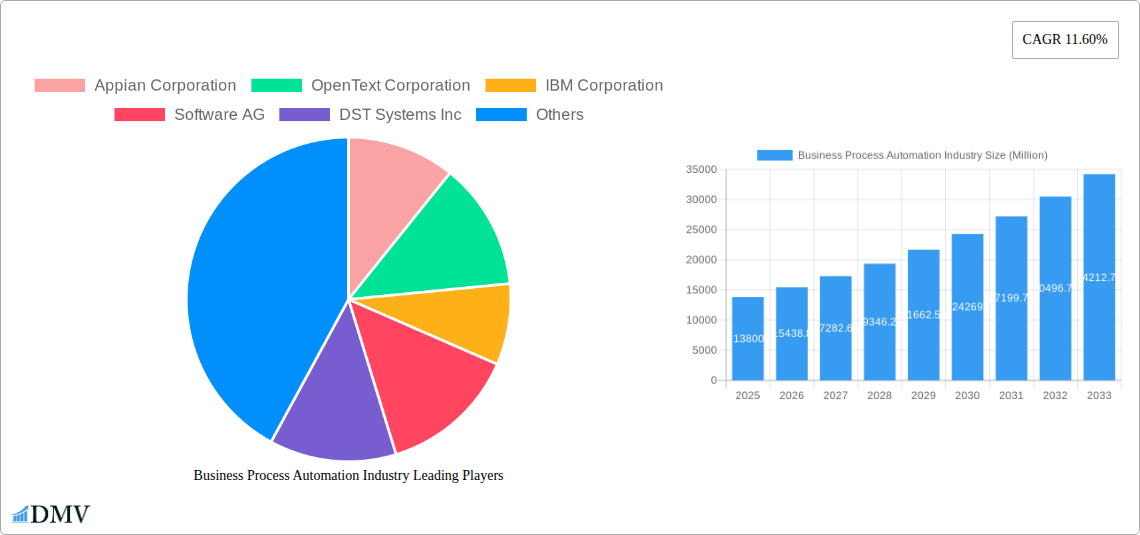
The Business Process Automation (BPA) market is experiencing robust growth, projected to reach \$13.80 billion in 2025 and exhibiting a Compound Annual Growth Rate (CAGR) of 11.60% from 2025 to 2033. This expansion is driven by several key factors. Firstly, the increasing need for operational efficiency and cost reduction across various industries fuels the adoption of BPA solutions. Businesses are increasingly seeking to streamline their processes, automate repetitive tasks, and improve overall productivity. Secondly, the rise of digital transformation initiatives and the growing availability of cloud-based BPA services are significantly contributing to market growth. Cloud solutions offer scalability, flexibility, and reduced upfront investment, making them attractive to businesses of all sizes. Technological advancements such as Artificial Intelligence (AI) and Machine Learning (ML) are further enhancing the capabilities of BPA systems, allowing for more sophisticated automation and intelligent process management. Finally, the growing demand for improved customer experience is also pushing businesses to adopt BPA solutions to enhance their operational efficiency and responsiveness to customer needs. The BFSI, Manufacturing, and IT & Telecommunication sectors represent major end-user segments, demonstrating substantial demand for BPA solutions.
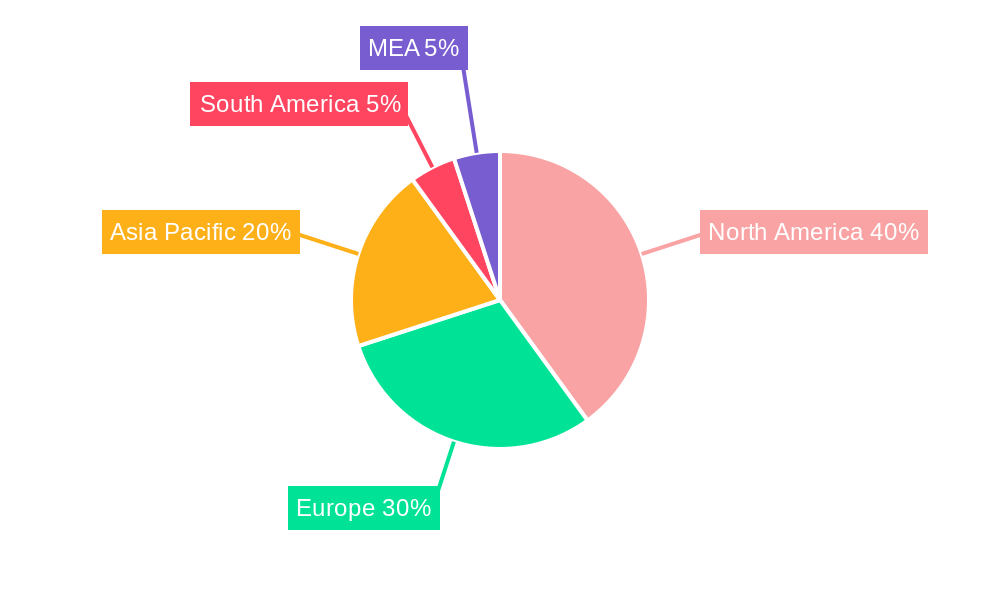
The BPA market is segmented by component (solution and service), deployment (on-demand and on-premise), organization size (SMEs and large enterprises), and end-user industry. The on-demand deployment model is gaining traction due to its ease of implementation and scalability. Large enterprises are the primary adopters, driven by their need for extensive automation capabilities. However, the growing awareness of BPA benefits among SMEs is expanding this market segment. Geographical distribution shows strong growth across North America, Europe, and the Asia-Pacific region, reflecting the global adoption of BPA across diverse economies. Leading vendors like Appian, OpenText, IBM, and others are driving innovation and competition within the market, fostering continued technological advancements and expansion. While challenges like integration complexities and security concerns exist, the overall market outlook remains positive, indicating a sustained period of growth fueled by the continuing digital transformation trend.
Business Process Automation Industry: A Comprehensive Market Report (2019-2033)
This in-depth report provides a comprehensive analysis of the Business Process Automation (BPA) industry, projecting a market valuation of $XX Million by 2033. It delves into market dynamics, technological advancements, key players, and future growth opportunities, offering invaluable insights for stakeholders across the BPA ecosystem. The study period covers 2019-2033, with 2025 serving as the base and estimated year. The forecast period spans 2025-2033, while the historical period encompasses 2019-2024.
Business Process Automation Industry Market Composition & Trends
This section evaluates the competitive landscape, innovation drivers, regulatory frameworks, substitute products, end-user profiles, and mergers and acquisitions (M&A) activities within the $XX Million BPA market. Market concentration is analyzed, highlighting the market share distribution among key players like Appian Corporation, OpenText Corporation, IBM Corporation, Software AG, DST Systems Inc, TIBCO Software Inc, Pegasystems Inc, Oracle Corporation, Bizagi Group Limited, and Newgen Software Technologies Ltd (list not exhaustive). The report assesses the impact of M&A activities, quantifying deal values in Millions and examining their influence on market consolidation and technological innovation. Innovation catalysts, such as AI integration and cloud deployment, are explored alongside regulatory changes affecting data privacy and security. The analysis also profiles end-users across various sectors, including BFSI, manufacturing, IT & telecommunications, and healthcare, identifying their unique BPA requirements and adoption rates.
Business Process Automation Industry Evolution
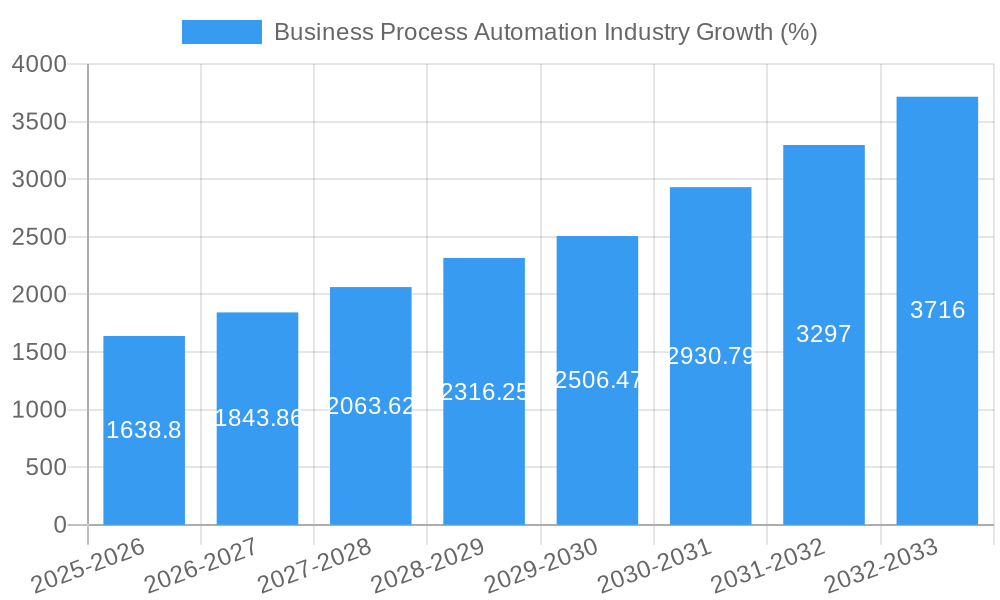
This section details the evolutionary trajectory of the BPA industry, examining market growth trajectories, technological advancements, and shifting consumer demands. Data points on compound annual growth rates (CAGRs) and adoption metrics across different segments are included. The analysis explores the transition from on-premise to on-demand deployments, the increasing adoption of AI and machine learning, and the growing demand for integrated BPA solutions. The impact of these factors on market growth is meticulously analyzed, along with the implications for different industry verticals. The report examines how evolving consumer expectations for faster, more efficient processes are driving innovation and shaping the future of the BPA industry.
Leading Regions, Countries, or Segments in Business Process Automation Industry
This section identifies the leading regions, countries, and segments within the BPA market. Key drivers for dominance are outlined using bullet points and detailed analysis.
- By Component: The report analyzes the market share of Solutions vs. Services, explaining the factors contributing to the dominance of either segment.
- By Deployment: A detailed comparison of On-demand and On-premise deployments, including the factors driving the growth of cloud-based solutions.
- By Organization Size: An in-depth analysis of the adoption rates among Small and Medium-sized Enterprises (SMEs) and Large Enterprises, highlighting the unique challenges and opportunities for each group.
- By End User: This section analyzes market leadership across Banking, Financial Services, and Insurance (BFSI); Manufacturing; IT and Telecommunication; Aerospace and Defense; Healthcare; Retail and Consumer Goods; and Other End Users. The analysis will highlight the specific factors driving high adoption rates within leading sectors. Investment trends, regulatory support, and industry-specific needs are key drivers discussed for each segment.
Business Process Automation Industry Product Innovations
This section presents an overview of recent product innovations within the BPA market, emphasizing unique selling propositions and technological advancements that are shaping industry dynamics. The report will focus on the introduction of new features, enhanced functionality, and improved performance metrics of existing solutions.
Propelling Factors for Business Process Automation Industry Growth
The growth of the BPA market is driven by technological advancements, economic factors, and regulatory influences. Technological advancements, like AI and machine learning, are enhancing automation capabilities. Economically, the need for increased efficiency and cost reduction fuels BPA adoption. Regulatory mandates promoting data security and compliance also contribute to market growth. Examples of specific regulations and their impact are provided.
Obstacles in the Business Process Automation Industry Market
Despite the positive outlook, the BPA market faces several challenges. Regulatory hurdles, particularly concerning data privacy and security, pose significant barriers to entry and market expansion. Supply chain disruptions can lead to delays in project implementation and increase costs. Intense competition among established players and new entrants also impacts market growth. The report quantifies the impact of these factors on the market using specific examples and data points.
Future Opportunities in Business Process Automation Industry
The BPA market presents several promising opportunities. Emerging technologies, such as hyperautomation and robotic process automation (RPA), are expanding the scope of automation. New markets in developing economies are opening up, presenting significant growth potential. Changes in consumer behavior and the growing need for digital transformation will further fuel demand for BPA solutions.
Major Players in the Business Process Automation Industry Ecosystem
- Appian Corporation
- OpenText Corporation
- IBM Corporation
- Software AG
- DST Systems Inc
- TIBCO Software Inc
- Pegasystems Inc
- Oracle Corporation
- Bizagi Group Limited
- Newgen Software Technologies Ltd
Key Developments in Business Process Automation Industry
- July 2022: Oracle updated its Fusion Sales automation tool, leveraging AI to enhance sales processes and increase deal closure rates. This reflects the increasing importance of AI in BPA solutions.
- May 2022: Digital Workforce partnered with Flowable to develop the Outsmart platform, aiming to provide comprehensive automation capabilities for complex business processes. This collaboration highlights the trend of strategic partnerships to deliver integrated BPA solutions.
Strategic Business Process Automation Industry Market Forecast
The BPA market is poised for significant growth, fueled by technological advancements, increasing digital transformation initiatives, and the ongoing need for improved operational efficiency. The market's expansion will be driven by the adoption of innovative solutions, expansion into new markets, and the increasing adoption of cloud-based deployment models. This positive outlook suggests a bright future for the BPA industry, promising substantial growth and opportunities for key players in the years to come.
Business Process Automation Industry Segmentation
-
1. Component
- 1.1. Solution
- 1.2. Service
-
2. Deployment
- 2.1. On-demand
- 2.2. On-premise
-
3. Organization Size
- 3.1. Small- and Medium-sized Enterprises
- 3.2. Large Enterprises
-
4. End User
- 4.1. Banking, Financial Services, and Insurance (BFSI)
- 4.2. Manufacturing
- 4.3. IT and Telecommunication
- 4.4. Aerospace and Defense
- 4.5. Healthcare
- 4.6. Retail and Consumer Goods
- 4.7. Other End Users
Business Process Automation Industry Segmentation By Geography
- 1. North America
- 2. Europe
- 3. Asia Pacific
- 4. Latin America
- 5. Middle East and Africa
Business Process Automation Industry REPORT HIGHLIGHTS
| Aspects | Details |
|---|---|
| Study Period | 2019-2033 |
| Base Year | 2024 |
| Estimated Year | 2025 |
| Forecast Period | 2025-2033 |
| Historical Period | 2019-2024 |
| Growth Rate | CAGR of 11.60% from 2019-2033 |
| Segmentation |
|
Table of Contents
- 1. Introduction
- 1.1. Research Scope
- 1.2. Market Segmentation
- 1.3. Research Methodology
- 1.4. Definitions and Assumptions
- 2. Executive Summary
- 2.1. Introduction
- 3. Market Dynamics
- 3.1. Introduction
- 3.2. Market Drivers
- 3.2.1. Increase Demand of Automating Business Process for Efficient Back-end process; Increase Adoption of Low Code Automation for Greater Accessibility
- 3.3. Market Restrains
- 3.3.1. Lack of Skilled Workforce
- 3.4. Market Trends
- 3.4.1. Small Enterprises are expected to grow at a higher pace on back of growing adoption of Business Process Management (BPM)
- 4. Market Factor Analysis
- 4.1. Porters Five Forces
- 4.2. Supply/Value Chain
- 4.3. PESTEL analysis
- 4.4. Market Entropy
- 4.5. Patent/Trademark Analysis
- 5. Global Business Process Automation Industry Analysis, Insights and Forecast, 2019-2031
- 5.1. Market Analysis, Insights and Forecast - by Component
- 5.1.1. Solution
- 5.1.2. Service
- 5.2. Market Analysis, Insights and Forecast - by Deployment
- 5.2.1. On-demand
- 5.2.2. On-premise
- 5.3. Market Analysis, Insights and Forecast - by Organization Size
- 5.3.1. Small- and Medium-sized Enterprises
- 5.3.2. Large Enterprises
- 5.4. Market Analysis, Insights and Forecast - by End User
- 5.4.1. Banking, Financial Services, and Insurance (BFSI)
- 5.4.2. Manufacturing
- 5.4.3. IT and Telecommunication
- 5.4.4. Aerospace and Defense
- 5.4.5. Healthcare
- 5.4.6. Retail and Consumer Goods
- 5.4.7. Other End Users
- 5.5. Market Analysis, Insights and Forecast - by Region
- 5.5.1. North America
- 5.5.2. Europe
- 5.5.3. Asia Pacific
- 5.5.4. Latin America
- 5.5.5. Middle East and Africa
- 5.1. Market Analysis, Insights and Forecast - by Component
- 6. North America Business Process Automation Industry Analysis, Insights and Forecast, 2019-2031
- 6.1. Market Analysis, Insights and Forecast - by Component
- 6.1.1. Solution
- 6.1.2. Service
- 6.2. Market Analysis, Insights and Forecast - by Deployment
- 6.2.1. On-demand
- 6.2.2. On-premise
- 6.3. Market Analysis, Insights and Forecast - by Organization Size
- 6.3.1. Small- and Medium-sized Enterprises
- 6.3.2. Large Enterprises
- 6.4. Market Analysis, Insights and Forecast - by End User
- 6.4.1. Banking, Financial Services, and Insurance (BFSI)
- 6.4.2. Manufacturing
- 6.4.3. IT and Telecommunication
- 6.4.4. Aerospace and Defense
- 6.4.5. Healthcare
- 6.4.6. Retail and Consumer Goods
- 6.4.7. Other End Users
- 6.1. Market Analysis, Insights and Forecast - by Component
- 7. Europe Business Process Automation Industry Analysis, Insights and Forecast, 2019-2031
- 7.1. Market Analysis, Insights and Forecast - by Component
- 7.1.1. Solution
- 7.1.2. Service
- 7.2. Market Analysis, Insights and Forecast - by Deployment
- 7.2.1. On-demand
- 7.2.2. On-premise
- 7.3. Market Analysis, Insights and Forecast - by Organization Size
- 7.3.1. Small- and Medium-sized Enterprises
- 7.3.2. Large Enterprises
- 7.4. Market Analysis, Insights and Forecast - by End User
- 7.4.1. Banking, Financial Services, and Insurance (BFSI)
- 7.4.2. Manufacturing
- 7.4.3. IT and Telecommunication
- 7.4.4. Aerospace and Defense
- 7.4.5. Healthcare
- 7.4.6. Retail and Consumer Goods
- 7.4.7. Other End Users
- 7.1. Market Analysis, Insights and Forecast - by Component
- 8. Asia Pacific Business Process Automation Industry Analysis, Insights and Forecast, 2019-2031
- 8.1. Market Analysis, Insights and Forecast - by Component
- 8.1.1. Solution
- 8.1.2. Service
- 8.2. Market Analysis, Insights and Forecast - by Deployment
- 8.2.1. On-demand
- 8.2.2. On-premise
- 8.3. Market Analysis, Insights and Forecast - by Organization Size
- 8.3.1. Small- and Medium-sized Enterprises
- 8.3.2. Large Enterprises
- 8.4. Market Analysis, Insights and Forecast - by End User
- 8.4.1. Banking, Financial Services, and Insurance (BFSI)
- 8.4.2. Manufacturing
- 8.4.3. IT and Telecommunication
- 8.4.4. Aerospace and Defense
- 8.4.5. Healthcare
- 8.4.6. Retail and Consumer Goods
- 8.4.7. Other End Users
- 8.1. Market Analysis, Insights and Forecast - by Component
- 9. Latin America Business Process Automation Industry Analysis, Insights and Forecast, 2019-2031
- 9.1. Market Analysis, Insights and Forecast - by Component
- 9.1.1. Solution
- 9.1.2. Service
- 9.2. Market Analysis, Insights and Forecast - by Deployment
- 9.2.1. On-demand
- 9.2.2. On-premise
- 9.3. Market Analysis, Insights and Forecast - by Organization Size
- 9.3.1. Small- and Medium-sized Enterprises
- 9.3.2. Large Enterprises
- 9.4. Market Analysis, Insights and Forecast - by End User
- 9.4.1. Banking, Financial Services, and Insurance (BFSI)
- 9.4.2. Manufacturing
- 9.4.3. IT and Telecommunication
- 9.4.4. Aerospace and Defense
- 9.4.5. Healthcare
- 9.4.6. Retail and Consumer Goods
- 9.4.7. Other End Users
- 9.1. Market Analysis, Insights and Forecast - by Component
- 10. Middle East and Africa Business Process Automation Industry Analysis, Insights and Forecast, 2019-2031
- 10.1. Market Analysis, Insights and Forecast - by Component
- 10.1.1. Solution
- 10.1.2. Service
- 10.2. Market Analysis, Insights and Forecast - by Deployment
- 10.2.1. On-demand
- 10.2.2. On-premise
- 10.3. Market Analysis, Insights and Forecast - by Organization Size
- 10.3.1. Small- and Medium-sized Enterprises
- 10.3.2. Large Enterprises
- 10.4. Market Analysis, Insights and Forecast - by End User
- 10.4.1. Banking, Financial Services, and Insurance (BFSI)
- 10.4.2. Manufacturing
- 10.4.3. IT and Telecommunication
- 10.4.4. Aerospace and Defense
- 10.4.5. Healthcare
- 10.4.6. Retail and Consumer Goods
- 10.4.7. Other End Users
- 10.1. Market Analysis, Insights and Forecast - by Component
- 11. North America Business Process Automation Industry Analysis, Insights and Forecast, 2019-2031
- 11.1. Market Analysis, Insights and Forecast - By Country/Sub-region
- 11.1.1 United States
- 11.1.2 Canada
- 11.1.3 Mexico
- 12. Europe Business Process Automation Industry Analysis, Insights and Forecast, 2019-2031
- 12.1. Market Analysis, Insights and Forecast - By Country/Sub-region
- 12.1.1 Germany
- 12.1.2 United Kingdom
- 12.1.3 France
- 12.1.4 Spain
- 12.1.5 Italy
- 12.1.6 Spain
- 12.1.7 Belgium
- 12.1.8 Netherland
- 12.1.9 Nordics
- 12.1.10 Rest of Europe
- 13. Asia Pacific Business Process Automation Industry Analysis, Insights and Forecast, 2019-2031
- 13.1. Market Analysis, Insights and Forecast - By Country/Sub-region
- 13.1.1 China
- 13.1.2 Japan
- 13.1.3 India
- 13.1.4 South Korea
- 13.1.5 Southeast Asia
- 13.1.6 Australia
- 13.1.7 Indonesia
- 13.1.8 Phillipes
- 13.1.9 Singapore
- 13.1.10 Thailandc
- 13.1.11 Rest of Asia Pacific
- 14. South America Business Process Automation Industry Analysis, Insights and Forecast, 2019-2031
- 14.1. Market Analysis, Insights and Forecast - By Country/Sub-region
- 14.1.1 Brazil
- 14.1.2 Argentina
- 14.1.3 Peru
- 14.1.4 Chile
- 14.1.5 Colombia
- 14.1.6 Ecuador
- 14.1.7 Venezuela
- 14.1.8 Rest of South America
- 15. North America Business Process Automation Industry Analysis, Insights and Forecast, 2019-2031
- 15.1. Market Analysis, Insights and Forecast - By Country/Sub-region
- 15.1.1 United States
- 15.1.2 Canada
- 15.1.3 Mexico
- 16. MEA Business Process Automation Industry Analysis, Insights and Forecast, 2019-2031
- 16.1. Market Analysis, Insights and Forecast - By Country/Sub-region
- 16.1.1 United Arab Emirates
- 16.1.2 Saudi Arabia
- 16.1.3 South Africa
- 16.1.4 Rest of Middle East and Africa
- 17. Competitive Analysis
- 17.1. Global Market Share Analysis 2024
- 17.2. Company Profiles
- 17.2.1 Appian Corporation
- 17.2.1.1. Overview
- 17.2.1.2. Products
- 17.2.1.3. SWOT Analysis
- 17.2.1.4. Recent Developments
- 17.2.1.5. Financials (Based on Availability)
- 17.2.2 OpenText Corporation
- 17.2.2.1. Overview
- 17.2.2.2. Products
- 17.2.2.3. SWOT Analysis
- 17.2.2.4. Recent Developments
- 17.2.2.5. Financials (Based on Availability)
- 17.2.3 IBM Corporation
- 17.2.3.1. Overview
- 17.2.3.2. Products
- 17.2.3.3. SWOT Analysis
- 17.2.3.4. Recent Developments
- 17.2.3.5. Financials (Based on Availability)
- 17.2.4 Software AG
- 17.2.4.1. Overview
- 17.2.4.2. Products
- 17.2.4.3. SWOT Analysis
- 17.2.4.4. Recent Developments
- 17.2.4.5. Financials (Based on Availability)
- 17.2.5 DST Systems Inc
- 17.2.5.1. Overview
- 17.2.5.2. Products
- 17.2.5.3. SWOT Analysis
- 17.2.5.4. Recent Developments
- 17.2.5.5. Financials (Based on Availability)
- 17.2.6 TIBCO Software Inc *List Not Exhaustive
- 17.2.6.1. Overview
- 17.2.6.2. Products
- 17.2.6.3. SWOT Analysis
- 17.2.6.4. Recent Developments
- 17.2.6.5. Financials (Based on Availability)
- 17.2.7 Pegasystems Inc
- 17.2.7.1. Overview
- 17.2.7.2. Products
- 17.2.7.3. SWOT Analysis
- 17.2.7.4. Recent Developments
- 17.2.7.5. Financials (Based on Availability)
- 17.2.8 Oracle Corporation
- 17.2.8.1. Overview
- 17.2.8.2. Products
- 17.2.8.3. SWOT Analysis
- 17.2.8.4. Recent Developments
- 17.2.8.5. Financials (Based on Availability)
- 17.2.9 Bizagi Group Limited
- 17.2.9.1. Overview
- 17.2.9.2. Products
- 17.2.9.3. SWOT Analysis
- 17.2.9.4. Recent Developments
- 17.2.9.5. Financials (Based on Availability)
- 17.2.10 Newgen Software Technologies Ltd
- 17.2.10.1. Overview
- 17.2.10.2. Products
- 17.2.10.3. SWOT Analysis
- 17.2.10.4. Recent Developments
- 17.2.10.5. Financials (Based on Availability)
- 17.2.1 Appian Corporation
List of Figures
- Figure 1: Global Business Process Automation Industry Revenue Breakdown (Million, %) by Region 2024 & 2032
- Figure 2: North America Business Process Automation Industry Revenue (Million), by Country 2024 & 2032
- Figure 3: North America Business Process Automation Industry Revenue Share (%), by Country 2024 & 2032
- Figure 4: Europe Business Process Automation Industry Revenue (Million), by Country 2024 & 2032
- Figure 5: Europe Business Process Automation Industry Revenue Share (%), by Country 2024 & 2032
- Figure 6: Asia Pacific Business Process Automation Industry Revenue (Million), by Country 2024 & 2032
- Figure 7: Asia Pacific Business Process Automation Industry Revenue Share (%), by Country 2024 & 2032
- Figure 8: South America Business Process Automation Industry Revenue (Million), by Country 2024 & 2032
- Figure 9: South America Business Process Automation Industry Revenue Share (%), by Country 2024 & 2032
- Figure 10: North America Business Process Automation Industry Revenue (Million), by Country 2024 & 2032
- Figure 11: North America Business Process Automation Industry Revenue Share (%), by Country 2024 & 2032
- Figure 12: MEA Business Process Automation Industry Revenue (Million), by Country 2024 & 2032
- Figure 13: MEA Business Process Automation Industry Revenue Share (%), by Country 2024 & 2032
- Figure 14: North America Business Process Automation Industry Revenue (Million), by Component 2024 & 2032
- Figure 15: North America Business Process Automation Industry Revenue Share (%), by Component 2024 & 2032
- Figure 16: North America Business Process Automation Industry Revenue (Million), by Deployment 2024 & 2032
- Figure 17: North America Business Process Automation Industry Revenue Share (%), by Deployment 2024 & 2032
- Figure 18: North America Business Process Automation Industry Revenue (Million), by Organization Size 2024 & 2032
- Figure 19: North America Business Process Automation Industry Revenue Share (%), by Organization Size 2024 & 2032
- Figure 20: North America Business Process Automation Industry Revenue (Million), by End User 2024 & 2032
- Figure 21: North America Business Process Automation Industry Revenue Share (%), by End User 2024 & 2032
- Figure 22: North America Business Process Automation Industry Revenue (Million), by Country 2024 & 2032
- Figure 23: North America Business Process Automation Industry Revenue Share (%), by Country 2024 & 2032
- Figure 24: Europe Business Process Automation Industry Revenue (Million), by Component 2024 & 2032
- Figure 25: Europe Business Process Automation Industry Revenue Share (%), by Component 2024 & 2032
- Figure 26: Europe Business Process Automation Industry Revenue (Million), by Deployment 2024 & 2032
- Figure 27: Europe Business Process Automation Industry Revenue Share (%), by Deployment 2024 & 2032
- Figure 28: Europe Business Process Automation Industry Revenue (Million), by Organization Size 2024 & 2032
- Figure 29: Europe Business Process Automation Industry Revenue Share (%), by Organization Size 2024 & 2032
- Figure 30: Europe Business Process Automation Industry Revenue (Million), by End User 2024 & 2032
- Figure 31: Europe Business Process Automation Industry Revenue Share (%), by End User 2024 & 2032
- Figure 32: Europe Business Process Automation Industry Revenue (Million), by Country 2024 & 2032
- Figure 33: Europe Business Process Automation Industry Revenue Share (%), by Country 2024 & 2032
- Figure 34: Asia Pacific Business Process Automation Industry Revenue (Million), by Component 2024 & 2032
- Figure 35: Asia Pacific Business Process Automation Industry Revenue Share (%), by Component 2024 & 2032
- Figure 36: Asia Pacific Business Process Automation Industry Revenue (Million), by Deployment 2024 & 2032
- Figure 37: Asia Pacific Business Process Automation Industry Revenue Share (%), by Deployment 2024 & 2032
- Figure 38: Asia Pacific Business Process Automation Industry Revenue (Million), by Organization Size 2024 & 2032
- Figure 39: Asia Pacific Business Process Automation Industry Revenue Share (%), by Organization Size 2024 & 2032
- Figure 40: Asia Pacific Business Process Automation Industry Revenue (Million), by End User 2024 & 2032
- Figure 41: Asia Pacific Business Process Automation Industry Revenue Share (%), by End User 2024 & 2032
- Figure 42: Asia Pacific Business Process Automation Industry Revenue (Million), by Country 2024 & 2032
- Figure 43: Asia Pacific Business Process Automation Industry Revenue Share (%), by Country 2024 & 2032
- Figure 44: Latin America Business Process Automation Industry Revenue (Million), by Component 2024 & 2032
- Figure 45: Latin America Business Process Automation Industry Revenue Share (%), by Component 2024 & 2032
- Figure 46: Latin America Business Process Automation Industry Revenue (Million), by Deployment 2024 & 2032
- Figure 47: Latin America Business Process Automation Industry Revenue Share (%), by Deployment 2024 & 2032
- Figure 48: Latin America Business Process Automation Industry Revenue (Million), by Organization Size 2024 & 2032
- Figure 49: Latin America Business Process Automation Industry Revenue Share (%), by Organization Size 2024 & 2032
- Figure 50: Latin America Business Process Automation Industry Revenue (Million), by End User 2024 & 2032
- Figure 51: Latin America Business Process Automation Industry Revenue Share (%), by End User 2024 & 2032
- Figure 52: Latin America Business Process Automation Industry Revenue (Million), by Country 2024 & 2032
- Figure 53: Latin America Business Process Automation Industry Revenue Share (%), by Country 2024 & 2032
- Figure 54: Middle East and Africa Business Process Automation Industry Revenue (Million), by Component 2024 & 2032
- Figure 55: Middle East and Africa Business Process Automation Industry Revenue Share (%), by Component 2024 & 2032
- Figure 56: Middle East and Africa Business Process Automation Industry Revenue (Million), by Deployment 2024 & 2032
- Figure 57: Middle East and Africa Business Process Automation Industry Revenue Share (%), by Deployment 2024 & 2032
- Figure 58: Middle East and Africa Business Process Automation Industry Revenue (Million), by Organization Size 2024 & 2032
- Figure 59: Middle East and Africa Business Process Automation Industry Revenue Share (%), by Organization Size 2024 & 2032
- Figure 60: Middle East and Africa Business Process Automation Industry Revenue (Million), by End User 2024 & 2032
- Figure 61: Middle East and Africa Business Process Automation Industry Revenue Share (%), by End User 2024 & 2032
- Figure 62: Middle East and Africa Business Process Automation Industry Revenue (Million), by Country 2024 & 2032
- Figure 63: Middle East and Africa Business Process Automation Industry Revenue Share (%), by Country 2024 & 2032
List of Tables
- Table 1: Global Business Process Automation Industry Revenue Million Forecast, by Region 2019 & 2032
- Table 2: Global Business Process Automation Industry Revenue Million Forecast, by Component 2019 & 2032
- Table 3: Global Business Process Automation Industry Revenue Million Forecast, by Deployment 2019 & 2032
- Table 4: Global Business Process Automation Industry Revenue Million Forecast, by Organization Size 2019 & 2032
- Table 5: Global Business Process Automation Industry Revenue Million Forecast, by End User 2019 & 2032
- Table 6: Global Business Process Automation Industry Revenue Million Forecast, by Region 2019 & 2032
- Table 7: Global Business Process Automation Industry Revenue Million Forecast, by Country 2019 & 2032
- Table 8: United States Business Process Automation Industry Revenue (Million) Forecast, by Application 2019 & 2032
- Table 9: Canada Business Process Automation Industry Revenue (Million) Forecast, by Application 2019 & 2032
- Table 10: Mexico Business Process Automation Industry Revenue (Million) Forecast, by Application 2019 & 2032
- Table 11: Global Business Process Automation Industry Revenue Million Forecast, by Country 2019 & 2032
- Table 12: Germany Business Process Automation Industry Revenue (Million) Forecast, by Application 2019 & 2032
- Table 13: United Kingdom Business Process Automation Industry Revenue (Million) Forecast, by Application 2019 & 2032
- Table 14: France Business Process Automation Industry Revenue (Million) Forecast, by Application 2019 & 2032
- Table 15: Spain Business Process Automation Industry Revenue (Million) Forecast, by Application 2019 & 2032
- Table 16: Italy Business Process Automation Industry Revenue (Million) Forecast, by Application 2019 & 2032
- Table 17: Spain Business Process Automation Industry Revenue (Million) Forecast, by Application 2019 & 2032
- Table 18: Belgium Business Process Automation Industry Revenue (Million) Forecast, by Application 2019 & 2032
- Table 19: Netherland Business Process Automation Industry Revenue (Million) Forecast, by Application 2019 & 2032
- Table 20: Nordics Business Process Automation Industry Revenue (Million) Forecast, by Application 2019 & 2032
- Table 21: Rest of Europe Business Process Automation Industry Revenue (Million) Forecast, by Application 2019 & 2032
- Table 22: Global Business Process Automation Industry Revenue Million Forecast, by Country 2019 & 2032
- Table 23: China Business Process Automation Industry Revenue (Million) Forecast, by Application 2019 & 2032
- Table 24: Japan Business Process Automation Industry Revenue (Million) Forecast, by Application 2019 & 2032
- Table 25: India Business Process Automation Industry Revenue (Million) Forecast, by Application 2019 & 2032
- Table 26: South Korea Business Process Automation Industry Revenue (Million) Forecast, by Application 2019 & 2032
- Table 27: Southeast Asia Business Process Automation Industry Revenue (Million) Forecast, by Application 2019 & 2032
- Table 28: Australia Business Process Automation Industry Revenue (Million) Forecast, by Application 2019 & 2032
- Table 29: Indonesia Business Process Automation Industry Revenue (Million) Forecast, by Application 2019 & 2032
- Table 30: Phillipes Business Process Automation Industry Revenue (Million) Forecast, by Application 2019 & 2032
- Table 31: Singapore Business Process Automation Industry Revenue (Million) Forecast, by Application 2019 & 2032
- Table 32: Thailandc Business Process Automation Industry Revenue (Million) Forecast, by Application 2019 & 2032
- Table 33: Rest of Asia Pacific Business Process Automation Industry Revenue (Million) Forecast, by Application 2019 & 2032
- Table 34: Global Business Process Automation Industry Revenue Million Forecast, by Country 2019 & 2032
- Table 35: Brazil Business Process Automation Industry Revenue (Million) Forecast, by Application 2019 & 2032
- Table 36: Argentina Business Process Automation Industry Revenue (Million) Forecast, by Application 2019 & 2032
- Table 37: Peru Business Process Automation Industry Revenue (Million) Forecast, by Application 2019 & 2032
- Table 38: Chile Business Process Automation Industry Revenue (Million) Forecast, by Application 2019 & 2032
- Table 39: Colombia Business Process Automation Industry Revenue (Million) Forecast, by Application 2019 & 2032
- Table 40: Ecuador Business Process Automation Industry Revenue (Million) Forecast, by Application 2019 & 2032
- Table 41: Venezuela Business Process Automation Industry Revenue (Million) Forecast, by Application 2019 & 2032
- Table 42: Rest of South America Business Process Automation Industry Revenue (Million) Forecast, by Application 2019 & 2032
- Table 43: Global Business Process Automation Industry Revenue Million Forecast, by Country 2019 & 2032
- Table 44: United States Business Process Automation Industry Revenue (Million) Forecast, by Application 2019 & 2032
- Table 45: Canada Business Process Automation Industry Revenue (Million) Forecast, by Application 2019 & 2032
- Table 46: Mexico Business Process Automation Industry Revenue (Million) Forecast, by Application 2019 & 2032
- Table 47: Global Business Process Automation Industry Revenue Million Forecast, by Country 2019 & 2032
- Table 48: United Arab Emirates Business Process Automation Industry Revenue (Million) Forecast, by Application 2019 & 2032
- Table 49: Saudi Arabia Business Process Automation Industry Revenue (Million) Forecast, by Application 2019 & 2032
- Table 50: South Africa Business Process Automation Industry Revenue (Million) Forecast, by Application 2019 & 2032
- Table 51: Rest of Middle East and Africa Business Process Automation Industry Revenue (Million) Forecast, by Application 2019 & 2032
- Table 52: Global Business Process Automation Industry Revenue Million Forecast, by Component 2019 & 2032
- Table 53: Global Business Process Automation Industry Revenue Million Forecast, by Deployment 2019 & 2032
- Table 54: Global Business Process Automation Industry Revenue Million Forecast, by Organization Size 2019 & 2032
- Table 55: Global Business Process Automation Industry Revenue Million Forecast, by End User 2019 & 2032
- Table 56: Global Business Process Automation Industry Revenue Million Forecast, by Country 2019 & 2032
- Table 57: Global Business Process Automation Industry Revenue Million Forecast, by Component 2019 & 2032
- Table 58: Global Business Process Automation Industry Revenue Million Forecast, by Deployment 2019 & 2032
- Table 59: Global Business Process Automation Industry Revenue Million Forecast, by Organization Size 2019 & 2032
- Table 60: Global Business Process Automation Industry Revenue Million Forecast, by End User 2019 & 2032
- Table 61: Global Business Process Automation Industry Revenue Million Forecast, by Country 2019 & 2032
- Table 62: Global Business Process Automation Industry Revenue Million Forecast, by Component 2019 & 2032
- Table 63: Global Business Process Automation Industry Revenue Million Forecast, by Deployment 2019 & 2032
- Table 64: Global Business Process Automation Industry Revenue Million Forecast, by Organization Size 2019 & 2032
- Table 65: Global Business Process Automation Industry Revenue Million Forecast, by End User 2019 & 2032
- Table 66: Global Business Process Automation Industry Revenue Million Forecast, by Country 2019 & 2032
- Table 67: Global Business Process Automation Industry Revenue Million Forecast, by Component 2019 & 2032
- Table 68: Global Business Process Automation Industry Revenue Million Forecast, by Deployment 2019 & 2032
- Table 69: Global Business Process Automation Industry Revenue Million Forecast, by Organization Size 2019 & 2032
- Table 70: Global Business Process Automation Industry Revenue Million Forecast, by End User 2019 & 2032
- Table 71: Global Business Process Automation Industry Revenue Million Forecast, by Country 2019 & 2032
- Table 72: Global Business Process Automation Industry Revenue Million Forecast, by Component 2019 & 2032
- Table 73: Global Business Process Automation Industry Revenue Million Forecast, by Deployment 2019 & 2032
- Table 74: Global Business Process Automation Industry Revenue Million Forecast, by Organization Size 2019 & 2032
- Table 75: Global Business Process Automation Industry Revenue Million Forecast, by End User 2019 & 2032
- Table 76: Global Business Process Automation Industry Revenue Million Forecast, by Country 2019 & 2032
Frequently Asked Questions
1. What is the projected Compound Annual Growth Rate (CAGR) of the Business Process Automation Industry?
The projected CAGR is approximately 11.60%.
2. Which companies are prominent players in the Business Process Automation Industry?
Key companies in the market include Appian Corporation, OpenText Corporation, IBM Corporation, Software AG, DST Systems Inc, TIBCO Software Inc *List Not Exhaustive, Pegasystems Inc, Oracle Corporation, Bizagi Group Limited, Newgen Software Technologies Ltd.
3. What are the main segments of the Business Process Automation Industry?
The market segments include Component, Deployment, Organization Size, End User.
4. Can you provide details about the market size?
The market size is estimated to be USD 13.80 Million as of 2022.
5. What are some drivers contributing to market growth?
Increase Demand of Automating Business Process for Efficient Back-end process; Increase Adoption of Low Code Automation for Greater Accessibility.
6. What are the notable trends driving market growth?
Small Enterprises are expected to grow at a higher pace on back of growing adoption of Business Process Management (BPM).
7. Are there any restraints impacting market growth?
Lack of Skilled Workforce.
8. Can you provide examples of recent developments in the market?
July 2022 - Oracle Fusion Sales, a sales automation tool that locates high-quality sales opportunities and helps sellers close deals more quickly, has just received an update, according to Oracle. Fusion Sales is an artificial intelligence (AI)-driven component of Oracle Fusion Cloud Customer Experience (CX) that automatically offers sellers prices, recommendations, and suggested next steps in order to help them close more deals, work more productively, and inspire trust in their customers.
9. What pricing options are available for accessing the report?
Pricing options include single-user, multi-user, and enterprise licenses priced at USD 4750, USD 5250, and USD 8750 respectively.
10. Is the market size provided in terms of value or volume?
The market size is provided in terms of value, measured in Million.
11. Are there any specific market keywords associated with the report?
Yes, the market keyword associated with the report is "Business Process Automation Industry," which aids in identifying and referencing the specific market segment covered.
12. How do I determine which pricing option suits my needs best?
The pricing options vary based on user requirements and access needs. Individual users may opt for single-user licenses, while businesses requiring broader access may choose multi-user or enterprise licenses for cost-effective access to the report.
13. Are there any additional resources or data provided in the Business Process Automation Industry report?
While the report offers comprehensive insights, it's advisable to review the specific contents or supplementary materials provided to ascertain if additional resources or data are available.
14. How can I stay updated on further developments or reports in the Business Process Automation Industry?
To stay informed about further developments, trends, and reports in the Business Process Automation Industry, consider subscribing to industry newsletters, following relevant companies and organizations, or regularly checking reputable industry news sources and publications.
Methodology
Step 1 - Identification of Relevant Samples Size from Population Database


Step 2 - Approaches for Defining Global Market Size (Value, Volume* & Price*)

Note*: In applicable scenarios
Step 3 - Data Sources
Primary Research
- Web Analytics
- Survey Reports
- Research Institute
- Latest Research Reports
- Opinion Leaders
Secondary Research
- Annual Reports
- White Paper
- Latest Press Release
- Industry Association
- Paid Database
- Investor Presentations

Step 4 - Data Triangulation
Involves using different sources of information in order to increase the validity of a study
These sources are likely to be stakeholders in a program - participants, other researchers, program staff, other community members, and so on.
Then we put all data in single framework & apply various statistical tools to find out the dynamic on the market.
During the analysis stage, feedback from the stakeholder groups would be compared to determine areas of agreement as well as areas of divergence
