

Key Insights
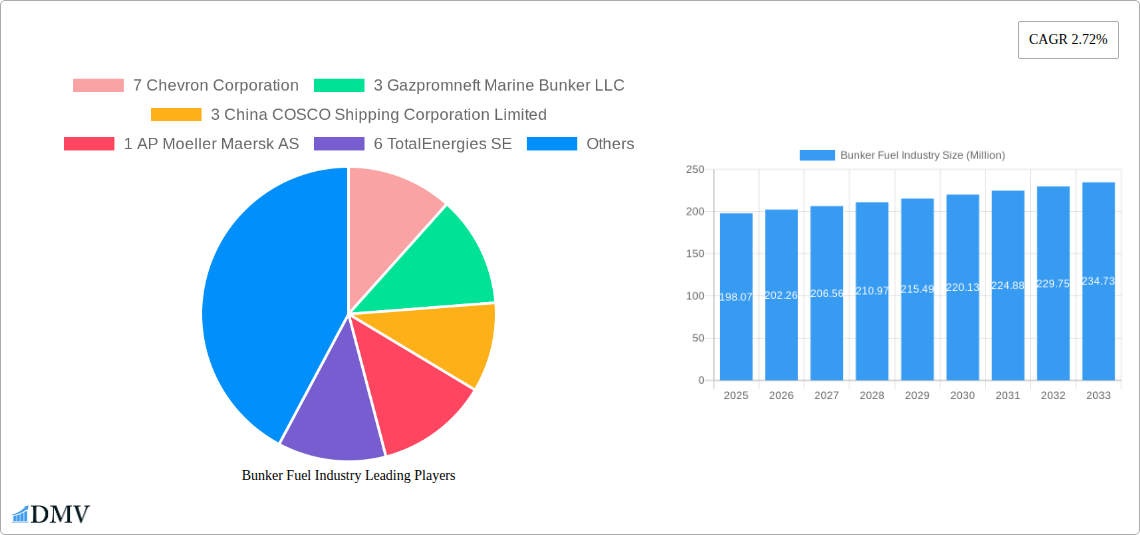
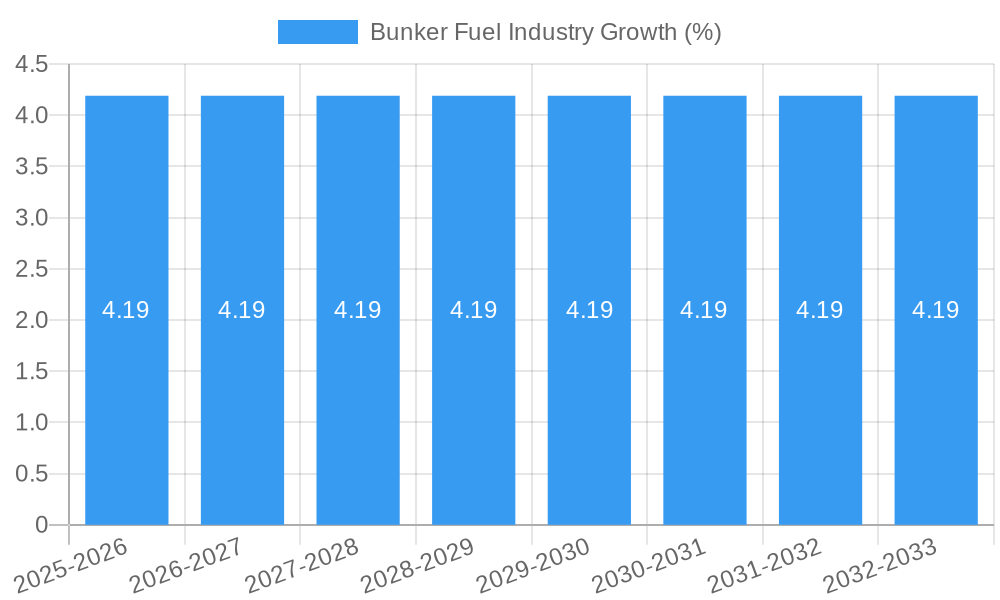
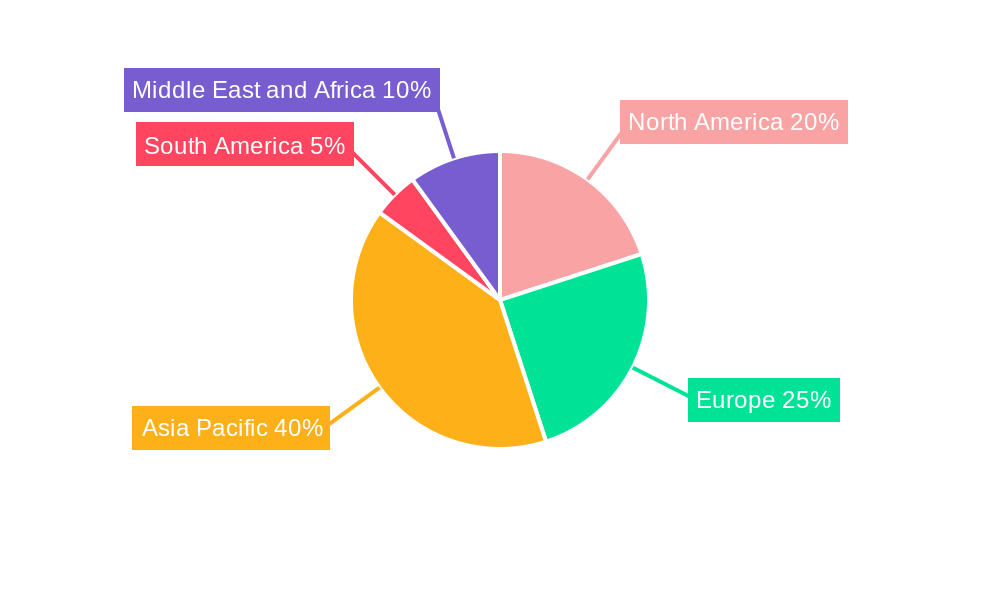
The global bunker fuel market, valued at $198.07 million in 2025, is projected to experience steady growth with a Compound Annual Growth Rate (CAGR) of 2.72% from 2025 to 2033. This growth is fueled by increasing global maritime trade, particularly within the container and tanker segments, demanding substantial fuel supplies. The shift towards stricter environmental regulations, such as the International Maritime Organization's (IMO) sulfur cap, is driving a transition from High Sulfur Fuel Oil (HSFO) to cleaner alternatives like Very Low Sulfur Fuel Oil (VLSFO) and Liquefied Natural Gas (LNG). This transition presents both opportunities and challenges for fuel suppliers and ship owners, necessitating significant investments in infrastructure and technology. While the adoption of LNG faces hurdles related to limited bunkering infrastructure and higher initial costs, its long-term prospects remain strong due to its environmental benefits. Competition among major players like Chevron, TotalEnergies, Shell, and several large shipping companies intensifies, driving innovation and price optimization within the market. Geographic growth is expected to be driven by Asia-Pacific, particularly China and India, reflecting the expansion of their maritime trade activities.
Market restraints include fluctuating oil prices, geopolitical instability impacting fuel supply chains, and the ongoing investment required to support the transition to cleaner fuels. Despite these challenges, the consistent demand from a growing global fleet and the pressure to comply with environmental standards will ensure the sustained growth of this market. Regional variations are expected, with North America and Europe maintaining a strong presence, while Asia-Pacific is poised for considerable expansion driven by its expanding shipping and trade activities. The market segmentation based on vessel type reflects the diverse needs of different shipping sectors, impacting the type and quantity of bunker fuel consumed. The increasing demand for efficient and environmentally friendly fuel solutions will shape the market's future, rewarding companies that proactively adapt to changing regulations and market dynamics.
Bunker Fuel Industry Market Report: 2019-2033
This comprehensive report provides an in-depth analysis of the global bunker fuel industry, offering invaluable insights for stakeholders seeking to navigate this dynamic market. Covering the period from 2019 to 2033, with a focus on 2025, this report analyzes market trends, competitive landscapes, technological advancements, and future growth opportunities. The report leverages extensive data analysis to deliver actionable intelligence, empowering strategic decision-making across the entire bunker fuel value chain. The total market size in 2025 is estimated at xx Million.
Bunker Fuel Industry Market Composition & Trends
This section evaluates the market concentration, analyzing the market share distribution amongst key players and identifying innovation catalysts shaping the industry. We explore the evolving regulatory landscape, the impact of substitute products, and the characteristics of key end-user profiles (e.g., Ship Owners, Fuel Suppliers). The report also examines M&A activity, including deal values, providing insights into strategic shifts and industry consolidation. The report further analyzes the competitive intensity, with emphasis on the concentration ratio. A detailed analysis of the market structure unveils the leading players and their respective market dominance.
- Market Share Distribution: The market is characterized by a moderately concentrated structure, with key players such as Chevron Corporation (7%), Gazpromneft Marine Bunker LLC (3%), and TotalEnergies SE (6%) holding significant shares. However, a large number of smaller players contribute significantly to the overall market volume.
- M&A Activity: Over the historical period (2019-2024), xx Million worth of M&A deals have been observed, largely driven by consolidation efforts and expansion into new fuel types and geographical regions. The estimated value of M&A deals for 2025 is xx Million, suggesting continued consolidation.
- Regulatory Landscape: Stringent environmental regulations, particularly concerning sulfur content in marine fuels, are a major driver of market shifts and investment in cleaner technologies.
- Substitute Products: The emergence of LNG and other alternative fuels is impacting the demand for traditional HSFO.
Bunker Fuel Industry Industry Evolution
This section delves into the historical and projected growth trajectories of the bunker fuel market. We examine the technological advancements driving efficiency gains and the evolving demands from consumers, particularly focusing on the shift towards cleaner and more sustainable fuel options. The analysis encompasses a detailed examination of the driving forces behind industry growth, such as the increase in global trade volume and the tightening environmental regulations. The shift towards larger vessels and the evolving preferences for fuel types are also considered. The projected Compound Annual Growth Rate (CAGR) for the forecast period (2025-2033) is estimated at xx%.
Leading Regions, Countries, or Segments in Bunker Fuel Industry
This section identifies the leading regions, countries, and segments within the bunker fuel market. We analyze the dominance of specific fuel types (HSFO, VLSFO, MGO, LNG, Other) and vessel types (Containers, Tankers, General Cargo, Bulk Carriers, Other). We examine investment trends, regulatory support, and other key factors driving the leadership positions.
- Fuel Type: VLSFO is anticipated to hold the largest market share in 2025, driven by stricter environmental regulations. LNG is expected to witness the fastest growth rate due to its environmental benefits and increasing availability of bunkering infrastructure.
- Vessel Type: Container ships dominate the bunker fuel consumption, reflecting the growth in global containerized trade. Tankers represent a significant segment due to their large fuel requirements.
- Key Drivers: Growth in global trade, rising environmental concerns, and government incentives for cleaner fuels are among the prominent drivers.
Bunker Fuel Industry Product Innovations
Recent product innovations include advancements in fuel formulations to meet stricter emission standards, the development of new bunkering technologies to facilitate efficient LNG refueling, and the exploration of biofuels and other alternative fuel sources. These innovations aim to improve efficiency, reduce emissions, and provide more sustainable options for the shipping industry. The focus is shifting towards cleaner, more efficient fuels, with an emphasis on reducing sulfur content and overall emissions.
Propelling Factors for Bunker Fuel Industry Growth
Several factors contribute to the growth of the bunker fuel industry. Increased global trade, particularly in container shipping, drives demand for bunker fuels. Technological advancements in ship design and fuel efficiency play a vital role, while supportive government policies and regulations concerning emission reduction further stimulate market expansion. The growing adoption of LNG as an alternative fuel signifies a significant positive influence on market growth.
Obstacles in the Bunker Fuel Industry Market
The bunker fuel industry faces challenges including volatile crude oil prices, stringent environmental regulations imposing substantial compliance costs, and potential supply chain disruptions impacting fuel availability. Furthermore, intense competition among fuel suppliers and the risk of overcapacity in certain market segments present significant hurdles. The increased costs associated with meeting stringent environmental regulations impact profitability.
Future Opportunities in Bunker Fuel Industry
Future opportunities include increased demand for LNG and other alternative fuels, the development and commercialization of biofuels and hydrogen-based fuels, and the growth of sophisticated bunkering infrastructure in major ports globally. These areas represent growth avenues for both fuel suppliers and technology providers. Advancements in digitalization and data analytics also open opportunities to optimize fuel consumption and efficiency.
Major Players in the Bunker Fuel Industry Ecosystem
- Chevron Corporation
- Gazpromneft Marine Bunker LLC
- China COSCO Shipping Corporation Limited
- AP Moeller Maersk AS
- TotalEnergies SE
- Shell PLC
- Evergreen Marine Corp Taiwan Ltd
- Mediterranean Shipping Company SA
- Ship Owners
- Clipper Oil
- Yang Ming Marine Transport Corporation
- Fuel Suppliers
- Ocean Network Express
- Gulf Agency Company Ltd
- Pacific International Lines Pte Ltd
- HMM Co Ltd
- CMA CGM Group
- ExxonMobil Corporation
- Bomin Bunker Holding GmbH & Co KG
- PJSC Lukoil Oil Company
- Hapag-Lloyd AG
- BP PLC
Key Developments in Bunker Fuel Industry Industry
- January 2022: Titan LNG secures LNG delivery tender in the Port of Marseille, expanding its Mediterranean operations and boosting LNG availability.
- November 2022: Nimofast Brasil S.A. partners with KanferShipping AS to provide small-scale LNG shipping and bunkering solutions in Brazil.
Strategic Bunker Fuel Industry Market Forecast
The bunker fuel market is poised for continued growth, driven by the increasing global trade volume and the adoption of cleaner fuels. While challenges persist, the transition towards environmentally friendly options presents significant opportunities. Strategic investments in LNG infrastructure and the development of alternative fuels are anticipated to shape the market's trajectory in the coming years. This growth is expected to be sustained by a consistent rise in global maritime trade, coupled with increasing regulatory pressure for cleaner fuel usage.
Bunker Fuel Industry Segmentation
-
1. Fuel Type
- 1.1. High Sulfur Fuel Oil (HSFO)
- 1.2. Very Low Sulfur Fuel Oil (VLSFO)
- 1.3. Marine Gas Oil (MGO)
- 1.4. Liquefied Natural Gas (LNG)
- 1.5. Other Fuel Types
-
2. Vessel Type
- 2.1. Containers
- 2.2. Tankers
- 2.3. General Cargo
- 2.4. Bulk Carriers
- 2.5. Other Vessel Types
Bunker Fuel Industry Segmentation By Geography
-
1. North America
- 1.1. United States
- 1.2. Canada
- 1.3. Rest of North America
-
2. Europe
- 2.1. Germany
- 2.2. France
- 2.3. United Kingdom
- 2.4. Spain
- 2.5. NORDIC
- 2.6. Turkey
- 2.7. Russia
- 2.8. Rest of Europe
-
3. Asia Pacific
- 3.1. China
- 3.2. India
- 3.3. Japan
- 3.4. South Korea
- 3.5. Malaysia
- 3.6. Thailand
- 3.7. Indonesia
- 3.8. Vietnam
- 3.9. Rest of Asia Pacific
-
4. South America
- 4.1. Brazil
- 4.2. Argentina
- 4.3. Colombia
- 4.4. Rest of South America
-
5. Middle East and Africa
- 5.1. Saudi Arabia
- 5.2. United Arab Emirates
- 5.3. South Africa
- 5.4. Nigeria
- 5.5. Qatar
- 5.6. Egypt
- 5.7. Rest of Middle East and Africa
Bunker Fuel Industry REPORT HIGHLIGHTS
| Aspects | Details |
|---|---|
| Study Period | 2019-2033 |
| Base Year | 2024 |
| Estimated Year | 2025 |
| Forecast Period | 2025-2033 |
| Historical Period | 2019-2024 |
| Growth Rate | CAGR of 2.72% from 2019-2033 |
| Segmentation |
|
Table of Contents
- 1. Introduction
- 1.1. Research Scope
- 1.2. Market Segmentation
- 1.3. Research Methodology
- 1.4. Definitions and Assumptions
- 2. Executive Summary
- 2.1. Introduction
- 3. Market Dynamics
- 3.1. Introduction
- 3.2. Market Drivers
- 3.2.1. 4.; Increased LNG Trade Worldwide4.; Increasing Dependecies over Natural Gas for Power Generation
- 3.3. Market Restrains
- 3.3.1. 4.; Environmental Concerns and the Strict Regulations Related to Emissions from Maritime Industry
- 3.4. Market Trends
- 3.4.1. LNG as a Bunker Fuel is Likely to Witness Significant Growth
- 4. Market Factor Analysis
- 4.1. Porters Five Forces
- 4.2. Supply/Value Chain
- 4.3. PESTEL analysis
- 4.4. Market Entropy
- 4.5. Patent/Trademark Analysis
- 5. Global Bunker Fuel Industry Analysis, Insights and Forecast, 2019-2031
- 5.1. Market Analysis, Insights and Forecast - by Fuel Type
- 5.1.1. High Sulfur Fuel Oil (HSFO)
- 5.1.2. Very Low Sulfur Fuel Oil (VLSFO)
- 5.1.3. Marine Gas Oil (MGO)
- 5.1.4. Liquefied Natural Gas (LNG)
- 5.1.5. Other Fuel Types
- 5.2. Market Analysis, Insights and Forecast - by Vessel Type
- 5.2.1. Containers
- 5.2.2. Tankers
- 5.2.3. General Cargo
- 5.2.4. Bulk Carriers
- 5.2.5. Other Vessel Types
- 5.3. Market Analysis, Insights and Forecast - by Region
- 5.3.1. North America
- 5.3.2. Europe
- 5.3.3. Asia Pacific
- 5.3.4. South America
- 5.3.5. Middle East and Africa
- 5.1. Market Analysis, Insights and Forecast - by Fuel Type
- 6. North America Bunker Fuel Industry Analysis, Insights and Forecast, 2019-2031
- 6.1. Market Analysis, Insights and Forecast - by Fuel Type
- 6.1.1. High Sulfur Fuel Oil (HSFO)
- 6.1.2. Very Low Sulfur Fuel Oil (VLSFO)
- 6.1.3. Marine Gas Oil (MGO)
- 6.1.4. Liquefied Natural Gas (LNG)
- 6.1.5. Other Fuel Types
- 6.2. Market Analysis, Insights and Forecast - by Vessel Type
- 6.2.1. Containers
- 6.2.2. Tankers
- 6.2.3. General Cargo
- 6.2.4. Bulk Carriers
- 6.2.5. Other Vessel Types
- 6.1. Market Analysis, Insights and Forecast - by Fuel Type
- 7. Europe Bunker Fuel Industry Analysis, Insights and Forecast, 2019-2031
- 7.1. Market Analysis, Insights and Forecast - by Fuel Type
- 7.1.1. High Sulfur Fuel Oil (HSFO)
- 7.1.2. Very Low Sulfur Fuel Oil (VLSFO)
- 7.1.3. Marine Gas Oil (MGO)
- 7.1.4. Liquefied Natural Gas (LNG)
- 7.1.5. Other Fuel Types
- 7.2. Market Analysis, Insights and Forecast - by Vessel Type
- 7.2.1. Containers
- 7.2.2. Tankers
- 7.2.3. General Cargo
- 7.2.4. Bulk Carriers
- 7.2.5. Other Vessel Types
- 7.1. Market Analysis, Insights and Forecast - by Fuel Type
- 8. Asia Pacific Bunker Fuel Industry Analysis, Insights and Forecast, 2019-2031
- 8.1. Market Analysis, Insights and Forecast - by Fuel Type
- 8.1.1. High Sulfur Fuel Oil (HSFO)
- 8.1.2. Very Low Sulfur Fuel Oil (VLSFO)
- 8.1.3. Marine Gas Oil (MGO)
- 8.1.4. Liquefied Natural Gas (LNG)
- 8.1.5. Other Fuel Types
- 8.2. Market Analysis, Insights and Forecast - by Vessel Type
- 8.2.1. Containers
- 8.2.2. Tankers
- 8.2.3. General Cargo
- 8.2.4. Bulk Carriers
- 8.2.5. Other Vessel Types
- 8.1. Market Analysis, Insights and Forecast - by Fuel Type
- 9. South America Bunker Fuel Industry Analysis, Insights and Forecast, 2019-2031
- 9.1. Market Analysis, Insights and Forecast - by Fuel Type
- 9.1.1. High Sulfur Fuel Oil (HSFO)
- 9.1.2. Very Low Sulfur Fuel Oil (VLSFO)
- 9.1.3. Marine Gas Oil (MGO)
- 9.1.4. Liquefied Natural Gas (LNG)
- 9.1.5. Other Fuel Types
- 9.2. Market Analysis, Insights and Forecast - by Vessel Type
- 9.2.1. Containers
- 9.2.2. Tankers
- 9.2.3. General Cargo
- 9.2.4. Bulk Carriers
- 9.2.5. Other Vessel Types
- 9.1. Market Analysis, Insights and Forecast - by Fuel Type
- 10. Middle East and Africa Bunker Fuel Industry Analysis, Insights and Forecast, 2019-2031
- 10.1. Market Analysis, Insights and Forecast - by Fuel Type
- 10.1.1. High Sulfur Fuel Oil (HSFO)
- 10.1.2. Very Low Sulfur Fuel Oil (VLSFO)
- 10.1.3. Marine Gas Oil (MGO)
- 10.1.4. Liquefied Natural Gas (LNG)
- 10.1.5. Other Fuel Types
- 10.2. Market Analysis, Insights and Forecast - by Vessel Type
- 10.2.1. Containers
- 10.2.2. Tankers
- 10.2.3. General Cargo
- 10.2.4. Bulk Carriers
- 10.2.5. Other Vessel Types
- 10.1. Market Analysis, Insights and Forecast - by Fuel Type
- 11. North America Bunker Fuel Industry Analysis, Insights and Forecast, 2019-2031
- 11.1. Market Analysis, Insights and Forecast - By Country/Sub-region
- 11.1.1 United States
- 11.1.2 Canada
- 11.1.3 Rest of North America
- 12. Europe Bunker Fuel Industry Analysis, Insights and Forecast, 2019-2031
- 12.1. Market Analysis, Insights and Forecast - By Country/Sub-region
- 12.1.1 Germany
- 12.1.2 France
- 12.1.3 United Kingdom
- 12.1.4 Rest of Europe
- 13. Asia Pacific Bunker Fuel Industry Analysis, Insights and Forecast, 2019-2031
- 13.1. Market Analysis, Insights and Forecast - By Country/Sub-region
- 13.1.1 China
- 13.1.2 India
- 13.1.3 Japan
- 13.1.4 South Korea
- 13.1.5 Rest of Asia Pacific
- 14. South America Bunker Fuel Industry Analysis, Insights and Forecast, 2019-2031
- 14.1. Market Analysis, Insights and Forecast - By Country/Sub-region
- 14.1.1 Brazil
- 14.1.2 Argentina
- 14.1.3 Rest of South America
- 15. Middle East and Africa Bunker Fuel Industry Analysis, Insights and Forecast, 2019-2031
- 15.1. Market Analysis, Insights and Forecast - By Country/Sub-region
- 15.1.1 Saudi Arabia
- 15.1.2 United Arab Emirates
- 15.1.3 South Africa
- 15.1.4 Rest of Middle East and Africa
- 16. Competitive Analysis
- 16.1. Global Market Share Analysis 2024
- 16.2. Company Profiles
- 16.2.1 7 Chevron Corporation
- 16.2.1.1. Overview
- 16.2.1.2. Products
- 16.2.1.3. SWOT Analysis
- 16.2.1.4. Recent Developments
- 16.2.1.5. Financials (Based on Availability)
- 16.2.2 3 Gazpromneft Marine Bunker LLC
- 16.2.2.1. Overview
- 16.2.2.2. Products
- 16.2.2.3. SWOT Analysis
- 16.2.2.4. Recent Developments
- 16.2.2.5. Financials (Based on Availability)
- 16.2.3 3 China COSCO Shipping Corporation Limited
- 16.2.3.1. Overview
- 16.2.3.2. Products
- 16.2.3.3. SWOT Analysis
- 16.2.3.4. Recent Developments
- 16.2.3.5. Financials (Based on Availability)
- 16.2.4 1 AP Moeller Maersk AS
- 16.2.4.1. Overview
- 16.2.4.2. Products
- 16.2.4.3. SWOT Analysis
- 16.2.4.4. Recent Developments
- 16.2.4.5. Financials (Based on Availability)
- 16.2.5 6 TotalEnergies SE
- 16.2.5.1. Overview
- 16.2.5.2. Products
- 16.2.5.3. SWOT Analysis
- 16.2.5.4. Recent Developments
- 16.2.5.5. Financials (Based on Availability)
- 16.2.6 2 Shell PLC
- 16.2.6.1. Overview
- 16.2.6.2. Products
- 16.2.6.3. SWOT Analysis
- 16.2.6.4. Recent Developments
- 16.2.6.5. Financials (Based on Availability)
- 16.2.7 7 Evergreen Marine Corp Taiwan Ltd
- 16.2.7.1. Overview
- 16.2.7.2. Products
- 16.2.7.3. SWOT Analysis
- 16.2.7.4. Recent Developments
- 16.2.7.5. Financials (Based on Availability)
- 16.2.8 2 Mediterranean Shipping Company SA
- 16.2.8.1. Overview
- 16.2.8.2. Products
- 16.2.8.3. SWOT Analysis
- 16.2.8.4. Recent Developments
- 16.2.8.5. Financials (Based on Availability)
- 16.2.9 Ship Owners
- 16.2.9.1. Overview
- 16.2.9.2. Products
- 16.2.9.3. SWOT Analysis
- 16.2.9.4. Recent Developments
- 16.2.9.5. Financials (Based on Availability)
- 16.2.10 8 Clipper Oil
- 16.2.10.1. Overview
- 16.2.10.2. Products
- 16.2.10.3. SWOT Analysis
- 16.2.10.4. Recent Developments
- 16.2.10.5. Financials (Based on Availability)
- 16.2.11 8 Yang Ming Marine Transport Corporation
- 16.2.11.1. Overview
- 16.2.11.2. Products
- 16.2.11.3. SWOT Analysis
- 16.2.11.4. Recent Developments
- 16.2.11.5. Financials (Based on Availability)
- 16.2.12 Fuel Suppliers
- 16.2.12.1. Overview
- 16.2.12.2. Products
- 16.2.12.3. SWOT Analysis
- 16.2.12.4. Recent Developments
- 16.2.12.5. Financials (Based on Availability)
- 16.2.13 6 Ocean Network Express
- 16.2.13.1. Overview
- 16.2.13.2. Products
- 16.2.13.3. SWOT Analysis
- 16.2.13.4. Recent Developments
- 16.2.13.5. Financials (Based on Availability)
- 16.2.14 9 Gulf Agency Company Ltd
- 16.2.14.1. Overview
- 16.2.14.2. Products
- 16.2.14.3. SWOT Analysis
- 16.2.14.4. Recent Developments
- 16.2.14.5. Financials (Based on Availability)
- 16.2.15 10 Pacific International Lines Pte Ltd*List Not Exhaustive
- 16.2.15.1. Overview
- 16.2.15.2. Products
- 16.2.15.3. SWOT Analysis
- 16.2.15.4. Recent Developments
- 16.2.15.5. Financials (Based on Availability)
- 16.2.16 9 HMM Co Ltd
- 16.2.16.1. Overview
- 16.2.16.2. Products
- 16.2.16.3. SWOT Analysis
- 16.2.16.4. Recent Developments
- 16.2.16.5. Financials (Based on Availability)
- 16.2.17 4 CMA CGM Group
- 16.2.17.1. Overview
- 16.2.17.2. Products
- 16.2.17.3. SWOT Analysis
- 16.2.17.4. Recent Developments
- 16.2.17.5. Financials (Based on Availability)
- 16.2.18 1 ExxonMobil Corporation
- 16.2.18.1. Overview
- 16.2.18.2. Products
- 16.2.18.3. SWOT Analysis
- 16.2.18.4. Recent Developments
- 16.2.18.5. Financials (Based on Availability)
- 16.2.19 10 Bomin Bunker Holding GmbH & Co KG
- 16.2.19.1. Overview
- 16.2.19.2. Products
- 16.2.19.3. SWOT Analysis
- 16.2.19.4. Recent Developments
- 16.2.19.5. Financials (Based on Availability)
- 16.2.20 5 PJSC Lukoil Oil Company
- 16.2.20.1. Overview
- 16.2.20.2. Products
- 16.2.20.3. SWOT Analysis
- 16.2.20.4. Recent Developments
- 16.2.20.5. Financials (Based on Availability)
- 16.2.21 5 Hapag-Lloyd AG
- 16.2.21.1. Overview
- 16.2.21.2. Products
- 16.2.21.3. SWOT Analysis
- 16.2.21.4. Recent Developments
- 16.2.21.5. Financials (Based on Availability)
- 16.2.22 4 BP PLC
- 16.2.22.1. Overview
- 16.2.22.2. Products
- 16.2.22.3. SWOT Analysis
- 16.2.22.4. Recent Developments
- 16.2.22.5. Financials (Based on Availability)
- 16.2.1 7 Chevron Corporation
List of Figures
- Figure 1: Global Bunker Fuel Industry Revenue Breakdown (Million, %) by Region 2024 & 2032
- Figure 2: Global Bunker Fuel Industry Volume Breakdown (metric tonnes, %) by Region 2024 & 2032
- Figure 3: North America Bunker Fuel Industry Revenue (Million), by Country 2024 & 2032
- Figure 4: North America Bunker Fuel Industry Volume (metric tonnes), by Country 2024 & 2032
- Figure 5: North America Bunker Fuel Industry Revenue Share (%), by Country 2024 & 2032
- Figure 6: North America Bunker Fuel Industry Volume Share (%), by Country 2024 & 2032
- Figure 7: Europe Bunker Fuel Industry Revenue (Million), by Country 2024 & 2032
- Figure 8: Europe Bunker Fuel Industry Volume (metric tonnes), by Country 2024 & 2032
- Figure 9: Europe Bunker Fuel Industry Revenue Share (%), by Country 2024 & 2032
- Figure 10: Europe Bunker Fuel Industry Volume Share (%), by Country 2024 & 2032
- Figure 11: Asia Pacific Bunker Fuel Industry Revenue (Million), by Country 2024 & 2032
- Figure 12: Asia Pacific Bunker Fuel Industry Volume (metric tonnes), by Country 2024 & 2032
- Figure 13: Asia Pacific Bunker Fuel Industry Revenue Share (%), by Country 2024 & 2032
- Figure 14: Asia Pacific Bunker Fuel Industry Volume Share (%), by Country 2024 & 2032
- Figure 15: South America Bunker Fuel Industry Revenue (Million), by Country 2024 & 2032
- Figure 16: South America Bunker Fuel Industry Volume (metric tonnes), by Country 2024 & 2032
- Figure 17: South America Bunker Fuel Industry Revenue Share (%), by Country 2024 & 2032
- Figure 18: South America Bunker Fuel Industry Volume Share (%), by Country 2024 & 2032
- Figure 19: Middle East and Africa Bunker Fuel Industry Revenue (Million), by Country 2024 & 2032
- Figure 20: Middle East and Africa Bunker Fuel Industry Volume (metric tonnes), by Country 2024 & 2032
- Figure 21: Middle East and Africa Bunker Fuel Industry Revenue Share (%), by Country 2024 & 2032
- Figure 22: Middle East and Africa Bunker Fuel Industry Volume Share (%), by Country 2024 & 2032
- Figure 23: North America Bunker Fuel Industry Revenue (Million), by Fuel Type 2024 & 2032
- Figure 24: North America Bunker Fuel Industry Volume (metric tonnes), by Fuel Type 2024 & 2032
- Figure 25: North America Bunker Fuel Industry Revenue Share (%), by Fuel Type 2024 & 2032
- Figure 26: North America Bunker Fuel Industry Volume Share (%), by Fuel Type 2024 & 2032
- Figure 27: North America Bunker Fuel Industry Revenue (Million), by Vessel Type 2024 & 2032
- Figure 28: North America Bunker Fuel Industry Volume (metric tonnes), by Vessel Type 2024 & 2032
- Figure 29: North America Bunker Fuel Industry Revenue Share (%), by Vessel Type 2024 & 2032
- Figure 30: North America Bunker Fuel Industry Volume Share (%), by Vessel Type 2024 & 2032
- Figure 31: North America Bunker Fuel Industry Revenue (Million), by Country 2024 & 2032
- Figure 32: North America Bunker Fuel Industry Volume (metric tonnes), by Country 2024 & 2032
- Figure 33: North America Bunker Fuel Industry Revenue Share (%), by Country 2024 & 2032
- Figure 34: North America Bunker Fuel Industry Volume Share (%), by Country 2024 & 2032
- Figure 35: Europe Bunker Fuel Industry Revenue (Million), by Fuel Type 2024 & 2032
- Figure 36: Europe Bunker Fuel Industry Volume (metric tonnes), by Fuel Type 2024 & 2032
- Figure 37: Europe Bunker Fuel Industry Revenue Share (%), by Fuel Type 2024 & 2032
- Figure 38: Europe Bunker Fuel Industry Volume Share (%), by Fuel Type 2024 & 2032
- Figure 39: Europe Bunker Fuel Industry Revenue (Million), by Vessel Type 2024 & 2032
- Figure 40: Europe Bunker Fuel Industry Volume (metric tonnes), by Vessel Type 2024 & 2032
- Figure 41: Europe Bunker Fuel Industry Revenue Share (%), by Vessel Type 2024 & 2032
- Figure 42: Europe Bunker Fuel Industry Volume Share (%), by Vessel Type 2024 & 2032
- Figure 43: Europe Bunker Fuel Industry Revenue (Million), by Country 2024 & 2032
- Figure 44: Europe Bunker Fuel Industry Volume (metric tonnes), by Country 2024 & 2032
- Figure 45: Europe Bunker Fuel Industry Revenue Share (%), by Country 2024 & 2032
- Figure 46: Europe Bunker Fuel Industry Volume Share (%), by Country 2024 & 2032
- Figure 47: Asia Pacific Bunker Fuel Industry Revenue (Million), by Fuel Type 2024 & 2032
- Figure 48: Asia Pacific Bunker Fuel Industry Volume (metric tonnes), by Fuel Type 2024 & 2032
- Figure 49: Asia Pacific Bunker Fuel Industry Revenue Share (%), by Fuel Type 2024 & 2032
- Figure 50: Asia Pacific Bunker Fuel Industry Volume Share (%), by Fuel Type 2024 & 2032
- Figure 51: Asia Pacific Bunker Fuel Industry Revenue (Million), by Vessel Type 2024 & 2032
- Figure 52: Asia Pacific Bunker Fuel Industry Volume (metric tonnes), by Vessel Type 2024 & 2032
- Figure 53: Asia Pacific Bunker Fuel Industry Revenue Share (%), by Vessel Type 2024 & 2032
- Figure 54: Asia Pacific Bunker Fuel Industry Volume Share (%), by Vessel Type 2024 & 2032
- Figure 55: Asia Pacific Bunker Fuel Industry Revenue (Million), by Country 2024 & 2032
- Figure 56: Asia Pacific Bunker Fuel Industry Volume (metric tonnes), by Country 2024 & 2032
- Figure 57: Asia Pacific Bunker Fuel Industry Revenue Share (%), by Country 2024 & 2032
- Figure 58: Asia Pacific Bunker Fuel Industry Volume Share (%), by Country 2024 & 2032
- Figure 59: South America Bunker Fuel Industry Revenue (Million), by Fuel Type 2024 & 2032
- Figure 60: South America Bunker Fuel Industry Volume (metric tonnes), by Fuel Type 2024 & 2032
- Figure 61: South America Bunker Fuel Industry Revenue Share (%), by Fuel Type 2024 & 2032
- Figure 62: South America Bunker Fuel Industry Volume Share (%), by Fuel Type 2024 & 2032
- Figure 63: South America Bunker Fuel Industry Revenue (Million), by Vessel Type 2024 & 2032
- Figure 64: South America Bunker Fuel Industry Volume (metric tonnes), by Vessel Type 2024 & 2032
- Figure 65: South America Bunker Fuel Industry Revenue Share (%), by Vessel Type 2024 & 2032
- Figure 66: South America Bunker Fuel Industry Volume Share (%), by Vessel Type 2024 & 2032
- Figure 67: South America Bunker Fuel Industry Revenue (Million), by Country 2024 & 2032
- Figure 68: South America Bunker Fuel Industry Volume (metric tonnes), by Country 2024 & 2032
- Figure 69: South America Bunker Fuel Industry Revenue Share (%), by Country 2024 & 2032
- Figure 70: South America Bunker Fuel Industry Volume Share (%), by Country 2024 & 2032
- Figure 71: Middle East and Africa Bunker Fuel Industry Revenue (Million), by Fuel Type 2024 & 2032
- Figure 72: Middle East and Africa Bunker Fuel Industry Volume (metric tonnes), by Fuel Type 2024 & 2032
- Figure 73: Middle East and Africa Bunker Fuel Industry Revenue Share (%), by Fuel Type 2024 & 2032
- Figure 74: Middle East and Africa Bunker Fuel Industry Volume Share (%), by Fuel Type 2024 & 2032
- Figure 75: Middle East and Africa Bunker Fuel Industry Revenue (Million), by Vessel Type 2024 & 2032
- Figure 76: Middle East and Africa Bunker Fuel Industry Volume (metric tonnes), by Vessel Type 2024 & 2032
- Figure 77: Middle East and Africa Bunker Fuel Industry Revenue Share (%), by Vessel Type 2024 & 2032
- Figure 78: Middle East and Africa Bunker Fuel Industry Volume Share (%), by Vessel Type 2024 & 2032
- Figure 79: Middle East and Africa Bunker Fuel Industry Revenue (Million), by Country 2024 & 2032
- Figure 80: Middle East and Africa Bunker Fuel Industry Volume (metric tonnes), by Country 2024 & 2032
- Figure 81: Middle East and Africa Bunker Fuel Industry Revenue Share (%), by Country 2024 & 2032
- Figure 82: Middle East and Africa Bunker Fuel Industry Volume Share (%), by Country 2024 & 2032
List of Tables
- Table 1: Global Bunker Fuel Industry Revenue Million Forecast, by Region 2019 & 2032
- Table 2: Global Bunker Fuel Industry Volume metric tonnes Forecast, by Region 2019 & 2032
- Table 3: Global Bunker Fuel Industry Revenue Million Forecast, by Fuel Type 2019 & 2032
- Table 4: Global Bunker Fuel Industry Volume metric tonnes Forecast, by Fuel Type 2019 & 2032
- Table 5: Global Bunker Fuel Industry Revenue Million Forecast, by Vessel Type 2019 & 2032
- Table 6: Global Bunker Fuel Industry Volume metric tonnes Forecast, by Vessel Type 2019 & 2032
- Table 7: Global Bunker Fuel Industry Revenue Million Forecast, by Region 2019 & 2032
- Table 8: Global Bunker Fuel Industry Volume metric tonnes Forecast, by Region 2019 & 2032
- Table 9: Global Bunker Fuel Industry Revenue Million Forecast, by Country 2019 & 2032
- Table 10: Global Bunker Fuel Industry Volume metric tonnes Forecast, by Country 2019 & 2032
- Table 11: United States Bunker Fuel Industry Revenue (Million) Forecast, by Application 2019 & 2032
- Table 12: United States Bunker Fuel Industry Volume (metric tonnes) Forecast, by Application 2019 & 2032
- Table 13: Canada Bunker Fuel Industry Revenue (Million) Forecast, by Application 2019 & 2032
- Table 14: Canada Bunker Fuel Industry Volume (metric tonnes) Forecast, by Application 2019 & 2032
- Table 15: Rest of North America Bunker Fuel Industry Revenue (Million) Forecast, by Application 2019 & 2032
- Table 16: Rest of North America Bunker Fuel Industry Volume (metric tonnes) Forecast, by Application 2019 & 2032
- Table 17: Global Bunker Fuel Industry Revenue Million Forecast, by Country 2019 & 2032
- Table 18: Global Bunker Fuel Industry Volume metric tonnes Forecast, by Country 2019 & 2032
- Table 19: Germany Bunker Fuel Industry Revenue (Million) Forecast, by Application 2019 & 2032
- Table 20: Germany Bunker Fuel Industry Volume (metric tonnes) Forecast, by Application 2019 & 2032
- Table 21: France Bunker Fuel Industry Revenue (Million) Forecast, by Application 2019 & 2032
- Table 22: France Bunker Fuel Industry Volume (metric tonnes) Forecast, by Application 2019 & 2032
- Table 23: United Kingdom Bunker Fuel Industry Revenue (Million) Forecast, by Application 2019 & 2032
- Table 24: United Kingdom Bunker Fuel Industry Volume (metric tonnes) Forecast, by Application 2019 & 2032
- Table 25: Rest of Europe Bunker Fuel Industry Revenue (Million) Forecast, by Application 2019 & 2032
- Table 26: Rest of Europe Bunker Fuel Industry Volume (metric tonnes) Forecast, by Application 2019 & 2032
- Table 27: Global Bunker Fuel Industry Revenue Million Forecast, by Country 2019 & 2032
- Table 28: Global Bunker Fuel Industry Volume metric tonnes Forecast, by Country 2019 & 2032
- Table 29: China Bunker Fuel Industry Revenue (Million) Forecast, by Application 2019 & 2032
- Table 30: China Bunker Fuel Industry Volume (metric tonnes) Forecast, by Application 2019 & 2032
- Table 31: India Bunker Fuel Industry Revenue (Million) Forecast, by Application 2019 & 2032
- Table 32: India Bunker Fuel Industry Volume (metric tonnes) Forecast, by Application 2019 & 2032
- Table 33: Japan Bunker Fuel Industry Revenue (Million) Forecast, by Application 2019 & 2032
- Table 34: Japan Bunker Fuel Industry Volume (metric tonnes) Forecast, by Application 2019 & 2032
- Table 35: South Korea Bunker Fuel Industry Revenue (Million) Forecast, by Application 2019 & 2032
- Table 36: South Korea Bunker Fuel Industry Volume (metric tonnes) Forecast, by Application 2019 & 2032
- Table 37: Rest of Asia Pacific Bunker Fuel Industry Revenue (Million) Forecast, by Application 2019 & 2032
- Table 38: Rest of Asia Pacific Bunker Fuel Industry Volume (metric tonnes) Forecast, by Application 2019 & 2032
- Table 39: Global Bunker Fuel Industry Revenue Million Forecast, by Country 2019 & 2032
- Table 40: Global Bunker Fuel Industry Volume metric tonnes Forecast, by Country 2019 & 2032
- Table 41: Brazil Bunker Fuel Industry Revenue (Million) Forecast, by Application 2019 & 2032
- Table 42: Brazil Bunker Fuel Industry Volume (metric tonnes) Forecast, by Application 2019 & 2032
- Table 43: Argentina Bunker Fuel Industry Revenue (Million) Forecast, by Application 2019 & 2032
- Table 44: Argentina Bunker Fuel Industry Volume (metric tonnes) Forecast, by Application 2019 & 2032
- Table 45: Rest of South America Bunker Fuel Industry Revenue (Million) Forecast, by Application 2019 & 2032
- Table 46: Rest of South America Bunker Fuel Industry Volume (metric tonnes) Forecast, by Application 2019 & 2032
- Table 47: Global Bunker Fuel Industry Revenue Million Forecast, by Country 2019 & 2032
- Table 48: Global Bunker Fuel Industry Volume metric tonnes Forecast, by Country 2019 & 2032
- Table 49: Saudi Arabia Bunker Fuel Industry Revenue (Million) Forecast, by Application 2019 & 2032
- Table 50: Saudi Arabia Bunker Fuel Industry Volume (metric tonnes) Forecast, by Application 2019 & 2032
- Table 51: United Arab Emirates Bunker Fuel Industry Revenue (Million) Forecast, by Application 2019 & 2032
- Table 52: United Arab Emirates Bunker Fuel Industry Volume (metric tonnes) Forecast, by Application 2019 & 2032
- Table 53: South Africa Bunker Fuel Industry Revenue (Million) Forecast, by Application 2019 & 2032
- Table 54: South Africa Bunker Fuel Industry Volume (metric tonnes) Forecast, by Application 2019 & 2032
- Table 55: Rest of Middle East and Africa Bunker Fuel Industry Revenue (Million) Forecast, by Application 2019 & 2032
- Table 56: Rest of Middle East and Africa Bunker Fuel Industry Volume (metric tonnes) Forecast, by Application 2019 & 2032
- Table 57: Global Bunker Fuel Industry Revenue Million Forecast, by Fuel Type 2019 & 2032
- Table 58: Global Bunker Fuel Industry Volume metric tonnes Forecast, by Fuel Type 2019 & 2032
- Table 59: Global Bunker Fuel Industry Revenue Million Forecast, by Vessel Type 2019 & 2032
- Table 60: Global Bunker Fuel Industry Volume metric tonnes Forecast, by Vessel Type 2019 & 2032
- Table 61: Global Bunker Fuel Industry Revenue Million Forecast, by Country 2019 & 2032
- Table 62: Global Bunker Fuel Industry Volume metric tonnes Forecast, by Country 2019 & 2032
- Table 63: United States Bunker Fuel Industry Revenue (Million) Forecast, by Application 2019 & 2032
- Table 64: United States Bunker Fuel Industry Volume (metric tonnes) Forecast, by Application 2019 & 2032
- Table 65: Canada Bunker Fuel Industry Revenue (Million) Forecast, by Application 2019 & 2032
- Table 66: Canada Bunker Fuel Industry Volume (metric tonnes) Forecast, by Application 2019 & 2032
- Table 67: Rest of North America Bunker Fuel Industry Revenue (Million) Forecast, by Application 2019 & 2032
- Table 68: Rest of North America Bunker Fuel Industry Volume (metric tonnes) Forecast, by Application 2019 & 2032
- Table 69: Global Bunker Fuel Industry Revenue Million Forecast, by Fuel Type 2019 & 2032
- Table 70: Global Bunker Fuel Industry Volume metric tonnes Forecast, by Fuel Type 2019 & 2032
- Table 71: Global Bunker Fuel Industry Revenue Million Forecast, by Vessel Type 2019 & 2032
- Table 72: Global Bunker Fuel Industry Volume metric tonnes Forecast, by Vessel Type 2019 & 2032
- Table 73: Global Bunker Fuel Industry Revenue Million Forecast, by Country 2019 & 2032
- Table 74: Global Bunker Fuel Industry Volume metric tonnes Forecast, by Country 2019 & 2032
- Table 75: Germany Bunker Fuel Industry Revenue (Million) Forecast, by Application 2019 & 2032
- Table 76: Germany Bunker Fuel Industry Volume (metric tonnes) Forecast, by Application 2019 & 2032
- Table 77: France Bunker Fuel Industry Revenue (Million) Forecast, by Application 2019 & 2032
- Table 78: France Bunker Fuel Industry Volume (metric tonnes) Forecast, by Application 2019 & 2032
- Table 79: United Kingdom Bunker Fuel Industry Revenue (Million) Forecast, by Application 2019 & 2032
- Table 80: United Kingdom Bunker Fuel Industry Volume (metric tonnes) Forecast, by Application 2019 & 2032
- Table 81: Spain Bunker Fuel Industry Revenue (Million) Forecast, by Application 2019 & 2032
- Table 82: Spain Bunker Fuel Industry Volume (metric tonnes) Forecast, by Application 2019 & 2032
- Table 83: NORDIC Bunker Fuel Industry Revenue (Million) Forecast, by Application 2019 & 2032
- Table 84: NORDIC Bunker Fuel Industry Volume (metric tonnes) Forecast, by Application 2019 & 2032
- Table 85: Turkey Bunker Fuel Industry Revenue (Million) Forecast, by Application 2019 & 2032
- Table 86: Turkey Bunker Fuel Industry Volume (metric tonnes) Forecast, by Application 2019 & 2032
- Table 87: Russia Bunker Fuel Industry Revenue (Million) Forecast, by Application 2019 & 2032
- Table 88: Russia Bunker Fuel Industry Volume (metric tonnes) Forecast, by Application 2019 & 2032
- Table 89: Rest of Europe Bunker Fuel Industry Revenue (Million) Forecast, by Application 2019 & 2032
- Table 90: Rest of Europe Bunker Fuel Industry Volume (metric tonnes) Forecast, by Application 2019 & 2032
- Table 91: Global Bunker Fuel Industry Revenue Million Forecast, by Fuel Type 2019 & 2032
- Table 92: Global Bunker Fuel Industry Volume metric tonnes Forecast, by Fuel Type 2019 & 2032
- Table 93: Global Bunker Fuel Industry Revenue Million Forecast, by Vessel Type 2019 & 2032
- Table 94: Global Bunker Fuel Industry Volume metric tonnes Forecast, by Vessel Type 2019 & 2032
- Table 95: Global Bunker Fuel Industry Revenue Million Forecast, by Country 2019 & 2032
- Table 96: Global Bunker Fuel Industry Volume metric tonnes Forecast, by Country 2019 & 2032
- Table 97: China Bunker Fuel Industry Revenue (Million) Forecast, by Application 2019 & 2032
- Table 98: China Bunker Fuel Industry Volume (metric tonnes) Forecast, by Application 2019 & 2032
- Table 99: India Bunker Fuel Industry Revenue (Million) Forecast, by Application 2019 & 2032
- Table 100: India Bunker Fuel Industry Volume (metric tonnes) Forecast, by Application 2019 & 2032
- Table 101: Japan Bunker Fuel Industry Revenue (Million) Forecast, by Application 2019 & 2032
- Table 102: Japan Bunker Fuel Industry Volume (metric tonnes) Forecast, by Application 2019 & 2032
- Table 103: South Korea Bunker Fuel Industry Revenue (Million) Forecast, by Application 2019 & 2032
- Table 104: South Korea Bunker Fuel Industry Volume (metric tonnes) Forecast, by Application 2019 & 2032
- Table 105: Malaysia Bunker Fuel Industry Revenue (Million) Forecast, by Application 2019 & 2032
- Table 106: Malaysia Bunker Fuel Industry Volume (metric tonnes) Forecast, by Application 2019 & 2032
- Table 107: Thailand Bunker Fuel Industry Revenue (Million) Forecast, by Application 2019 & 2032
- Table 108: Thailand Bunker Fuel Industry Volume (metric tonnes) Forecast, by Application 2019 & 2032
- Table 109: Indonesia Bunker Fuel Industry Revenue (Million) Forecast, by Application 2019 & 2032
- Table 110: Indonesia Bunker Fuel Industry Volume (metric tonnes) Forecast, by Application 2019 & 2032
- Table 111: Vietnam Bunker Fuel Industry Revenue (Million) Forecast, by Application 2019 & 2032
- Table 112: Vietnam Bunker Fuel Industry Volume (metric tonnes) Forecast, by Application 2019 & 2032
- Table 113: Rest of Asia Pacific Bunker Fuel Industry Revenue (Million) Forecast, by Application 2019 & 2032
- Table 114: Rest of Asia Pacific Bunker Fuel Industry Volume (metric tonnes) Forecast, by Application 2019 & 2032
- Table 115: Global Bunker Fuel Industry Revenue Million Forecast, by Fuel Type 2019 & 2032
- Table 116: Global Bunker Fuel Industry Volume metric tonnes Forecast, by Fuel Type 2019 & 2032
- Table 117: Global Bunker Fuel Industry Revenue Million Forecast, by Vessel Type 2019 & 2032
- Table 118: Global Bunker Fuel Industry Volume metric tonnes Forecast, by Vessel Type 2019 & 2032
- Table 119: Global Bunker Fuel Industry Revenue Million Forecast, by Country 2019 & 2032
- Table 120: Global Bunker Fuel Industry Volume metric tonnes Forecast, by Country 2019 & 2032
- Table 121: Brazil Bunker Fuel Industry Revenue (Million) Forecast, by Application 2019 & 2032
- Table 122: Brazil Bunker Fuel Industry Volume (metric tonnes) Forecast, by Application 2019 & 2032
- Table 123: Argentina Bunker Fuel Industry Revenue (Million) Forecast, by Application 2019 & 2032
- Table 124: Argentina Bunker Fuel Industry Volume (metric tonnes) Forecast, by Application 2019 & 2032
- Table 125: Colombia Bunker Fuel Industry Revenue (Million) Forecast, by Application 2019 & 2032
- Table 126: Colombia Bunker Fuel Industry Volume (metric tonnes) Forecast, by Application 2019 & 2032
- Table 127: Rest of South America Bunker Fuel Industry Revenue (Million) Forecast, by Application 2019 & 2032
- Table 128: Rest of South America Bunker Fuel Industry Volume (metric tonnes) Forecast, by Application 2019 & 2032
- Table 129: Global Bunker Fuel Industry Revenue Million Forecast, by Fuel Type 2019 & 2032
- Table 130: Global Bunker Fuel Industry Volume metric tonnes Forecast, by Fuel Type 2019 & 2032
- Table 131: Global Bunker Fuel Industry Revenue Million Forecast, by Vessel Type 2019 & 2032
- Table 132: Global Bunker Fuel Industry Volume metric tonnes Forecast, by Vessel Type 2019 & 2032
- Table 133: Global Bunker Fuel Industry Revenue Million Forecast, by Country 2019 & 2032
- Table 134: Global Bunker Fuel Industry Volume metric tonnes Forecast, by Country 2019 & 2032
- Table 135: Saudi Arabia Bunker Fuel Industry Revenue (Million) Forecast, by Application 2019 & 2032
- Table 136: Saudi Arabia Bunker Fuel Industry Volume (metric tonnes) Forecast, by Application 2019 & 2032
- Table 137: United Arab Emirates Bunker Fuel Industry Revenue (Million) Forecast, by Application 2019 & 2032
- Table 138: United Arab Emirates Bunker Fuel Industry Volume (metric tonnes) Forecast, by Application 2019 & 2032
- Table 139: South Africa Bunker Fuel Industry Revenue (Million) Forecast, by Application 2019 & 2032
- Table 140: South Africa Bunker Fuel Industry Volume (metric tonnes) Forecast, by Application 2019 & 2032
- Table 141: Nigeria Bunker Fuel Industry Revenue (Million) Forecast, by Application 2019 & 2032
- Table 142: Nigeria Bunker Fuel Industry Volume (metric tonnes) Forecast, by Application 2019 & 2032
- Table 143: Qatar Bunker Fuel Industry Revenue (Million) Forecast, by Application 2019 & 2032
- Table 144: Qatar Bunker Fuel Industry Volume (metric tonnes) Forecast, by Application 2019 & 2032
- Table 145: Egypt Bunker Fuel Industry Revenue (Million) Forecast, by Application 2019 & 2032
- Table 146: Egypt Bunker Fuel Industry Volume (metric tonnes) Forecast, by Application 2019 & 2032
- Table 147: Rest of Middle East and Africa Bunker Fuel Industry Revenue (Million) Forecast, by Application 2019 & 2032
- Table 148: Rest of Middle East and Africa Bunker Fuel Industry Volume (metric tonnes) Forecast, by Application 2019 & 2032
Frequently Asked Questions
1. What is the projected Compound Annual Growth Rate (CAGR) of the Bunker Fuel Industry?
The projected CAGR is approximately 2.72%.
2. Which companies are prominent players in the Bunker Fuel Industry?
Key companies in the market include 7 Chevron Corporation, 3 Gazpromneft Marine Bunker LLC, 3 China COSCO Shipping Corporation Limited, 1 AP Moeller Maersk AS, 6 TotalEnergies SE, 2 Shell PLC, 7 Evergreen Marine Corp Taiwan Ltd, 2 Mediterranean Shipping Company SA, Ship Owners, 8 Clipper Oil, 8 Yang Ming Marine Transport Corporation, Fuel Suppliers, 6 Ocean Network Express, 9 Gulf Agency Company Ltd, 10 Pacific International Lines Pte Ltd*List Not Exhaustive, 9 HMM Co Ltd, 4 CMA CGM Group, 1 ExxonMobil Corporation, 10 Bomin Bunker Holding GmbH & Co KG, 5 PJSC Lukoil Oil Company, 5 Hapag-Lloyd AG, 4 BP PLC.
3. What are the main segments of the Bunker Fuel Industry?
The market segments include Fuel Type, Vessel Type.
4. Can you provide details about the market size?
The market size is estimated to be USD 198.07 Million as of 2022.
5. What are some drivers contributing to market growth?
4.; Increased LNG Trade Worldwide4.; Increasing Dependecies over Natural Gas for Power Generation.
6. What are the notable trends driving market growth?
LNG as a Bunker Fuel is Likely to Witness Significant Growth.
7. Are there any restraints impacting market growth?
4.; Environmental Concerns and the Strict Regulations Related to Emissions from Maritime Industry.
8. Can you provide examples of recent developments in the market?
In January 2022, Titan LNG secured the tender for the delivery of LNG in the Port of Marseille for Corsica Linea's new Ro-Pax LNG fueled ferry. This partnership indicates the expansion of Titan LNG's operation into the Mediterranean that will enhance the availability of LNG, bioLNG, and in the longer run, hydrogen-derived LNG in the region.
9. What pricing options are available for accessing the report?
Pricing options include single-user, multi-user, and enterprise licenses priced at USD 4750, USD 5250, and USD 8750 respectively.
10. Is the market size provided in terms of value or volume?
The market size is provided in terms of value, measured in Million and volume, measured in metric tonnes.
11. Are there any specific market keywords associated with the report?
Yes, the market keyword associated with the report is "Bunker Fuel Industry," which aids in identifying and referencing the specific market segment covered.
12. How do I determine which pricing option suits my needs best?
The pricing options vary based on user requirements and access needs. Individual users may opt for single-user licenses, while businesses requiring broader access may choose multi-user or enterprise licenses for cost-effective access to the report.
13. Are there any additional resources or data provided in the Bunker Fuel Industry report?
While the report offers comprehensive insights, it's advisable to review the specific contents or supplementary materials provided to ascertain if additional resources or data are available.
14. How can I stay updated on further developments or reports in the Bunker Fuel Industry?
To stay informed about further developments, trends, and reports in the Bunker Fuel Industry, consider subscribing to industry newsletters, following relevant companies and organizations, or regularly checking reputable industry news sources and publications.
Methodology
Step 1 - Identification of Relevant Samples Size from Population Database


Step 2 - Approaches for Defining Global Market Size (Value, Volume* & Price*)

Note*: In applicable scenarios
Step 3 - Data Sources
Primary Research
- Web Analytics
- Survey Reports
- Research Institute
- Latest Research Reports
- Opinion Leaders
Secondary Research
- Annual Reports
- White Paper
- Latest Press Release
- Industry Association
- Paid Database
- Investor Presentations

Step 4 - Data Triangulation
Involves using different sources of information in order to increase the validity of a study
These sources are likely to be stakeholders in a program - participants, other researchers, program staff, other community members, and so on.
Then we put all data in single framework & apply various statistical tools to find out the dynamic on the market.
During the analysis stage, feedback from the stakeholder groups would be compared to determine areas of agreement as well as areas of divergence
