

Key Insights
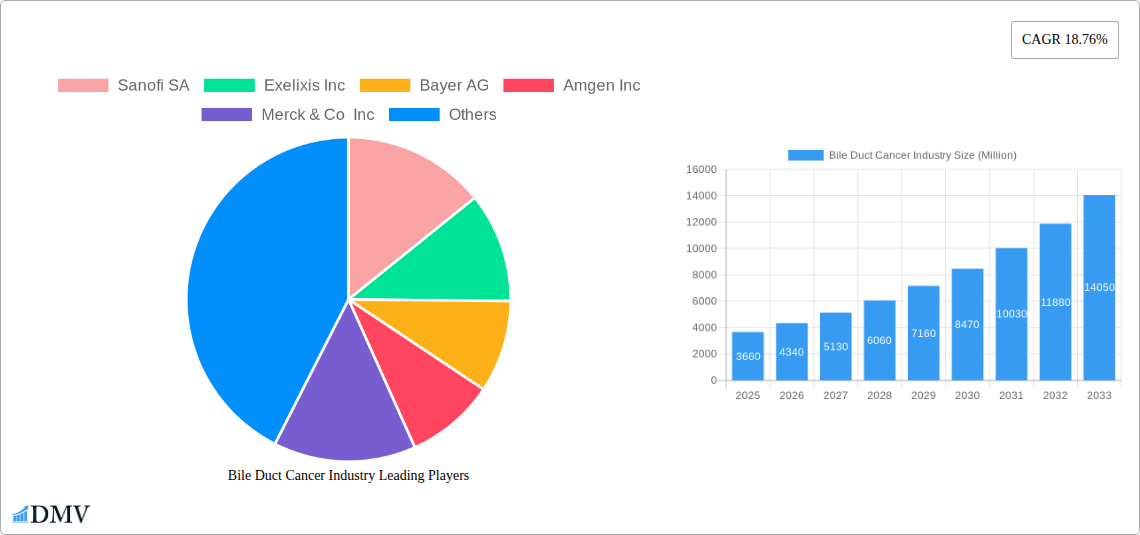
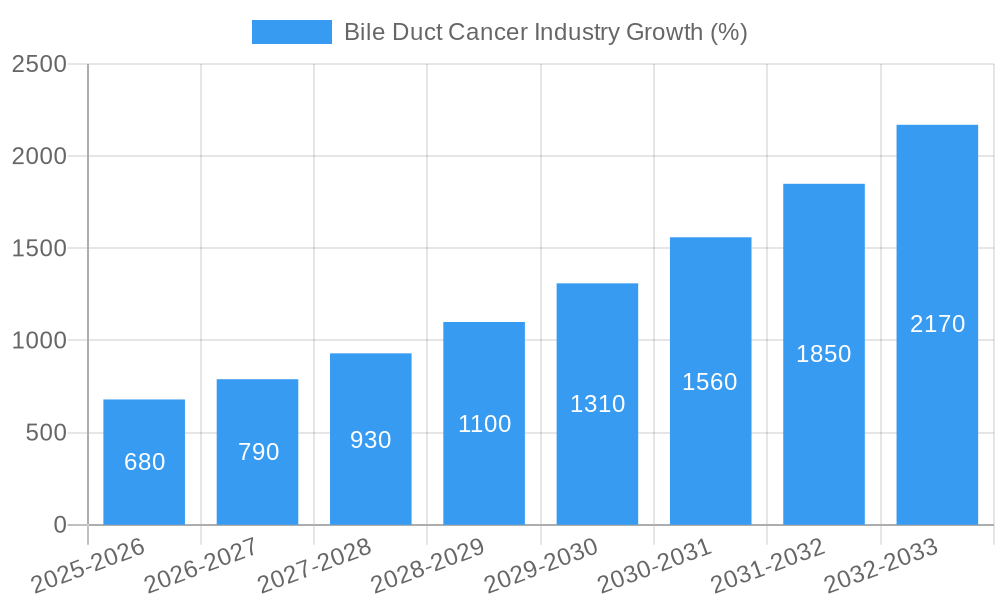
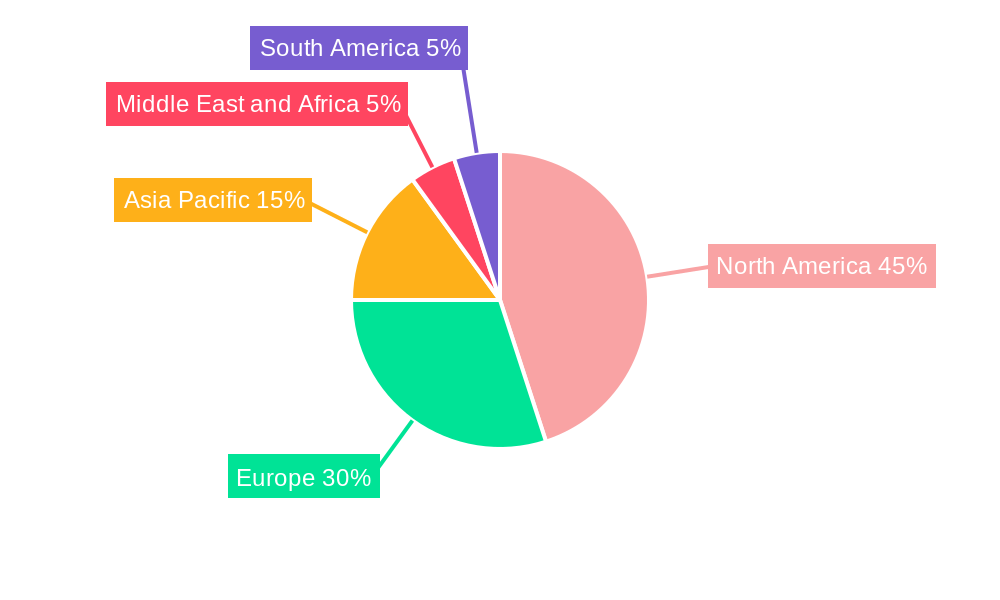
The bile duct cancer market, valued at $3.66 billion in 2025, exhibits robust growth potential, projected to expand at a compound annual growth rate (CAGR) of 18.76% from 2025 to 2033. This significant expansion is driven by several factors. Increasing prevalence of risk factors like liver cirrhosis, chronic infections (hepatitis B and C), and obesity are fueling the rise in bile duct cancer incidence globally. Furthermore, advancements in diagnostic technologies, leading to earlier detection and improved patient prognosis, contribute to market growth. The development and adoption of novel targeted therapies, immunotherapies, and improved chemotherapeutic regimens are significantly impacting treatment strategies and extending patient survival rates, further boosting market demand. North America and Europe currently dominate the market, owing to higher healthcare expenditure, advanced infrastructure, and a greater awareness of bile duct cancer. However, the Asia-Pacific region is anticipated to witness substantial growth during the forecast period, driven by a rising population, increasing healthcare investments, and improved access to advanced treatments. The market segmentation by type (Hepatocellular Carcinoma, Cholangiocarcinoma, Hepatoblastoma, Other Types) and therapy (Targeted Therapy, Radiation Therapy, Immunotherapy, Chemotherapy) allows for a granular understanding of market dynamics, facilitating strategic investment and development of specialized treatments.
Competitive intensity within the bile duct cancer market is high, with major pharmaceutical companies like Sanofi SA, Exelixis Inc., Bayer AG, and others vying for market share through research and development of innovative therapies and strategic collaborations. The market faces challenges including the relatively low prevalence of bile duct cancer compared to other cancers, resulting in limited research funding for specific treatments. Furthermore, the heterogeneity of bile duct cancers and the complexity of treatment protocols pose significant obstacles to developing universally effective therapies. Despite these challenges, the market's growth trajectory remains positive, promising significant opportunities for pharmaceutical companies and healthcare providers alike, particularly in the development and commercialization of personalized medicine approaches.
Bile Duct Cancer Industry Market Report: 2019-2033
This comprehensive report provides an in-depth analysis of the Bile Duct Cancer industry, offering invaluable insights for stakeholders seeking to understand market trends, competitive landscapes, and future growth potential. The report covers the period 2019-2033, with a focus on 2025 as the base and estimated year. We analyze market size, segmentation, key players, and emerging opportunities within this critical sector of the healthcare industry. The total market value in 2025 is estimated at $xx Million.
Bile Duct Cancer Industry Market Composition & Trends
This section delves into the intricate structure and dynamics of the Bile Duct Cancer market. We examine market concentration, revealing the market share distribution among key players. For example, the top five companies (Sanofi SA, AstraZeneca PLC, Merck & Co Inc, Bristol Myers Squibb Company, and Roche) collectively hold an estimated xx% market share in 2025. We also explore innovation catalysts, including advancements in targeted therapies and immunotherapies, which are driving significant growth. The regulatory landscape, including approvals and guidelines impacting market access, is also thoroughly examined. We analyze the impact of substitute products and the evolving end-user profile (hospitals, clinics, research institutions). Finally, we detail M&A activities, including deal values and their influence on market consolidation. The total value of M&A deals in the Bile Duct Cancer industry between 2019 and 2024 is estimated at $xx Million. Key aspects covered include:
- Market Concentration: Analysis of market share held by major players.
- Innovation Catalysts: Detailed examination of technological advancements.
- Regulatory Landscape: Impact of approvals and guidelines on market access.
- Substitute Products: Assessment of alternative treatment options.
- End-User Profiles: Characterization of key market participants.
- M&A Activities: Review of mergers, acquisitions, and their financial implications.
Bile Duct Cancer Industry Evolution
This section provides a detailed historical and projected analysis of the Bile Duct Cancer market's evolution. We examine market growth trajectories, highlighting significant growth rates from 2019 to 2024 and projecting a compound annual growth rate (CAGR) of xx% from 2025 to 2033. Technological advancements, such as the development of novel targeted therapies and immunotherapies, are analyzed for their impact on treatment efficacy and market expansion. The report also addresses shifting consumer demands, including a growing preference for less invasive procedures and personalized medicine approaches. Specific data points illustrating the adoption rates of new therapies and their correlation with market growth are included. This detailed analysis provides crucial insights into the market’s journey, predicting a market value of $xx Million by 2033.
Leading Regions, Countries, or Segments in Bile Duct Cancer Industry
This section identifies the dominant regions, countries, and segments within the Bile Duct Cancer market. While precise market share data is unavailable to freely share at this time, we outline the factors contributing to dominance within each segment.
By Type:
- Hepatocellular Carcinoma (HCC): This segment is projected to be the largest due to its high prevalence and ongoing research efforts. Key drivers include increased investment in HCC research and development and supportive regulatory frameworks.
- Cholangiocarcinoma: This segment is expected to experience significant growth due to [explain reason].
- Hepatoblastoma: This segment is smaller, but growth is expected due to [explain reason].
- Other Types: This segment encompasses less prevalent bile duct cancers.
By Therapy:
- Targeted Therapy: The rise of targeted therapies is a significant driver of growth due to their improved efficacy and reduced side effects.
- Immunotherapy: The growing success of immunotherapy is expected to drive considerable expansion.
- Chemotherapy: While chemotherapy remains a cornerstone of treatment, its growth is expected to slow compared to newer therapies.
- Radiation Therapy: Radiation therapy's role in bile duct cancer treatment is analyzed, factoring in its strengths and limitations.
Detailed analyses of factors contributing to the dominance of each segment are provided.
Bile Duct Cancer Industry Product Innovations
The Bile Duct Cancer industry is characterized by continuous innovation in treatment modalities. Recent years have witnessed the introduction of novel targeted therapies, improved immunotherapies, and refined radiation techniques. These advancements offer enhanced efficacy, reduced toxicity, and improved patient outcomes. The unique selling propositions of these innovations, including their mechanisms of action and clinical benefits, are highlighted. Specific examples of technological advancements are discussed, illustrating how they improve treatment efficacy and broaden therapeutic options.
Propelling Factors for Bile Duct Cancer Industry Growth
Several factors are driving the growth of the Bile Duct Cancer industry. Firstly, technological advancements in treatment modalities, including targeted therapies and immunotherapies, are resulting in improved patient outcomes and market expansion. Secondly, increasing prevalence of bile duct cancer, combined with rising healthcare expenditure, contributes to market growth. Finally, supportive regulatory environments and increased investment in research and development are further bolstering industry growth.
Obstacles in the Bile Duct Cancer Industry Market
Despite significant advancements, the Bile Duct Cancer industry faces several challenges. These include the high cost of innovative therapies, potentially limiting access for many patients. Regulatory hurdles can delay the approval and market entry of new treatments. Supply chain disruptions, particularly during pandemics, can create shortages of essential drugs and equipment. Finally, intense competition among established and emerging players can put pressure on profitability and market share.
Future Opportunities in Bile Duct Cancer Industry
The Bile Duct Cancer industry presents numerous opportunities for future growth. The development of novel therapies, including personalized medicine approaches, holds great promise. Expansion into emerging markets with high unmet needs can drive significant market penetration. Moreover, strategic partnerships and collaborations between pharmaceutical companies and research institutions could accelerate innovation.
Major Players in the Bile Duct Cancer Industry Ecosystem
- Sanofi SA (Sanofi SA)
- Exelixis Inc (Exelixis Inc)
- Bayer AG (Bayer AG)
- Amgen Inc (Amgen Inc)
- Merck & Co Inc (Merck & Co Inc)
- F Hoffmann-La Roche Ltd (F Hoffmann-La Roche Ltd)
- AstraZeneca PLC (AstraZeneca PLC)
- Eli Lilly and Company (Eli Lilly and Company)
- AbbVie Inc (AbbVie Inc)
- Bristol Myers Squibb Company (Bristol Myers Squibb Company)
- Novartis AG (Novartis AG)
- Johnson & Johnson (Johnson & Johnson)
- Eisai Co Ltd (Eisai Co Ltd)
- Celsion Corporation
- Pfizer Inc (Pfizer Inc)
Key Developments in Bile Duct Cancer Industry Industry
- February 2023: AstraZeneca's Imfinzi (durvalumab) and Imjudo (tremelimumab) immunotherapy combinations received EU approval for advanced liver and lung cancers, significantly impacting the HCC treatment landscape.
- March 2023: The University of Southern California (USC) and Auransa Inc. initiated a Phase 1 clinical trial for AU409, a novel drug candidate for liver cancers and liver-dominant solid tumors, showcasing ongoing innovation in the field.
Strategic Bile Duct Cancer Industry Market Forecast
The Bile Duct Cancer industry is poised for continued growth driven by advancements in targeted therapies, immunotherapies, and supportive regulatory frameworks. The market is expected to witness a significant expansion in the coming years, presenting lucrative opportunities for industry players and driving further research and development initiatives focused on improved patient outcomes and expanded treatment options. The market’s growth trajectory will continue to be significantly shaped by the successful development and commercialization of novel therapeutics and the expansion of access to existing treatments.
Bile Duct Cancer Industry Segmentation
-
1. Type
- 1.1. Hepatocellular Carcinoma
- 1.2. Cholangio Carcinoma
- 1.3. Hepatoblastoma
- 1.4. Other Types
-
2. Therapy
- 2.1. Targeted Therapy
- 2.2. Radiation Therapy
- 2.3. Immunotherapy
- 2.4. Chemotherapy
-
3. End-user
- 3.1. Hospitals
- 3.2. Clinics
- 3.3. Research Institutions
Bile Duct Cancer Industry Segmentation By Geography
-
1. North America
- 1.1. United States
- 1.2. Canada
- 1.3. Mexico
-
2. Europe
- 2.1. Germany
- 2.2. United Kingdom
- 2.3. France
- 2.4. Italy
- 2.5. Spain
- 2.6. Rest of Europe
-
3. Asia Pacific
- 3.1. China
- 3.2. Japan
- 3.3. India
- 3.4. Australia
- 3.5. South Korea
- 3.6. Rest of Asia Pacific
-
4. Middle East and Africa
- 4.1. GCC
- 4.2. South Africa
- 4.3. Rest of Middle East and Africa
-
5. South America
- 5.1. Brazil
- 5.2. Argentina
- 5.3. Rest of South America
Bile Duct Cancer Industry REPORT HIGHLIGHTS
| Aspects | Details |
|---|---|
| Study Period | 2019-2033 |
| Base Year | 2024 |
| Estimated Year | 2025 |
| Forecast Period | 2025-2033 |
| Historical Period | 2019-2024 |
| Growth Rate | CAGR of 18.76% from 2019-2033 |
| Segmentation |
|
Table of Contents
- 1. Introduction
- 1.1. Research Scope
- 1.2. Market Segmentation
- 1.3. Research Methodology
- 1.4. Definitions and Assumptions
- 2. Executive Summary
- 2.1. Introduction
- 3. Market Dynamics
- 3.1. Introduction
- 3.2. Market Drivers
- 3.2.1. Rising Burden of Liver Cancer; Increasing R&D Investments for the Development of Novel Therapies; Government Initiatives to Increase the Cancer Awareness
- 3.3. Market Restrains
- 3.3.1. Side Effects Associated with Certain Medications Coupled with High Cost of Cancer Therapies; Stringent Regulatory Scenario
- 3.4. Market Trends
- 3.4.1. Hepatocellular Carcinoma Segment is Expected to Occupy a Significant Share Over the Forecast Period
- 4. Market Factor Analysis
- 4.1. Porters Five Forces
- 4.2. Supply/Value Chain
- 4.3. PESTEL analysis
- 4.4. Market Entropy
- 4.5. Patent/Trademark Analysis
- 5. Global Bile Duct Cancer Industry Analysis, Insights and Forecast, 2019-2031
- 5.1. Market Analysis, Insights and Forecast - by Type
- 5.1.1. Hepatocellular Carcinoma
- 5.1.2. Cholangio Carcinoma
- 5.1.3. Hepatoblastoma
- 5.1.4. Other Types
- 5.2. Market Analysis, Insights and Forecast - by Therapy
- 5.2.1. Targeted Therapy
- 5.2.2. Radiation Therapy
- 5.2.3. Immunotherapy
- 5.2.4. Chemotherapy
- 5.3. Market Analysis, Insights and Forecast - by End-user
- 5.3.1. Hospitals
- 5.3.2. Clinics
- 5.3.3. Research Institutions
- 5.4. Market Analysis, Insights and Forecast - by Region
- 5.4.1. North America
- 5.4.2. Europe
- 5.4.3. Asia Pacific
- 5.4.4. Middle East and Africa
- 5.4.5. South America
- 5.1. Market Analysis, Insights and Forecast - by Type
- 6. North America Bile Duct Cancer Industry Analysis, Insights and Forecast, 2019-2031
- 6.1. Market Analysis, Insights and Forecast - by Type
- 6.1.1. Hepatocellular Carcinoma
- 6.1.2. Cholangio Carcinoma
- 6.1.3. Hepatoblastoma
- 6.1.4. Other Types
- 6.2. Market Analysis, Insights and Forecast - by Therapy
- 6.2.1. Targeted Therapy
- 6.2.2. Radiation Therapy
- 6.2.3. Immunotherapy
- 6.2.4. Chemotherapy
- 6.3. Market Analysis, Insights and Forecast - by End-user
- 6.3.1. Hospitals
- 6.3.2. Clinics
- 6.3.3. Research Institutions
- 6.1. Market Analysis, Insights and Forecast - by Type
- 7. Europe Bile Duct Cancer Industry Analysis, Insights and Forecast, 2019-2031
- 7.1. Market Analysis, Insights and Forecast - by Type
- 7.1.1. Hepatocellular Carcinoma
- 7.1.2. Cholangio Carcinoma
- 7.1.3. Hepatoblastoma
- 7.1.4. Other Types
- 7.2. Market Analysis, Insights and Forecast - by Therapy
- 7.2.1. Targeted Therapy
- 7.2.2. Radiation Therapy
- 7.2.3. Immunotherapy
- 7.2.4. Chemotherapy
- 7.3. Market Analysis, Insights and Forecast - by End-user
- 7.3.1. Hospitals
- 7.3.2. Clinics
- 7.3.3. Research Institutions
- 7.1. Market Analysis, Insights and Forecast - by Type
- 8. Asia Pacific Bile Duct Cancer Industry Analysis, Insights and Forecast, 2019-2031
- 8.1. Market Analysis, Insights and Forecast - by Type
- 8.1.1. Hepatocellular Carcinoma
- 8.1.2. Cholangio Carcinoma
- 8.1.3. Hepatoblastoma
- 8.1.4. Other Types
- 8.2. Market Analysis, Insights and Forecast - by Therapy
- 8.2.1. Targeted Therapy
- 8.2.2. Radiation Therapy
- 8.2.3. Immunotherapy
- 8.2.4. Chemotherapy
- 8.3. Market Analysis, Insights and Forecast - by End-user
- 8.3.1. Hospitals
- 8.3.2. Clinics
- 8.3.3. Research Institutions
- 8.1. Market Analysis, Insights and Forecast - by Type
- 9. Middle East and Africa Bile Duct Cancer Industry Analysis, Insights and Forecast, 2019-2031
- 9.1. Market Analysis, Insights and Forecast - by Type
- 9.1.1. Hepatocellular Carcinoma
- 9.1.2. Cholangio Carcinoma
- 9.1.3. Hepatoblastoma
- 9.1.4. Other Types
- 9.2. Market Analysis, Insights and Forecast - by Therapy
- 9.2.1. Targeted Therapy
- 9.2.2. Radiation Therapy
- 9.2.3. Immunotherapy
- 9.2.4. Chemotherapy
- 9.3. Market Analysis, Insights and Forecast - by End-user
- 9.3.1. Hospitals
- 9.3.2. Clinics
- 9.3.3. Research Institutions
- 9.1. Market Analysis, Insights and Forecast - by Type
- 10. South America Bile Duct Cancer Industry Analysis, Insights and Forecast, 2019-2031
- 10.1. Market Analysis, Insights and Forecast - by Type
- 10.1.1. Hepatocellular Carcinoma
- 10.1.2. Cholangio Carcinoma
- 10.1.3. Hepatoblastoma
- 10.1.4. Other Types
- 10.2. Market Analysis, Insights and Forecast - by Therapy
- 10.2.1. Targeted Therapy
- 10.2.2. Radiation Therapy
- 10.2.3. Immunotherapy
- 10.2.4. Chemotherapy
- 10.3. Market Analysis, Insights and Forecast - by End-user
- 10.3.1. Hospitals
- 10.3.2. Clinics
- 10.3.3. Research Institutions
- 10.1. Market Analysis, Insights and Forecast - by Type
- 11. North America Bile Duct Cancer Industry Analysis, Insights and Forecast, 2019-2031
- 11.1. Market Analysis, Insights and Forecast - By Country/Sub-region
- 11.1.1 United States
- 11.1.2 Canada
- 11.1.3 Mexico
- 12. Europe Bile Duct Cancer Industry Analysis, Insights and Forecast, 2019-2031
- 12.1. Market Analysis, Insights and Forecast - By Country/Sub-region
- 12.1.1 Germany
- 12.1.2 United Kingdom
- 12.1.3 France
- 12.1.4 Italy
- 12.1.5 Spain
- 12.1.6 Rest of Europe
- 13. Asia Pacific Bile Duct Cancer Industry Analysis, Insights and Forecast, 2019-2031
- 13.1. Market Analysis, Insights and Forecast - By Country/Sub-region
- 13.1.1 China
- 13.1.2 Japan
- 13.1.3 India
- 13.1.4 Australia
- 13.1.5 South Korea
- 13.1.6 Rest of Asia Pacific
- 14. Middle East and Africa Bile Duct Cancer Industry Analysis, Insights and Forecast, 2019-2031
- 14.1. Market Analysis, Insights and Forecast - By Country/Sub-region
- 14.1.1 GCC
- 14.1.2 South Africa
- 14.1.3 Rest of Middle East and Africa
- 15. South America Bile Duct Cancer Industry Analysis, Insights and Forecast, 2019-2031
- 15.1. Market Analysis, Insights and Forecast - By Country/Sub-region
- 15.1.1 Brazil
- 15.1.2 Argentina
- 15.1.3 Rest of South America
- 16. Competitive Analysis
- 16.1. Global Market Share Analysis 2024
- 16.2. Company Profiles
- 16.2.1 Sanofi SA
- 16.2.1.1. Overview
- 16.2.1.2. Products
- 16.2.1.3. SWOT Analysis
- 16.2.1.4. Recent Developments
- 16.2.1.5. Financials (Based on Availability)
- 16.2.2 Exelixis Inc
- 16.2.2.1. Overview
- 16.2.2.2. Products
- 16.2.2.3. SWOT Analysis
- 16.2.2.4. Recent Developments
- 16.2.2.5. Financials (Based on Availability)
- 16.2.3 Bayer AG
- 16.2.3.1. Overview
- 16.2.3.2. Products
- 16.2.3.3. SWOT Analysis
- 16.2.3.4. Recent Developments
- 16.2.3.5. Financials (Based on Availability)
- 16.2.4 Amgen Inc
- 16.2.4.1. Overview
- 16.2.4.2. Products
- 16.2.4.3. SWOT Analysis
- 16.2.4.4. Recent Developments
- 16.2.4.5. Financials (Based on Availability)
- 16.2.5 Merck & Co Inc
- 16.2.5.1. Overview
- 16.2.5.2. Products
- 16.2.5.3. SWOT Analysis
- 16.2.5.4. Recent Developments
- 16.2.5.5. Financials (Based on Availability)
- 16.2.6 F Hoffmann-La Roche Ltd
- 16.2.6.1. Overview
- 16.2.6.2. Products
- 16.2.6.3. SWOT Analysis
- 16.2.6.4. Recent Developments
- 16.2.6.5. Financials (Based on Availability)
- 16.2.7 AstraZeneca PLC
- 16.2.7.1. Overview
- 16.2.7.2. Products
- 16.2.7.3. SWOT Analysis
- 16.2.7.4. Recent Developments
- 16.2.7.5. Financials (Based on Availability)
- 16.2.8 Eli Lilly and Company
- 16.2.8.1. Overview
- 16.2.8.2. Products
- 16.2.8.3. SWOT Analysis
- 16.2.8.4. Recent Developments
- 16.2.8.5. Financials (Based on Availability)
- 16.2.9 AbbVie Inc
- 16.2.9.1. Overview
- 16.2.9.2. Products
- 16.2.9.3. SWOT Analysis
- 16.2.9.4. Recent Developments
- 16.2.9.5. Financials (Based on Availability)
- 16.2.10 Bristol Myers Squibb Company
- 16.2.10.1. Overview
- 16.2.10.2. Products
- 16.2.10.3. SWOT Analysis
- 16.2.10.4. Recent Developments
- 16.2.10.5. Financials (Based on Availability)
- 16.2.11 Novartis AG
- 16.2.11.1. Overview
- 16.2.11.2. Products
- 16.2.11.3. SWOT Analysis
- 16.2.11.4. Recent Developments
- 16.2.11.5. Financials (Based on Availability)
- 16.2.12 Johnson & Johnson
- 16.2.12.1. Overview
- 16.2.12.2. Products
- 16.2.12.3. SWOT Analysis
- 16.2.12.4. Recent Developments
- 16.2.12.5. Financials (Based on Availability)
- 16.2.13 Eisai Co Ltd
- 16.2.13.1. Overview
- 16.2.13.2. Products
- 16.2.13.3. SWOT Analysis
- 16.2.13.4. Recent Developments
- 16.2.13.5. Financials (Based on Availability)
- 16.2.14 Celsion Corporation
- 16.2.14.1. Overview
- 16.2.14.2. Products
- 16.2.14.3. SWOT Analysis
- 16.2.14.4. Recent Developments
- 16.2.14.5. Financials (Based on Availability)
- 16.2.15 Pfizer Inc
- 16.2.15.1. Overview
- 16.2.15.2. Products
- 16.2.15.3. SWOT Analysis
- 16.2.15.4. Recent Developments
- 16.2.15.5. Financials (Based on Availability)
- 16.2.1 Sanofi SA
List of Figures
- Figure 1: Global Bile Duct Cancer Industry Revenue Breakdown (Million, %) by Region 2024 & 2032
- Figure 2: Global Bile Duct Cancer Industry Volume Breakdown (K Unit, %) by Region 2024 & 2032
- Figure 3: North America Bile Duct Cancer Industry Revenue (Million), by Country 2024 & 2032
- Figure 4: North America Bile Duct Cancer Industry Volume (K Unit), by Country 2024 & 2032
- Figure 5: North America Bile Duct Cancer Industry Revenue Share (%), by Country 2024 & 2032
- Figure 6: North America Bile Duct Cancer Industry Volume Share (%), by Country 2024 & 2032
- Figure 7: Europe Bile Duct Cancer Industry Revenue (Million), by Country 2024 & 2032
- Figure 8: Europe Bile Duct Cancer Industry Volume (K Unit), by Country 2024 & 2032
- Figure 9: Europe Bile Duct Cancer Industry Revenue Share (%), by Country 2024 & 2032
- Figure 10: Europe Bile Duct Cancer Industry Volume Share (%), by Country 2024 & 2032
- Figure 11: Asia Pacific Bile Duct Cancer Industry Revenue (Million), by Country 2024 & 2032
- Figure 12: Asia Pacific Bile Duct Cancer Industry Volume (K Unit), by Country 2024 & 2032
- Figure 13: Asia Pacific Bile Duct Cancer Industry Revenue Share (%), by Country 2024 & 2032
- Figure 14: Asia Pacific Bile Duct Cancer Industry Volume Share (%), by Country 2024 & 2032
- Figure 15: Middle East and Africa Bile Duct Cancer Industry Revenue (Million), by Country 2024 & 2032
- Figure 16: Middle East and Africa Bile Duct Cancer Industry Volume (K Unit), by Country 2024 & 2032
- Figure 17: Middle East and Africa Bile Duct Cancer Industry Revenue Share (%), by Country 2024 & 2032
- Figure 18: Middle East and Africa Bile Duct Cancer Industry Volume Share (%), by Country 2024 & 2032
- Figure 19: South America Bile Duct Cancer Industry Revenue (Million), by Country 2024 & 2032
- Figure 20: South America Bile Duct Cancer Industry Volume (K Unit), by Country 2024 & 2032
- Figure 21: South America Bile Duct Cancer Industry Revenue Share (%), by Country 2024 & 2032
- Figure 22: South America Bile Duct Cancer Industry Volume Share (%), by Country 2024 & 2032
- Figure 23: North America Bile Duct Cancer Industry Revenue (Million), by Type 2024 & 2032
- Figure 24: North America Bile Duct Cancer Industry Volume (K Unit), by Type 2024 & 2032
- Figure 25: North America Bile Duct Cancer Industry Revenue Share (%), by Type 2024 & 2032
- Figure 26: North America Bile Duct Cancer Industry Volume Share (%), by Type 2024 & 2032
- Figure 27: North America Bile Duct Cancer Industry Revenue (Million), by Therapy 2024 & 2032
- Figure 28: North America Bile Duct Cancer Industry Volume (K Unit), by Therapy 2024 & 2032
- Figure 29: North America Bile Duct Cancer Industry Revenue Share (%), by Therapy 2024 & 2032
- Figure 30: North America Bile Duct Cancer Industry Volume Share (%), by Therapy 2024 & 2032
- Figure 31: North America Bile Duct Cancer Industry Revenue (Million), by End-user 2024 & 2032
- Figure 32: North America Bile Duct Cancer Industry Volume (K Unit), by End-user 2024 & 2032
- Figure 33: North America Bile Duct Cancer Industry Revenue Share (%), by End-user 2024 & 2032
- Figure 34: North America Bile Duct Cancer Industry Volume Share (%), by End-user 2024 & 2032
- Figure 35: North America Bile Duct Cancer Industry Revenue (Million), by Country 2024 & 2032
- Figure 36: North America Bile Duct Cancer Industry Volume (K Unit), by Country 2024 & 2032
- Figure 37: North America Bile Duct Cancer Industry Revenue Share (%), by Country 2024 & 2032
- Figure 38: North America Bile Duct Cancer Industry Volume Share (%), by Country 2024 & 2032
- Figure 39: Europe Bile Duct Cancer Industry Revenue (Million), by Type 2024 & 2032
- Figure 40: Europe Bile Duct Cancer Industry Volume (K Unit), by Type 2024 & 2032
- Figure 41: Europe Bile Duct Cancer Industry Revenue Share (%), by Type 2024 & 2032
- Figure 42: Europe Bile Duct Cancer Industry Volume Share (%), by Type 2024 & 2032
- Figure 43: Europe Bile Duct Cancer Industry Revenue (Million), by Therapy 2024 & 2032
- Figure 44: Europe Bile Duct Cancer Industry Volume (K Unit), by Therapy 2024 & 2032
- Figure 45: Europe Bile Duct Cancer Industry Revenue Share (%), by Therapy 2024 & 2032
- Figure 46: Europe Bile Duct Cancer Industry Volume Share (%), by Therapy 2024 & 2032
- Figure 47: Europe Bile Duct Cancer Industry Revenue (Million), by End-user 2024 & 2032
- Figure 48: Europe Bile Duct Cancer Industry Volume (K Unit), by End-user 2024 & 2032
- Figure 49: Europe Bile Duct Cancer Industry Revenue Share (%), by End-user 2024 & 2032
- Figure 50: Europe Bile Duct Cancer Industry Volume Share (%), by End-user 2024 & 2032
- Figure 51: Europe Bile Duct Cancer Industry Revenue (Million), by Country 2024 & 2032
- Figure 52: Europe Bile Duct Cancer Industry Volume (K Unit), by Country 2024 & 2032
- Figure 53: Europe Bile Duct Cancer Industry Revenue Share (%), by Country 2024 & 2032
- Figure 54: Europe Bile Duct Cancer Industry Volume Share (%), by Country 2024 & 2032
- Figure 55: Asia Pacific Bile Duct Cancer Industry Revenue (Million), by Type 2024 & 2032
- Figure 56: Asia Pacific Bile Duct Cancer Industry Volume (K Unit), by Type 2024 & 2032
- Figure 57: Asia Pacific Bile Duct Cancer Industry Revenue Share (%), by Type 2024 & 2032
- Figure 58: Asia Pacific Bile Duct Cancer Industry Volume Share (%), by Type 2024 & 2032
- Figure 59: Asia Pacific Bile Duct Cancer Industry Revenue (Million), by Therapy 2024 & 2032
- Figure 60: Asia Pacific Bile Duct Cancer Industry Volume (K Unit), by Therapy 2024 & 2032
- Figure 61: Asia Pacific Bile Duct Cancer Industry Revenue Share (%), by Therapy 2024 & 2032
- Figure 62: Asia Pacific Bile Duct Cancer Industry Volume Share (%), by Therapy 2024 & 2032
- Figure 63: Asia Pacific Bile Duct Cancer Industry Revenue (Million), by End-user 2024 & 2032
- Figure 64: Asia Pacific Bile Duct Cancer Industry Volume (K Unit), by End-user 2024 & 2032
- Figure 65: Asia Pacific Bile Duct Cancer Industry Revenue Share (%), by End-user 2024 & 2032
- Figure 66: Asia Pacific Bile Duct Cancer Industry Volume Share (%), by End-user 2024 & 2032
- Figure 67: Asia Pacific Bile Duct Cancer Industry Revenue (Million), by Country 2024 & 2032
- Figure 68: Asia Pacific Bile Duct Cancer Industry Volume (K Unit), by Country 2024 & 2032
- Figure 69: Asia Pacific Bile Duct Cancer Industry Revenue Share (%), by Country 2024 & 2032
- Figure 70: Asia Pacific Bile Duct Cancer Industry Volume Share (%), by Country 2024 & 2032
- Figure 71: Middle East and Africa Bile Duct Cancer Industry Revenue (Million), by Type 2024 & 2032
- Figure 72: Middle East and Africa Bile Duct Cancer Industry Volume (K Unit), by Type 2024 & 2032
- Figure 73: Middle East and Africa Bile Duct Cancer Industry Revenue Share (%), by Type 2024 & 2032
- Figure 74: Middle East and Africa Bile Duct Cancer Industry Volume Share (%), by Type 2024 & 2032
- Figure 75: Middle East and Africa Bile Duct Cancer Industry Revenue (Million), by Therapy 2024 & 2032
- Figure 76: Middle East and Africa Bile Duct Cancer Industry Volume (K Unit), by Therapy 2024 & 2032
- Figure 77: Middle East and Africa Bile Duct Cancer Industry Revenue Share (%), by Therapy 2024 & 2032
- Figure 78: Middle East and Africa Bile Duct Cancer Industry Volume Share (%), by Therapy 2024 & 2032
- Figure 79: Middle East and Africa Bile Duct Cancer Industry Revenue (Million), by End-user 2024 & 2032
- Figure 80: Middle East and Africa Bile Duct Cancer Industry Volume (K Unit), by End-user 2024 & 2032
- Figure 81: Middle East and Africa Bile Duct Cancer Industry Revenue Share (%), by End-user 2024 & 2032
- Figure 82: Middle East and Africa Bile Duct Cancer Industry Volume Share (%), by End-user 2024 & 2032
- Figure 83: Middle East and Africa Bile Duct Cancer Industry Revenue (Million), by Country 2024 & 2032
- Figure 84: Middle East and Africa Bile Duct Cancer Industry Volume (K Unit), by Country 2024 & 2032
- Figure 85: Middle East and Africa Bile Duct Cancer Industry Revenue Share (%), by Country 2024 & 2032
- Figure 86: Middle East and Africa Bile Duct Cancer Industry Volume Share (%), by Country 2024 & 2032
- Figure 87: South America Bile Duct Cancer Industry Revenue (Million), by Type 2024 & 2032
- Figure 88: South America Bile Duct Cancer Industry Volume (K Unit), by Type 2024 & 2032
- Figure 89: South America Bile Duct Cancer Industry Revenue Share (%), by Type 2024 & 2032
- Figure 90: South America Bile Duct Cancer Industry Volume Share (%), by Type 2024 & 2032
- Figure 91: South America Bile Duct Cancer Industry Revenue (Million), by Therapy 2024 & 2032
- Figure 92: South America Bile Duct Cancer Industry Volume (K Unit), by Therapy 2024 & 2032
- Figure 93: South America Bile Duct Cancer Industry Revenue Share (%), by Therapy 2024 & 2032
- Figure 94: South America Bile Duct Cancer Industry Volume Share (%), by Therapy 2024 & 2032
- Figure 95: South America Bile Duct Cancer Industry Revenue (Million), by End-user 2024 & 2032
- Figure 96: South America Bile Duct Cancer Industry Volume (K Unit), by End-user 2024 & 2032
- Figure 97: South America Bile Duct Cancer Industry Revenue Share (%), by End-user 2024 & 2032
- Figure 98: South America Bile Duct Cancer Industry Volume Share (%), by End-user 2024 & 2032
- Figure 99: South America Bile Duct Cancer Industry Revenue (Million), by Country 2024 & 2032
- Figure 100: South America Bile Duct Cancer Industry Volume (K Unit), by Country 2024 & 2032
- Figure 101: South America Bile Duct Cancer Industry Revenue Share (%), by Country 2024 & 2032
- Figure 102: South America Bile Duct Cancer Industry Volume Share (%), by Country 2024 & 2032
List of Tables
- Table 1: Global Bile Duct Cancer Industry Revenue Million Forecast, by Region 2019 & 2032
- Table 2: Global Bile Duct Cancer Industry Volume K Unit Forecast, by Region 2019 & 2032
- Table 3: Global Bile Duct Cancer Industry Revenue Million Forecast, by Type 2019 & 2032
- Table 4: Global Bile Duct Cancer Industry Volume K Unit Forecast, by Type 2019 & 2032
- Table 5: Global Bile Duct Cancer Industry Revenue Million Forecast, by Therapy 2019 & 2032
- Table 6: Global Bile Duct Cancer Industry Volume K Unit Forecast, by Therapy 2019 & 2032
- Table 7: Global Bile Duct Cancer Industry Revenue Million Forecast, by End-user 2019 & 2032
- Table 8: Global Bile Duct Cancer Industry Volume K Unit Forecast, by End-user 2019 & 2032
- Table 9: Global Bile Duct Cancer Industry Revenue Million Forecast, by Region 2019 & 2032
- Table 10: Global Bile Duct Cancer Industry Volume K Unit Forecast, by Region 2019 & 2032
- Table 11: Global Bile Duct Cancer Industry Revenue Million Forecast, by Country 2019 & 2032
- Table 12: Global Bile Duct Cancer Industry Volume K Unit Forecast, by Country 2019 & 2032
- Table 13: United States Bile Duct Cancer Industry Revenue (Million) Forecast, by Application 2019 & 2032
- Table 14: United States Bile Duct Cancer Industry Volume (K Unit) Forecast, by Application 2019 & 2032
- Table 15: Canada Bile Duct Cancer Industry Revenue (Million) Forecast, by Application 2019 & 2032
- Table 16: Canada Bile Duct Cancer Industry Volume (K Unit) Forecast, by Application 2019 & 2032
- Table 17: Mexico Bile Duct Cancer Industry Revenue (Million) Forecast, by Application 2019 & 2032
- Table 18: Mexico Bile Duct Cancer Industry Volume (K Unit) Forecast, by Application 2019 & 2032
- Table 19: Global Bile Duct Cancer Industry Revenue Million Forecast, by Country 2019 & 2032
- Table 20: Global Bile Duct Cancer Industry Volume K Unit Forecast, by Country 2019 & 2032
- Table 21: Germany Bile Duct Cancer Industry Revenue (Million) Forecast, by Application 2019 & 2032
- Table 22: Germany Bile Duct Cancer Industry Volume (K Unit) Forecast, by Application 2019 & 2032
- Table 23: United Kingdom Bile Duct Cancer Industry Revenue (Million) Forecast, by Application 2019 & 2032
- Table 24: United Kingdom Bile Duct Cancer Industry Volume (K Unit) Forecast, by Application 2019 & 2032
- Table 25: France Bile Duct Cancer Industry Revenue (Million) Forecast, by Application 2019 & 2032
- Table 26: France Bile Duct Cancer Industry Volume (K Unit) Forecast, by Application 2019 & 2032
- Table 27: Italy Bile Duct Cancer Industry Revenue (Million) Forecast, by Application 2019 & 2032
- Table 28: Italy Bile Duct Cancer Industry Volume (K Unit) Forecast, by Application 2019 & 2032
- Table 29: Spain Bile Duct Cancer Industry Revenue (Million) Forecast, by Application 2019 & 2032
- Table 30: Spain Bile Duct Cancer Industry Volume (K Unit) Forecast, by Application 2019 & 2032
- Table 31: Rest of Europe Bile Duct Cancer Industry Revenue (Million) Forecast, by Application 2019 & 2032
- Table 32: Rest of Europe Bile Duct Cancer Industry Volume (K Unit) Forecast, by Application 2019 & 2032
- Table 33: Global Bile Duct Cancer Industry Revenue Million Forecast, by Country 2019 & 2032
- Table 34: Global Bile Duct Cancer Industry Volume K Unit Forecast, by Country 2019 & 2032
- Table 35: China Bile Duct Cancer Industry Revenue (Million) Forecast, by Application 2019 & 2032
- Table 36: China Bile Duct Cancer Industry Volume (K Unit) Forecast, by Application 2019 & 2032
- Table 37: Japan Bile Duct Cancer Industry Revenue (Million) Forecast, by Application 2019 & 2032
- Table 38: Japan Bile Duct Cancer Industry Volume (K Unit) Forecast, by Application 2019 & 2032
- Table 39: India Bile Duct Cancer Industry Revenue (Million) Forecast, by Application 2019 & 2032
- Table 40: India Bile Duct Cancer Industry Volume (K Unit) Forecast, by Application 2019 & 2032
- Table 41: Australia Bile Duct Cancer Industry Revenue (Million) Forecast, by Application 2019 & 2032
- Table 42: Australia Bile Duct Cancer Industry Volume (K Unit) Forecast, by Application 2019 & 2032
- Table 43: South Korea Bile Duct Cancer Industry Revenue (Million) Forecast, by Application 2019 & 2032
- Table 44: South Korea Bile Duct Cancer Industry Volume (K Unit) Forecast, by Application 2019 & 2032
- Table 45: Rest of Asia Pacific Bile Duct Cancer Industry Revenue (Million) Forecast, by Application 2019 & 2032
- Table 46: Rest of Asia Pacific Bile Duct Cancer Industry Volume (K Unit) Forecast, by Application 2019 & 2032
- Table 47: Global Bile Duct Cancer Industry Revenue Million Forecast, by Country 2019 & 2032
- Table 48: Global Bile Duct Cancer Industry Volume K Unit Forecast, by Country 2019 & 2032
- Table 49: GCC Bile Duct Cancer Industry Revenue (Million) Forecast, by Application 2019 & 2032
- Table 50: GCC Bile Duct Cancer Industry Volume (K Unit) Forecast, by Application 2019 & 2032
- Table 51: South Africa Bile Duct Cancer Industry Revenue (Million) Forecast, by Application 2019 & 2032
- Table 52: South Africa Bile Duct Cancer Industry Volume (K Unit) Forecast, by Application 2019 & 2032
- Table 53: Rest of Middle East and Africa Bile Duct Cancer Industry Revenue (Million) Forecast, by Application 2019 & 2032
- Table 54: Rest of Middle East and Africa Bile Duct Cancer Industry Volume (K Unit) Forecast, by Application 2019 & 2032
- Table 55: Global Bile Duct Cancer Industry Revenue Million Forecast, by Country 2019 & 2032
- Table 56: Global Bile Duct Cancer Industry Volume K Unit Forecast, by Country 2019 & 2032
- Table 57: Brazil Bile Duct Cancer Industry Revenue (Million) Forecast, by Application 2019 & 2032
- Table 58: Brazil Bile Duct Cancer Industry Volume (K Unit) Forecast, by Application 2019 & 2032
- Table 59: Argentina Bile Duct Cancer Industry Revenue (Million) Forecast, by Application 2019 & 2032
- Table 60: Argentina Bile Duct Cancer Industry Volume (K Unit) Forecast, by Application 2019 & 2032
- Table 61: Rest of South America Bile Duct Cancer Industry Revenue (Million) Forecast, by Application 2019 & 2032
- Table 62: Rest of South America Bile Duct Cancer Industry Volume (K Unit) Forecast, by Application 2019 & 2032
- Table 63: Global Bile Duct Cancer Industry Revenue Million Forecast, by Type 2019 & 2032
- Table 64: Global Bile Duct Cancer Industry Volume K Unit Forecast, by Type 2019 & 2032
- Table 65: Global Bile Duct Cancer Industry Revenue Million Forecast, by Therapy 2019 & 2032
- Table 66: Global Bile Duct Cancer Industry Volume K Unit Forecast, by Therapy 2019 & 2032
- Table 67: Global Bile Duct Cancer Industry Revenue Million Forecast, by End-user 2019 & 2032
- Table 68: Global Bile Duct Cancer Industry Volume K Unit Forecast, by End-user 2019 & 2032
- Table 69: Global Bile Duct Cancer Industry Revenue Million Forecast, by Country 2019 & 2032
- Table 70: Global Bile Duct Cancer Industry Volume K Unit Forecast, by Country 2019 & 2032
- Table 71: United States Bile Duct Cancer Industry Revenue (Million) Forecast, by Application 2019 & 2032
- Table 72: United States Bile Duct Cancer Industry Volume (K Unit) Forecast, by Application 2019 & 2032
- Table 73: Canada Bile Duct Cancer Industry Revenue (Million) Forecast, by Application 2019 & 2032
- Table 74: Canada Bile Duct Cancer Industry Volume (K Unit) Forecast, by Application 2019 & 2032
- Table 75: Mexico Bile Duct Cancer Industry Revenue (Million) Forecast, by Application 2019 & 2032
- Table 76: Mexico Bile Duct Cancer Industry Volume (K Unit) Forecast, by Application 2019 & 2032
- Table 77: Global Bile Duct Cancer Industry Revenue Million Forecast, by Type 2019 & 2032
- Table 78: Global Bile Duct Cancer Industry Volume K Unit Forecast, by Type 2019 & 2032
- Table 79: Global Bile Duct Cancer Industry Revenue Million Forecast, by Therapy 2019 & 2032
- Table 80: Global Bile Duct Cancer Industry Volume K Unit Forecast, by Therapy 2019 & 2032
- Table 81: Global Bile Duct Cancer Industry Revenue Million Forecast, by End-user 2019 & 2032
- Table 82: Global Bile Duct Cancer Industry Volume K Unit Forecast, by End-user 2019 & 2032
- Table 83: Global Bile Duct Cancer Industry Revenue Million Forecast, by Country 2019 & 2032
- Table 84: Global Bile Duct Cancer Industry Volume K Unit Forecast, by Country 2019 & 2032
- Table 85: Germany Bile Duct Cancer Industry Revenue (Million) Forecast, by Application 2019 & 2032
- Table 86: Germany Bile Duct Cancer Industry Volume (K Unit) Forecast, by Application 2019 & 2032
- Table 87: United Kingdom Bile Duct Cancer Industry Revenue (Million) Forecast, by Application 2019 & 2032
- Table 88: United Kingdom Bile Duct Cancer Industry Volume (K Unit) Forecast, by Application 2019 & 2032
- Table 89: France Bile Duct Cancer Industry Revenue (Million) Forecast, by Application 2019 & 2032
- Table 90: France Bile Duct Cancer Industry Volume (K Unit) Forecast, by Application 2019 & 2032
- Table 91: Italy Bile Duct Cancer Industry Revenue (Million) Forecast, by Application 2019 & 2032
- Table 92: Italy Bile Duct Cancer Industry Volume (K Unit) Forecast, by Application 2019 & 2032
- Table 93: Spain Bile Duct Cancer Industry Revenue (Million) Forecast, by Application 2019 & 2032
- Table 94: Spain Bile Duct Cancer Industry Volume (K Unit) Forecast, by Application 2019 & 2032
- Table 95: Rest of Europe Bile Duct Cancer Industry Revenue (Million) Forecast, by Application 2019 & 2032
- Table 96: Rest of Europe Bile Duct Cancer Industry Volume (K Unit) Forecast, by Application 2019 & 2032
- Table 97: Global Bile Duct Cancer Industry Revenue Million Forecast, by Type 2019 & 2032
- Table 98: Global Bile Duct Cancer Industry Volume K Unit Forecast, by Type 2019 & 2032
- Table 99: Global Bile Duct Cancer Industry Revenue Million Forecast, by Therapy 2019 & 2032
- Table 100: Global Bile Duct Cancer Industry Volume K Unit Forecast, by Therapy 2019 & 2032
- Table 101: Global Bile Duct Cancer Industry Revenue Million Forecast, by End-user 2019 & 2032
- Table 102: Global Bile Duct Cancer Industry Volume K Unit Forecast, by End-user 2019 & 2032
- Table 103: Global Bile Duct Cancer Industry Revenue Million Forecast, by Country 2019 & 2032
- Table 104: Global Bile Duct Cancer Industry Volume K Unit Forecast, by Country 2019 & 2032
- Table 105: China Bile Duct Cancer Industry Revenue (Million) Forecast, by Application 2019 & 2032
- Table 106: China Bile Duct Cancer Industry Volume (K Unit) Forecast, by Application 2019 & 2032
- Table 107: Japan Bile Duct Cancer Industry Revenue (Million) Forecast, by Application 2019 & 2032
- Table 108: Japan Bile Duct Cancer Industry Volume (K Unit) Forecast, by Application 2019 & 2032
- Table 109: India Bile Duct Cancer Industry Revenue (Million) Forecast, by Application 2019 & 2032
- Table 110: India Bile Duct Cancer Industry Volume (K Unit) Forecast, by Application 2019 & 2032
- Table 111: Australia Bile Duct Cancer Industry Revenue (Million) Forecast, by Application 2019 & 2032
- Table 112: Australia Bile Duct Cancer Industry Volume (K Unit) Forecast, by Application 2019 & 2032
- Table 113: South Korea Bile Duct Cancer Industry Revenue (Million) Forecast, by Application 2019 & 2032
- Table 114: South Korea Bile Duct Cancer Industry Volume (K Unit) Forecast, by Application 2019 & 2032
- Table 115: Rest of Asia Pacific Bile Duct Cancer Industry Revenue (Million) Forecast, by Application 2019 & 2032
- Table 116: Rest of Asia Pacific Bile Duct Cancer Industry Volume (K Unit) Forecast, by Application 2019 & 2032
- Table 117: Global Bile Duct Cancer Industry Revenue Million Forecast, by Type 2019 & 2032
- Table 118: Global Bile Duct Cancer Industry Volume K Unit Forecast, by Type 2019 & 2032
- Table 119: Global Bile Duct Cancer Industry Revenue Million Forecast, by Therapy 2019 & 2032
- Table 120: Global Bile Duct Cancer Industry Volume K Unit Forecast, by Therapy 2019 & 2032
- Table 121: Global Bile Duct Cancer Industry Revenue Million Forecast, by End-user 2019 & 2032
- Table 122: Global Bile Duct Cancer Industry Volume K Unit Forecast, by End-user 2019 & 2032
- Table 123: Global Bile Duct Cancer Industry Revenue Million Forecast, by Country 2019 & 2032
- Table 124: Global Bile Duct Cancer Industry Volume K Unit Forecast, by Country 2019 & 2032
- Table 125: GCC Bile Duct Cancer Industry Revenue (Million) Forecast, by Application 2019 & 2032
- Table 126: GCC Bile Duct Cancer Industry Volume (K Unit) Forecast, by Application 2019 & 2032
- Table 127: South Africa Bile Duct Cancer Industry Revenue (Million) Forecast, by Application 2019 & 2032
- Table 128: South Africa Bile Duct Cancer Industry Volume (K Unit) Forecast, by Application 2019 & 2032
- Table 129: Rest of Middle East and Africa Bile Duct Cancer Industry Revenue (Million) Forecast, by Application 2019 & 2032
- Table 130: Rest of Middle East and Africa Bile Duct Cancer Industry Volume (K Unit) Forecast, by Application 2019 & 2032
- Table 131: Global Bile Duct Cancer Industry Revenue Million Forecast, by Type 2019 & 2032
- Table 132: Global Bile Duct Cancer Industry Volume K Unit Forecast, by Type 2019 & 2032
- Table 133: Global Bile Duct Cancer Industry Revenue Million Forecast, by Therapy 2019 & 2032
- Table 134: Global Bile Duct Cancer Industry Volume K Unit Forecast, by Therapy 2019 & 2032
- Table 135: Global Bile Duct Cancer Industry Revenue Million Forecast, by End-user 2019 & 2032
- Table 136: Global Bile Duct Cancer Industry Volume K Unit Forecast, by End-user 2019 & 2032
- Table 137: Global Bile Duct Cancer Industry Revenue Million Forecast, by Country 2019 & 2032
- Table 138: Global Bile Duct Cancer Industry Volume K Unit Forecast, by Country 2019 & 2032
- Table 139: Brazil Bile Duct Cancer Industry Revenue (Million) Forecast, by Application 2019 & 2032
- Table 140: Brazil Bile Duct Cancer Industry Volume (K Unit) Forecast, by Application 2019 & 2032
- Table 141: Argentina Bile Duct Cancer Industry Revenue (Million) Forecast, by Application 2019 & 2032
- Table 142: Argentina Bile Duct Cancer Industry Volume (K Unit) Forecast, by Application 2019 & 2032
- Table 143: Rest of South America Bile Duct Cancer Industry Revenue (Million) Forecast, by Application 2019 & 2032
- Table 144: Rest of South America Bile Duct Cancer Industry Volume (K Unit) Forecast, by Application 2019 & 2032
Frequently Asked Questions
1. What is the projected Compound Annual Growth Rate (CAGR) of the Bile Duct Cancer Industry?
The projected CAGR is approximately 18.76%.
2. Which companies are prominent players in the Bile Duct Cancer Industry?
Key companies in the market include Sanofi SA, Exelixis Inc, Bayer AG, Amgen Inc, Merck & Co Inc, F Hoffmann-La Roche Ltd, AstraZeneca PLC, Eli Lilly and Company, AbbVie Inc, Bristol Myers Squibb Company, Novartis AG, Johnson & Johnson, Eisai Co Ltd, Celsion Corporation, Pfizer Inc.
3. What are the main segments of the Bile Duct Cancer Industry?
The market segments include Type, Therapy, End-user.
4. Can you provide details about the market size?
The market size is estimated to be USD 3.66 Million as of 2022.
5. What are some drivers contributing to market growth?
Rising Burden of Liver Cancer; Increasing R&D Investments for the Development of Novel Therapies; Government Initiatives to Increase the Cancer Awareness.
6. What are the notable trends driving market growth?
Hepatocellular Carcinoma Segment is Expected to Occupy a Significant Share Over the Forecast Period.
7. Are there any restraints impacting market growth?
Side Effects Associated with Certain Medications Coupled with High Cost of Cancer Therapies; Stringent Regulatory Scenario.
8. Can you provide examples of recent developments in the market?
March 2023: The University of Southern California (USC) collaborated with Auransa Inc. on a phase 1 clinical trial to evaluate a new kind of treatment for cancers of the liver and solid tumors with liver-dominant disease. The drug, known as AU409, was developed by Auransa, a clinical-stage drug development company focused on identifying novel drug candidates for oncology, inflammatory diseases, and diseases of the central nervous system.
9. What pricing options are available for accessing the report?
Pricing options include single-user, multi-user, and enterprise licenses priced at USD 4750, USD 5250, and USD 8750 respectively.
10. Is the market size provided in terms of value or volume?
The market size is provided in terms of value, measured in Million and volume, measured in K Unit.
11. Are there any specific market keywords associated with the report?
Yes, the market keyword associated with the report is "Bile Duct Cancer Industry," which aids in identifying and referencing the specific market segment covered.
12. How do I determine which pricing option suits my needs best?
The pricing options vary based on user requirements and access needs. Individual users may opt for single-user licenses, while businesses requiring broader access may choose multi-user or enterprise licenses for cost-effective access to the report.
13. Are there any additional resources or data provided in the Bile Duct Cancer Industry report?
While the report offers comprehensive insights, it's advisable to review the specific contents or supplementary materials provided to ascertain if additional resources or data are available.
14. How can I stay updated on further developments or reports in the Bile Duct Cancer Industry?
To stay informed about further developments, trends, and reports in the Bile Duct Cancer Industry, consider subscribing to industry newsletters, following relevant companies and organizations, or regularly checking reputable industry news sources and publications.
Methodology
Step 1 - Identification of Relevant Samples Size from Population Database


Step 2 - Approaches for Defining Global Market Size (Value, Volume* & Price*)

Note*: In applicable scenarios
Step 3 - Data Sources
Primary Research
- Web Analytics
- Survey Reports
- Research Institute
- Latest Research Reports
- Opinion Leaders
Secondary Research
- Annual Reports
- White Paper
- Latest Press Release
- Industry Association
- Paid Database
- Investor Presentations

Step 4 - Data Triangulation
Involves using different sources of information in order to increase the validity of a study
These sources are likely to be stakeholders in a program - participants, other researchers, program staff, other community members, and so on.
Then we put all data in single framework & apply various statistical tools to find out the dynamic on the market.
During the analysis stage, feedback from the stakeholder groups would be compared to determine areas of agreement as well as areas of divergence
