

Key Insights
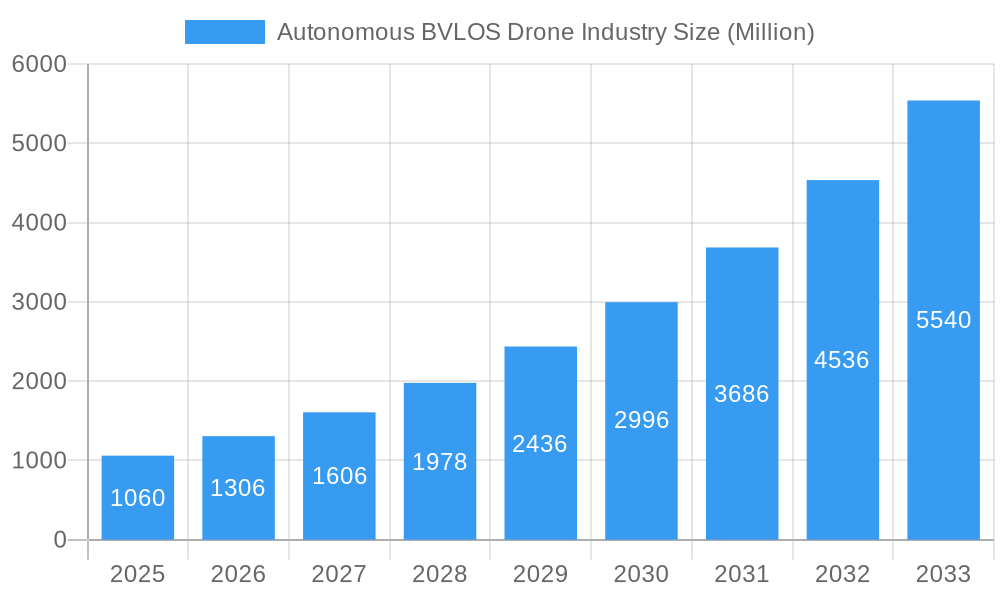
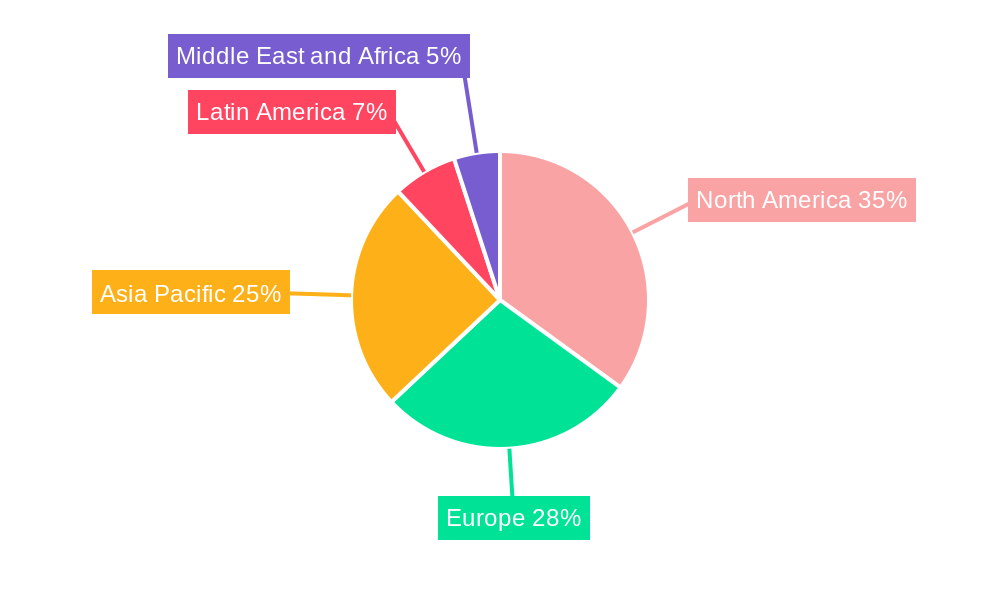
The Autonomous Beyond Visual Line of Sight (BVLOS) drone market is experiencing explosive growth, projected to reach a market size of $1.06 billion in 2025 and exhibiting a Compound Annual Growth Rate (CAGR) of 23.26% from 2025 to 2033. This significant expansion is fueled by several key drivers. Increased demand for efficient delivery solutions in e-commerce and logistics, coupled with the burgeoning need for advanced surveillance and monitoring in various sectors like agriculture, infrastructure inspection, and security, are propelling market adoption. Technological advancements, including improved sensor technology, enhanced AI-powered navigation systems, and more reliable communication networks, are further accelerating growth. Government regulations are also evolving to support the safe and responsible integration of BVLOS drones, facilitating market expansion. The market segmentation reveals substantial opportunities across different UAV sizes (small, medium, large) and applications (military, civil & commercial), with the commercial sector demonstrating particularly strong growth potential due to the cost-effectiveness and efficiency gains offered by autonomous drone operations. The geographic distribution reveals strong growth in North America and Europe, reflecting established technological infrastructure and regulatory frameworks. However, the Asia-Pacific region is anticipated to experience rapid growth due to increasing infrastructure development and a large potential user base.
Autonomous BVLOS Drone Industry Market Size (In Billion)
The competitive landscape is dynamic, with established players like Boeing, Airbus, and Textron alongside innovative startups like Zipline and Wingcopter vying for market share. Strategic partnerships and mergers & acquisitions are likely to reshape the competitive landscape in the coming years. While regulatory hurdles and concerns about cybersecurity and data privacy remain potential restraints, ongoing technological advancements and the substantial economic benefits associated with BVLOS drone deployment are expected to outweigh these challenges. The long-term forecast suggests continued robust growth, driven by increasing technological sophistication, expanding applications, and supportive regulatory environments globally. The market is poised to become a significant contributor to various industries, transforming logistics, infrastructure management, and surveillance practices significantly.
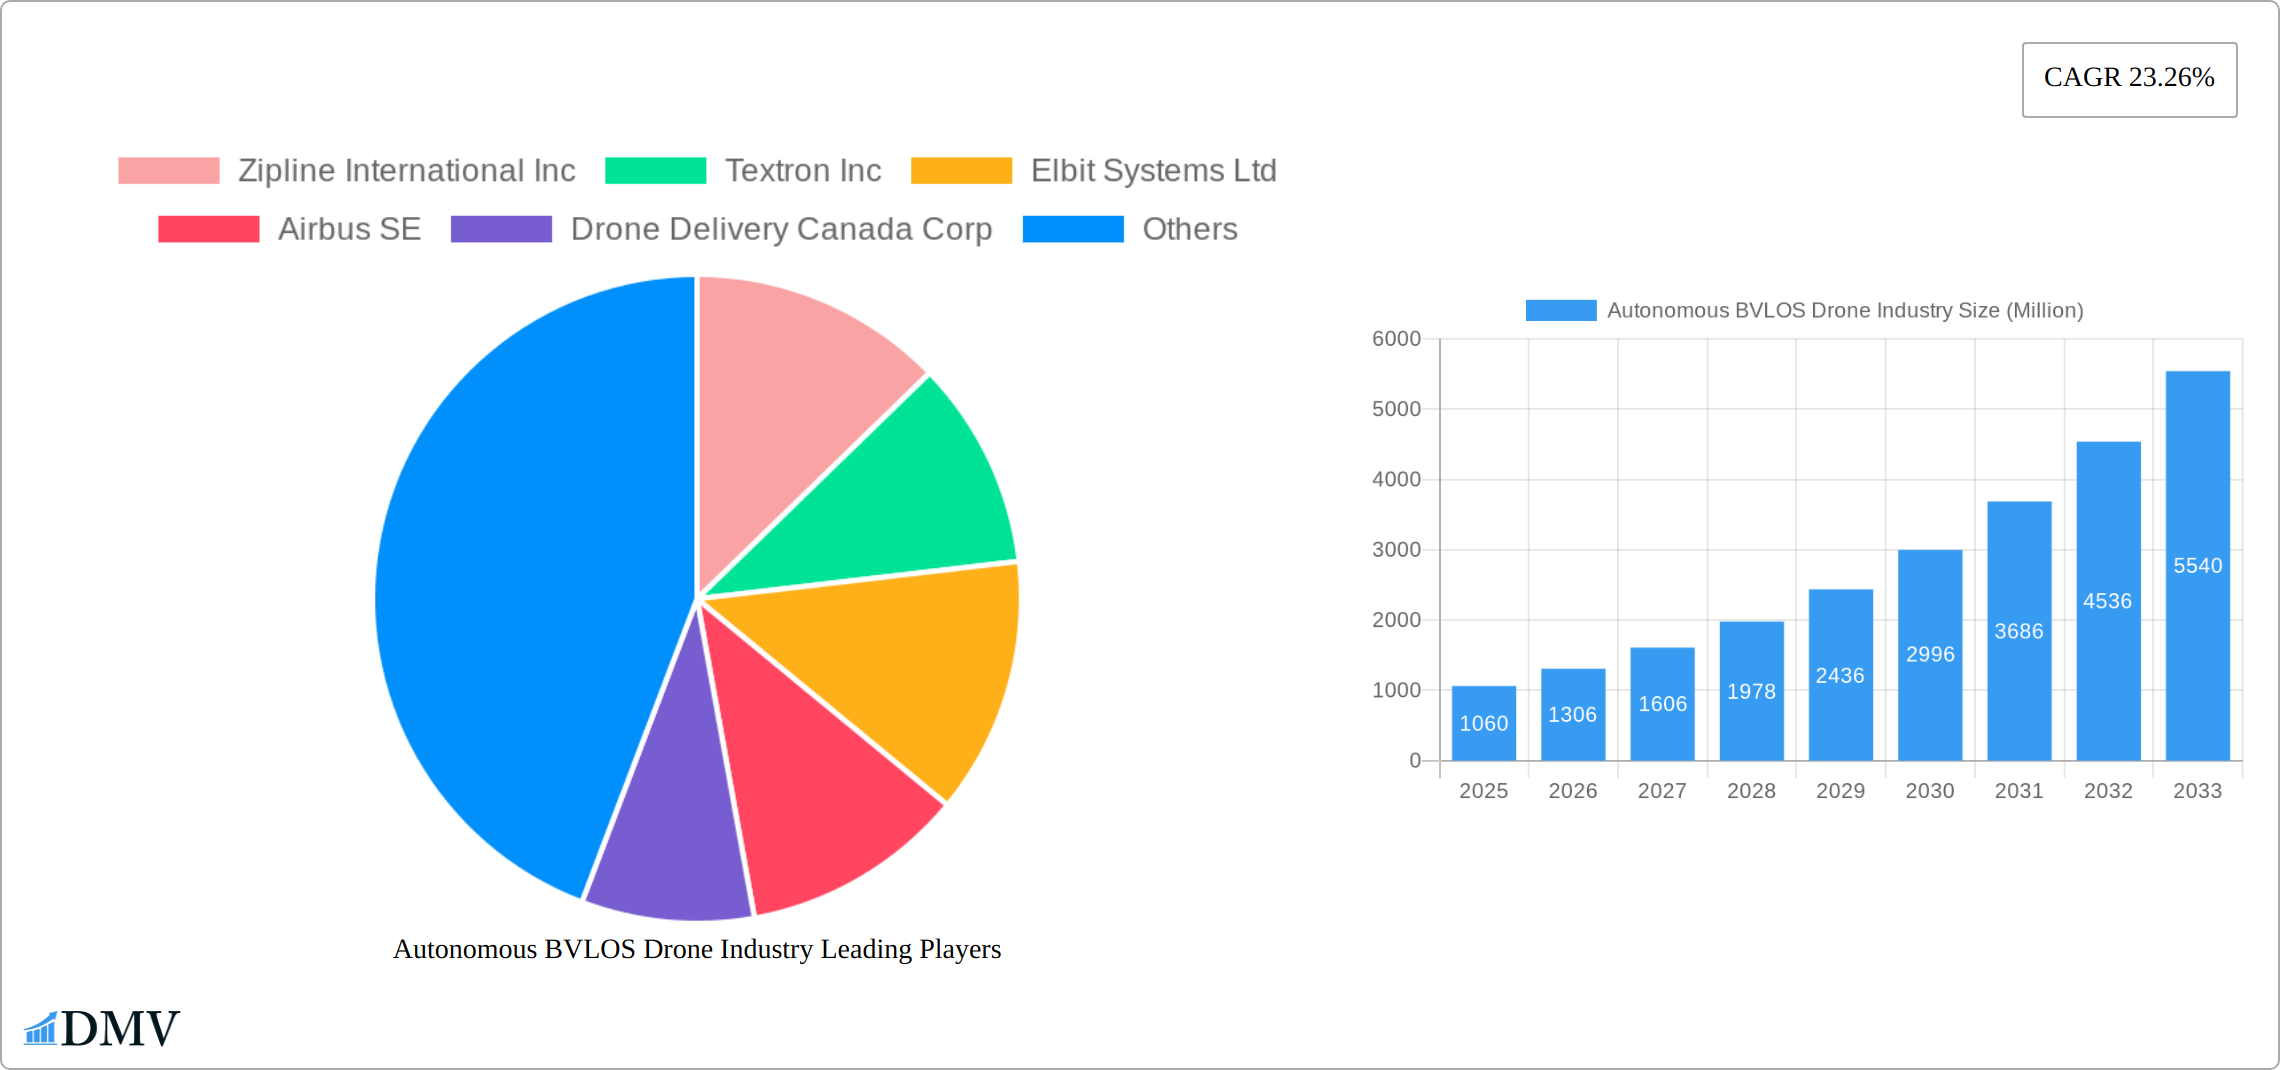
Autonomous BVLOS Drone Industry Company Market Share
Autonomous BVLOS Drone Industry Market Composition & Trends
The Autonomous BVLOS Drone Industry, valued at USD xx Million in 2025, exhibits a dynamic market composition influenced by several key trends. Market concentration is moderate, with the top players such as Zipline International Inc, Textron Inc, and Elbit Systems Ltd holding around 40% of the market share. Innovation catalysts include advancements in AI and sensor technologies, enabling more autonomous and efficient operations. The regulatory landscape is evolving, with countries like the U.S. and EU member states introducing BVLOS-specific regulations, fostering market growth. Substitute products such as manned aerial vehicles and ground delivery systems pose challenges, yet drones offer unique advantages in terms of cost and speed.
End-user profiles range from military applications, which dominate with a 60% share, to rapidly growing civil and commercial sectors, particularly in logistics and healthcare. Mergers and acquisitions are pivotal, with recent deals valued at over USD 500 Million, indicating strategic consolidations to enhance technology portfolios and market reach. Key M&A activities include Textron's acquisition of Pipistrel for USD 220 Million in 2022, aimed at bolstering their electric propulsion capabilities.
- Market Share Distribution: Top three companies hold 40%.
- M&A Deal Value: Over USD 500 Million in recent deals.
- Regulatory Landscape: Evolving BVLOS regulations in U.S. and EU.
- End-User Profiles: Military (60%), Civil & Commercial (40%).
Autonomous BVLOS Drone Industry Industry Evolution
The Autonomous BVLOS Drone Industry has experienced a dynamic evolution, poised for substantial growth from 2019 to 2033, with an anticipated Compound Annual Growth Rate (CAGR) of 15% during the 2025-2033 forecast period. This upward trajectory is underpinned by continuous technological breakthroughs. The integration of sophisticated technologies such as LiDAR, advanced AI-powered computer vision, and enhanced sensor suites has dramatically improved drone capabilities in autonomous navigation, real-time environmental perception, and high-fidelity data collection. These advancements have directly translated into a notable 25% surge in adoption rates within the military sector. Here, BVLOS drones are increasingly indispensable for critical surveillance, reconnaissance, intelligence gathering, and precision combat operations, offering a significant tactical advantage.
In the burgeoning civil and commercial sectors, the demand for BVLOS drones has witnessed an unprecedented surge, primarily driven by the transformative potential in logistics and delivery services. Industry giants like Amazon, UPS, and FedEx are making substantial investments in developing and deploying advanced drone delivery networks, aiming to revolutionize last-mile logistics. This segment experienced a remarkable 30% market growth between 2020 and 2024, largely fueled by escalating consumer expectations for expedited delivery solutions. Furthermore, the healthcare industry has seen a significant 20% increase in drone utilization for the critical transport of medical supplies, pharmaceuticals, and emergency aid, particularly to remote or hard-to-reach geographical areas, thereby enhancing healthcare accessibility and responsiveness.
The overarching shift in consumer and industry demands towards more sustainable, eco-friendly, and cost-effective solutions has also been a significant propellant for the market. The adoption of electric drones, offering reduced emissions and lower operational costs, has grown by an impressive 18% annually, reflecting a growing global commitment to environmental stewardship. Concurrently, the widespread integration of 5G technology is set to revolutionize drone operations, enabling ultra-reliable, low-latency, real-time data transmission and enhanced command-and-control connectivity. This technological synergy is expected to boost overall market growth by an additional 10% by 2030, unlocking new operational paradigms and use cases.
Leading Regions, Countries, or Segments in Autonomous BVLOS Drone Industry
The North American region, with the United States at its forefront, continues to assert its dominance in the Autonomous BVLOS Drone Industry, commanding an estimated 35% of the global market share. This leadership is a direct consequence of substantial, sustained investments in defense modernization, cutting-edge research and development, and the establishment of a robust and progressive regulatory framework that actively supports and facilitates BVLOS operations. Key contributing factors to this regional advantage include:
- Investment Trends: An annual investment exceeding USD 1 Billion into drone technology research, development, and deployment across various sectors.
- Regulatory Support: Proactive initiatives from aviation authorities such as the FAA, including the issuance of BVLOS waivers and the ongoing refinement of Part 107 regulations, creating a favorable operational environment.
In-depth market analysis further reveals that the U.S. market benefits immensely from the strong presence and pioneering efforts of leading companies like General Atomics Aeronautical Systems, Inc., and AeroVironment Inc., which are at the vanguard of military-grade drone technology. The nation's unwavering focus on fostering technological innovation, coupled with significant defense spending—representing approximately 3.4% of its GDP—further solidifies its preeminent position in the global landscape.
Within the segment analysis, Small Unmanned Aerial Vehicles (UAVs) emerge as the most dominant category, capturing approximately 50% of the market. This prevalence is attributed to their inherent versatility, agility, and cost-effectiveness, making them suitable for a wide array of military and civil applications. A notable trend is the observed 20% annual growth rate in the civil sector for small UAVs, driven by escalating demand in logistics, last-mile delivery, and detailed infrastructure inspection and surveillance needs.
- Dominant Segment: Small UAVs, representing a significant 50% market share due to their widespread applicability.
- Key Application Distribution: Military applications currently account for approximately 60% of usage, while Civil & Commercial applications represent a rapidly expanding 40%.
While the military segment continues to be the largest, holding a substantial 60% market share, primarily driven by the persistent high demand for advanced surveillance, reconnaissance, and tactical combat drones, the civil and commercial segment is exhibiting a much faster growth trajectory. This segment is projected to achieve a CAGR of 18% from 2025 to 2033, propelled by the expanding use cases in efficient delivery services, critical infrastructure inspection and maintenance, precision agriculture, and public safety operations.
Autonomous BVLOS Drone Industry Product Innovations
Product innovations within the Autonomous BVLOS Drone Industry are predominantly focused on pushing the boundaries of autonomy, enhancing operational intelligence, and maximizing overall efficiency. Recent groundbreaking advancements include the development of drones equipped with highly sophisticated, AI-driven obstacle avoidance systems, enabling them to navigate complex and dynamic environments with unprecedented safety and precision. These innovations have demonstrably led to a significant reduction in operational costs by up to 15% and a concurrent increase in mission success rates by an impressive 20%. The integration of advanced hybrid propulsion systems, which intelligently combine the benefits of electric power for quieter, more efficient flight with traditional internal combustion engines for extended range and higher payload capacities, is making drones significantly more versatile and capable for a broader spectrum of demanding military and commercial applications. Furthermore, the development of modular payload systems and enhanced communication suites are providing greater flexibility and mission adaptability.
Propelling Factors for Autonomous BVLOS Drone Industry Growth
Several key factors are driving the growth of the Autonomous BVLOS Drone Industry. Technologically, the integration of AI and machine learning has enabled drones to perform more complex tasks autonomously, increasing their utility in various sectors. Economically, the cost-effectiveness of drone operations compared to traditional methods is a significant driver, with companies like Amazon exploring drone delivery to reduce logistics costs by up to 30%. Regulatory influences, such as the FAA's BVLOS waivers, are also crucial, as they facilitate the legal operation of drones in more diverse scenarios, thereby expanding market opportunities.
Obstacles in the Autonomous BVLOS Drone Industry Market
Despite its promising outlook, the Autonomous BVLOS Drone Industry faces a series of significant obstacles that could potentially impede its accelerated growth and widespread adoption. Foremost among these are regulatory challenges; in many jurisdictions, stringent and evolving aviation laws can significantly delay market entry, necessitate extensive and costly compliance procedures, and increase overall operational expenditures by up to 20%. Supply chain vulnerabilities, starkly highlighted by recent global events such as pandemics and geopolitical instability, have led to substantial production delays, with some estimates suggesting an increase of up to 15% in lead times for critical components. The competitive landscape is intensely fierce, characterized by a constant influx of new market entrants and aggressive strategies from established players vying for market share. This often results in price wars that can unfortunately erode profit margins by as much as 10%, challenging the financial sustainability of some companies.
Future Opportunities in Autonomous BVLOS Drone Industry
Emerging opportunities in the Autonomous BVLOS Drone Industry include the expansion into new markets such as agriculture, where drones can be used for precision farming, potentially increasing crop yields by 10%. The advent of 5G technology offers new possibilities for real-time data transmission, enabling more sophisticated drone applications. Additionally, consumer trends towards sustainability are driving demand for electric drones, which could see a market growth of 20% by 2030, as they offer a greener alternative to traditional delivery methods.
Major Players in the Autonomous BVLOS Drone Industry Ecosystem
Key Developments in Autonomous BVLOS Drone Industry Industry
- January 2022: Textron Inc acquires Pipistrel for USD 220 Million, enhancing electric propulsion capabilities.
- March 2023: Zipline International Inc launches new autonomous delivery drone, increasing delivery efficiency by 30%.
- June 2023: EHang Holdings Limited receives BVLOS certification from the Civil Aviation Administration of China, expanding market reach.
- September 2023: Airbus SE partners with Wingcopter GmbH to develop hybrid propulsion systems for BVLOS drones, aiming to increase flight range by 50%.
Strategic Autonomous BVLOS Drone Industry Market Forecast
The Autonomous BVLOS Drone Industry is strategically positioned for robust and sustained growth, with a projected Compound Annual Growth Rate (CAGR) of 15% anticipated between 2025 and 2033. Key growth catalysts fueling this expansion include continued rapid advancements in artificial intelligence (AI) algorithms, sensor fusion technologies, and onboard processing capabilities, which will perpetually enhance drone autonomy, predictive maintenance, and operational efficiency. The proactive expansion into emerging markets such as precision agriculture, advanced infrastructure inspection and monitoring, environmental surveying, and urban air mobility presents substantial new revenue opportunities, potentially increasing the overall market size by an estimated 20% by 2030. Crucially, evolving regulatory landscapes and the proactive adoption of BVLOS-friendly policies across major economies will play a pivotal role in further facilitating market expansion, enabling drones to operate with greater freedom in more diverse, complex, and challenging environments, thereby unlocking their full potential.
Autonomous BVLOS Drone Industry Segmentation
-
1. Type
- 1.1. Small UAVs
- 1.2. Medium UAVs
- 1.3. Large UAVs
-
2. Application
- 2.1. Military
- 2.2. Civil & Commercial
Autonomous BVLOS Drone Industry Segmentation By Geography
-
1. North America
- 1.1. United States
- 1.2. Canada
-
2. Europe
- 2.1. United Kingdom
- 2.2. Germany
- 2.3. France
- 2.4. Rest of Europe
-
3. Asia Pacific
- 3.1. China
- 3.2. Japan
- 3.3. India
- 3.4. Rest of Asia Pacific
-
4. Latin America
- 4.1. Brazil
- 4.2. Mexico
- 4.3. Rest of Latin America
-
5. Middle East and Africa
- 5.1. United Arab Emirates
- 5.2. Saudi Arabia
- 5.3. Qatar
- 5.4. Rest of Middle East and Africa
Autonomous BVLOS Drone Industry Regional Market Share
Geographic Coverage of Autonomous BVLOS Drone Industry
Autonomous BVLOS Drone Industry REPORT HIGHLIGHTS
| Aspects | Details |
|---|---|
| Study Period | 2020-2034 |
| Base Year | 2025 |
| Estimated Year | 2026 |
| Forecast Period | 2026-2034 |
| Historical Period | 2020-2025 |
| Growth Rate | CAGR of 23.26% from 2020-2034 |
| Segmentation |
|
Table of Contents
- 1. Introduction
- 1.1. Research Scope
- 1.2. Market Segmentation
- 1.3. Research Objective
- 1.4. Definitions and Assumptions
- 2. Executive Summary
- 2.1. Market Snapshot
- 3. Market Dynamics
- 3.1. Market Drivers
- 3.2. Market Restrains
- 3.3. Market Trends
- 3.4. Market Opportunities
- 4. Market Factor Analysis
- 4.1. Porters Five Forces
- 4.1.1. Bargaining Power of Suppliers
- 4.1.2. Bargaining Power of Buyers
- 4.1.3. Threat of New Entrants
- 4.1.4. Threat of Substitutes
- 4.1.5. Competitive Rivalry
- 4.2. PESTEL analysis
- 4.3. BCG Analysis
- 4.3.1. Stars (High Growth, High Market Share)
- 4.3.2. Cash Cows (Low Growth, High Market Share)
- 4.3.3. Question Mark (High Growth, Low Market Share)
- 4.3.4. Dogs (Low Growth, Low Market Share)
- 4.4. Ansoff Matrix Analysis
- 4.5. Supply Chain Analysis
- 4.6. Regulatory Landscape
- 4.7. Current Market Potential and Opportunity Assessment (TAM–SAM–SOM Framework)
- 4.8. DMV Analyst Note
- 4.1. Porters Five Forces
- 5. Market Analysis, Insights and Forecast 2021-2033
- 5.1. Market Analysis, Insights and Forecast - by Type
- 5.1.1. Small UAVs
- 5.1.2. Medium UAVs
- 5.1.3. Large UAVs
- 5.2. Market Analysis, Insights and Forecast - by Application
- 5.2.1. Military
- 5.2.2. Civil & Commercial
- 5.3. Market Analysis, Insights and Forecast - by Region
- 5.3.1. North America
- 5.3.2. Europe
- 5.3.3. Asia Pacific
- 5.3.4. Latin America
- 5.3.5. Middle East and Africa
- 5.1. Market Analysis, Insights and Forecast - by Type
- 6. Global Autonomous BVLOS Drone Industry Analysis, Insights and Forecast, 2021-2033
- 6.1. Market Analysis, Insights and Forecast - by Type
- 6.1.1. Small UAVs
- 6.1.2. Medium UAVs
- 6.1.3. Large UAVs
- 6.2. Market Analysis, Insights and Forecast - by Application
- 6.2.1. Military
- 6.2.2. Civil & Commercial
- 6.1. Market Analysis, Insights and Forecast - by Type
- 7. North America Autonomous BVLOS Drone Industry Analysis, Insights and Forecast, 2020-2032
- 7.1. Market Analysis, Insights and Forecast - by Type
- 7.1.1. Small UAVs
- 7.1.2. Medium UAVs
- 7.1.3. Large UAVs
- 7.2. Market Analysis, Insights and Forecast - by Application
- 7.2.1. Military
- 7.2.2. Civil & Commercial
- 7.1. Market Analysis, Insights and Forecast - by Type
- 8. Europe Autonomous BVLOS Drone Industry Analysis, Insights and Forecast, 2020-2032
- 8.1. Market Analysis, Insights and Forecast - by Type
- 8.1.1. Small UAVs
- 8.1.2. Medium UAVs
- 8.1.3. Large UAVs
- 8.2. Market Analysis, Insights and Forecast - by Application
- 8.2.1. Military
- 8.2.2. Civil & Commercial
- 8.1. Market Analysis, Insights and Forecast - by Type
- 9. Asia Pacific Autonomous BVLOS Drone Industry Analysis, Insights and Forecast, 2020-2032
- 9.1. Market Analysis, Insights and Forecast - by Type
- 9.1.1. Small UAVs
- 9.1.2. Medium UAVs
- 9.1.3. Large UAVs
- 9.2. Market Analysis, Insights and Forecast - by Application
- 9.2.1. Military
- 9.2.2. Civil & Commercial
- 9.1. Market Analysis, Insights and Forecast - by Type
- 10. Latin America Autonomous BVLOS Drone Industry Analysis, Insights and Forecast, 2020-2032
- 10.1. Market Analysis, Insights and Forecast - by Type
- 10.1.1. Small UAVs
- 10.1.2. Medium UAVs
- 10.1.3. Large UAVs
- 10.2. Market Analysis, Insights and Forecast - by Application
- 10.2.1. Military
- 10.2.2. Civil & Commercial
- 10.1. Market Analysis, Insights and Forecast - by Type
- 11. Middle East and Africa Autonomous BVLOS Drone Industry Analysis, Insights and Forecast, 2020-2032
- 11.1. Market Analysis, Insights and Forecast - by Type
- 11.1.1. Small UAVs
- 11.1.2. Medium UAVs
- 11.1.3. Large UAVs
- 11.2. Market Analysis, Insights and Forecast - by Application
- 11.2.1. Military
- 11.2.2. Civil & Commercial
- 11.1. Market Analysis, Insights and Forecast - by Type
- 12. Competitive Analysis
- 12.1. Company Profiles
- 12.1.1 Zipline International Inc
- 12.1.1.1. Company Overview
- 12.1.1.2. Products
- 12.1.1.3. Company Financials
- 12.1.1.4. SWOT Analysis
- 12.1.2 Textron Inc
- 12.1.2.1. Company Overview
- 12.1.2.2. Products
- 12.1.2.3. Company Financials
- 12.1.2.4. SWOT Analysis
- 12.1.3 Elbit Systems Ltd
- 12.1.3.1. Company Overview
- 12.1.3.2. Products
- 12.1.3.3. Company Financials
- 12.1.3.4. SWOT Analysis
- 12.1.4 Airbus SE
- 12.1.4.1. Company Overview
- 12.1.4.2. Products
- 12.1.4.3. Company Financials
- 12.1.4.4. SWOT Analysis
- 12.1.5 Drone Delivery Canada Corp
- 12.1.5.1. Company Overview
- 12.1.5.2. Products
- 12.1.5.3. Company Financials
- 12.1.5.4. SWOT Analysis
- 12.1.6 General Atomics
- 12.1.6.1. Company Overview
- 12.1.6.2. Products
- 12.1.6.3. Company Financials
- 12.1.6.4. SWOT Analysis
- 12.1.7 AeroVironment Inc
- 12.1.7.1. Company Overview
- 12.1.7.2. Products
- 12.1.7.3. Company Financials
- 12.1.7.4. SWOT Analysis
- 12.1.8 IAI
- 12.1.8.1. Company Overview
- 12.1.8.2. Products
- 12.1.8.3. Company Financials
- 12.1.8.4. SWOT Analysis
- 12.1.9 EHang Holdings Limited
- 12.1.9.1. Company Overview
- 12.1.9.2. Products
- 12.1.9.3. Company Financials
- 12.1.9.4. SWOT Analysis
- 12.1.10 Wingcopter Gmb
- 12.1.10.1. Company Overview
- 12.1.10.2. Products
- 12.1.10.3. Company Financials
- 12.1.10.4. SWOT Analysis
- 12.1.11 DELAIR SAS
- 12.1.11.1. Company Overview
- 12.1.11.2. Products
- 12.1.11.3. Company Financials
- 12.1.11.4. SWOT Analysis
- 12.1.12 Northrop Grumman Corporation
- 12.1.12.1. Company Overview
- 12.1.12.2. Products
- 12.1.12.3. Company Financials
- 12.1.12.4. SWOT Analysis
- 12.1.13 Saab AB
- 12.1.13.1. Company Overview
- 12.1.13.2. Products
- 12.1.13.3. Company Financials
- 12.1.13.4. SWOT Analysis
- 12.1.14 Plymouth Rock Technologies Inc
- 12.1.14.1. Company Overview
- 12.1.14.2. Products
- 12.1.14.3. Company Financials
- 12.1.14.4. SWOT Analysis
- 12.1.15 The Boeing Company
- 12.1.15.1. Company Overview
- 12.1.15.2. Products
- 12.1.15.3. Company Financials
- 12.1.15.4. SWOT Analysis
- 12.1.1 Zipline International Inc
- 12.2. Market Entropy
- 12.2.1 Company's Key Areas Served
- 12.2.2 Recent Developments
- 12.3. Company Market Share Analysis 2025
- 12.3.1 Top 5 Companies Market Share Analysis
- 12.3.2 Top 3 Companies Market Share Analysis
- 12.4. List of Potential Customers
- 13. Research Methodology
List of Figures
- Figure 1: Global Autonomous BVLOS Drone Industry Revenue Breakdown (Million, %) by Region 2025 & 2033
- Figure 2: North America Autonomous BVLOS Drone Industry Revenue (Million), by Type 2025 & 2033
- Figure 3: North America Autonomous BVLOS Drone Industry Revenue Share (%), by Type 2025 & 2033
- Figure 4: North America Autonomous BVLOS Drone Industry Revenue (Million), by Application 2025 & 2033
- Figure 5: North America Autonomous BVLOS Drone Industry Revenue Share (%), by Application 2025 & 2033
- Figure 6: North America Autonomous BVLOS Drone Industry Revenue (Million), by Country 2025 & 2033
- Figure 7: North America Autonomous BVLOS Drone Industry Revenue Share (%), by Country 2025 & 2033
- Figure 8: Europe Autonomous BVLOS Drone Industry Revenue (Million), by Type 2025 & 2033
- Figure 9: Europe Autonomous BVLOS Drone Industry Revenue Share (%), by Type 2025 & 2033
- Figure 10: Europe Autonomous BVLOS Drone Industry Revenue (Million), by Application 2025 & 2033
- Figure 11: Europe Autonomous BVLOS Drone Industry Revenue Share (%), by Application 2025 & 2033
- Figure 12: Europe Autonomous BVLOS Drone Industry Revenue (Million), by Country 2025 & 2033
- Figure 13: Europe Autonomous BVLOS Drone Industry Revenue Share (%), by Country 2025 & 2033
- Figure 14: Asia Pacific Autonomous BVLOS Drone Industry Revenue (Million), by Type 2025 & 2033
- Figure 15: Asia Pacific Autonomous BVLOS Drone Industry Revenue Share (%), by Type 2025 & 2033
- Figure 16: Asia Pacific Autonomous BVLOS Drone Industry Revenue (Million), by Application 2025 & 2033
- Figure 17: Asia Pacific Autonomous BVLOS Drone Industry Revenue Share (%), by Application 2025 & 2033
- Figure 18: Asia Pacific Autonomous BVLOS Drone Industry Revenue (Million), by Country 2025 & 2033
- Figure 19: Asia Pacific Autonomous BVLOS Drone Industry Revenue Share (%), by Country 2025 & 2033
- Figure 20: Latin America Autonomous BVLOS Drone Industry Revenue (Million), by Type 2025 & 2033
- Figure 21: Latin America Autonomous BVLOS Drone Industry Revenue Share (%), by Type 2025 & 2033
- Figure 22: Latin America Autonomous BVLOS Drone Industry Revenue (Million), by Application 2025 & 2033
- Figure 23: Latin America Autonomous BVLOS Drone Industry Revenue Share (%), by Application 2025 & 2033
- Figure 24: Latin America Autonomous BVLOS Drone Industry Revenue (Million), by Country 2025 & 2033
- Figure 25: Latin America Autonomous BVLOS Drone Industry Revenue Share (%), by Country 2025 & 2033
- Figure 26: Middle East and Africa Autonomous BVLOS Drone Industry Revenue (Million), by Type 2025 & 2033
- Figure 27: Middle East and Africa Autonomous BVLOS Drone Industry Revenue Share (%), by Type 2025 & 2033
- Figure 28: Middle East and Africa Autonomous BVLOS Drone Industry Revenue (Million), by Application 2025 & 2033
- Figure 29: Middle East and Africa Autonomous BVLOS Drone Industry Revenue Share (%), by Application 2025 & 2033
- Figure 30: Middle East and Africa Autonomous BVLOS Drone Industry Revenue (Million), by Country 2025 & 2033
- Figure 31: Middle East and Africa Autonomous BVLOS Drone Industry Revenue Share (%), by Country 2025 & 2033
List of Tables
- Table 1: Global Autonomous BVLOS Drone Industry Revenue Million Forecast, by Type 2020 & 2033
- Table 2: Global Autonomous BVLOS Drone Industry Revenue Million Forecast, by Application 2020 & 2033
- Table 3: Global Autonomous BVLOS Drone Industry Revenue Million Forecast, by Region 2020 & 2033
- Table 4: Global Autonomous BVLOS Drone Industry Revenue Million Forecast, by Type 2020 & 2033
- Table 5: Global Autonomous BVLOS Drone Industry Revenue Million Forecast, by Application 2020 & 2033
- Table 6: Global Autonomous BVLOS Drone Industry Revenue Million Forecast, by Country 2020 & 2033
- Table 7: United States Autonomous BVLOS Drone Industry Revenue (Million) Forecast, by Application 2020 & 2033
- Table 8: Canada Autonomous BVLOS Drone Industry Revenue (Million) Forecast, by Application 2020 & 2033
- Table 9: Global Autonomous BVLOS Drone Industry Revenue Million Forecast, by Type 2020 & 2033
- Table 10: Global Autonomous BVLOS Drone Industry Revenue Million Forecast, by Application 2020 & 2033
- Table 11: Global Autonomous BVLOS Drone Industry Revenue Million Forecast, by Country 2020 & 2033
- Table 12: United Kingdom Autonomous BVLOS Drone Industry Revenue (Million) Forecast, by Application 2020 & 2033
- Table 13: Germany Autonomous BVLOS Drone Industry Revenue (Million) Forecast, by Application 2020 & 2033
- Table 14: France Autonomous BVLOS Drone Industry Revenue (Million) Forecast, by Application 2020 & 2033
- Table 15: Rest of Europe Autonomous BVLOS Drone Industry Revenue (Million) Forecast, by Application 2020 & 2033
- Table 16: Global Autonomous BVLOS Drone Industry Revenue Million Forecast, by Type 2020 & 2033
- Table 17: Global Autonomous BVLOS Drone Industry Revenue Million Forecast, by Application 2020 & 2033
- Table 18: Global Autonomous BVLOS Drone Industry Revenue Million Forecast, by Country 2020 & 2033
- Table 19: China Autonomous BVLOS Drone Industry Revenue (Million) Forecast, by Application 2020 & 2033
- Table 20: Japan Autonomous BVLOS Drone Industry Revenue (Million) Forecast, by Application 2020 & 2033
- Table 21: India Autonomous BVLOS Drone Industry Revenue (Million) Forecast, by Application 2020 & 2033
- Table 22: Rest of Asia Pacific Autonomous BVLOS Drone Industry Revenue (Million) Forecast, by Application 2020 & 2033
- Table 23: Global Autonomous BVLOS Drone Industry Revenue Million Forecast, by Type 2020 & 2033
- Table 24: Global Autonomous BVLOS Drone Industry Revenue Million Forecast, by Application 2020 & 2033
- Table 25: Global Autonomous BVLOS Drone Industry Revenue Million Forecast, by Country 2020 & 2033
- Table 26: Brazil Autonomous BVLOS Drone Industry Revenue (Million) Forecast, by Application 2020 & 2033
- Table 27: Mexico Autonomous BVLOS Drone Industry Revenue (Million) Forecast, by Application 2020 & 2033
- Table 28: Rest of Latin America Autonomous BVLOS Drone Industry Revenue (Million) Forecast, by Application 2020 & 2033
- Table 29: Global Autonomous BVLOS Drone Industry Revenue Million Forecast, by Type 2020 & 2033
- Table 30: Global Autonomous BVLOS Drone Industry Revenue Million Forecast, by Application 2020 & 2033
- Table 31: Global Autonomous BVLOS Drone Industry Revenue Million Forecast, by Country 2020 & 2033
- Table 32: United Arab Emirates Autonomous BVLOS Drone Industry Revenue (Million) Forecast, by Application 2020 & 2033
- Table 33: Saudi Arabia Autonomous BVLOS Drone Industry Revenue (Million) Forecast, by Application 2020 & 2033
- Table 34: Qatar Autonomous BVLOS Drone Industry Revenue (Million) Forecast, by Application 2020 & 2033
- Table 35: Rest of Middle East and Africa Autonomous BVLOS Drone Industry Revenue (Million) Forecast, by Application 2020 & 2033
Frequently Asked Questions
1. What is the projected Compound Annual Growth Rate (CAGR) of the Autonomous BVLOS Drone Industry?
The projected CAGR is approximately 23.26%.
2. Which companies are prominent players in the Autonomous BVLOS Drone Industry?
Key companies in the market include Zipline International Inc, Textron Inc, Elbit Systems Ltd, Airbus SE, Drone Delivery Canada Corp, General Atomics, AeroVironment Inc, IAI, EHang Holdings Limited, Wingcopter Gmb, DELAIR SAS, Northrop Grumman Corporation, Saab AB, Plymouth Rock Technologies Inc, The Boeing Company.
3. What are the main segments of the Autonomous BVLOS Drone Industry?
The market segments include Type, Application.
4. Can you provide details about the market size?
The market size is estimated to be USD 1.06 Million as of 2022.
5. What are some drivers contributing to market growth?
N/A
6. What are the notable trends driving market growth?
Military Segment is Anticipated to Grow with the Highest CAGR During the Forecast Period.
7. Are there any restraints impacting market growth?
N/A
8. Can you provide examples of recent developments in the market?
N/A
9. What pricing options are available for accessing the report?
Pricing options include single-user, multi-user, and enterprise licenses priced at USD 4750, USD 5250, and USD 8750 respectively.
10. Is the market size provided in terms of value or volume?
The market size is provided in terms of value, measured in Million.
11. Are there any specific market keywords associated with the report?
Yes, the market keyword associated with the report is "Autonomous BVLOS Drone Industry," which aids in identifying and referencing the specific market segment covered.
12. How do I determine which pricing option suits my needs best?
The pricing options vary based on user requirements and access needs. Individual users may opt for single-user licenses, while businesses requiring broader access may choose multi-user or enterprise licenses for cost-effective access to the report.
13. Are there any additional resources or data provided in the Autonomous BVLOS Drone Industry report?
While the report offers comprehensive insights, it's advisable to review the specific contents or supplementary materials provided to ascertain if additional resources or data are available.
14. How can I stay updated on further developments or reports in the Autonomous BVLOS Drone Industry?
To stay informed about further developments, trends, and reports in the Autonomous BVLOS Drone Industry, consider subscribing to industry newsletters, following relevant companies and organizations, or regularly checking reputable industry news sources and publications.
Methodology
Step 1 - Identification of Relevant Samples Size from Population Database


Step 2 - Approaches for Defining Global Market Size (Value, Volume* & Price*)

Note*: In applicable scenarios
Step 3 - Data Sources
Primary Research
- Web Analytics
- Survey Reports
- Research Institute
- Latest Research Reports
- Opinion Leaders
Secondary Research
- Annual Reports
- White Paper
- Latest Press Release
- Industry Association
- Paid Database
- Investor Presentations

Step 4 - Data Triangulation
Involves using different sources of information in order to increase the validity of a study
These sources are likely to be stakeholders in a program - participants, other researchers, program staff, other community members, and so on.
Then we put all data in single framework & apply various statistical tools to find out the dynamic on the market.
During the analysis stage, feedback from the stakeholder groups would be compared to determine areas of agreement as well as areas of divergence