

Key Insights
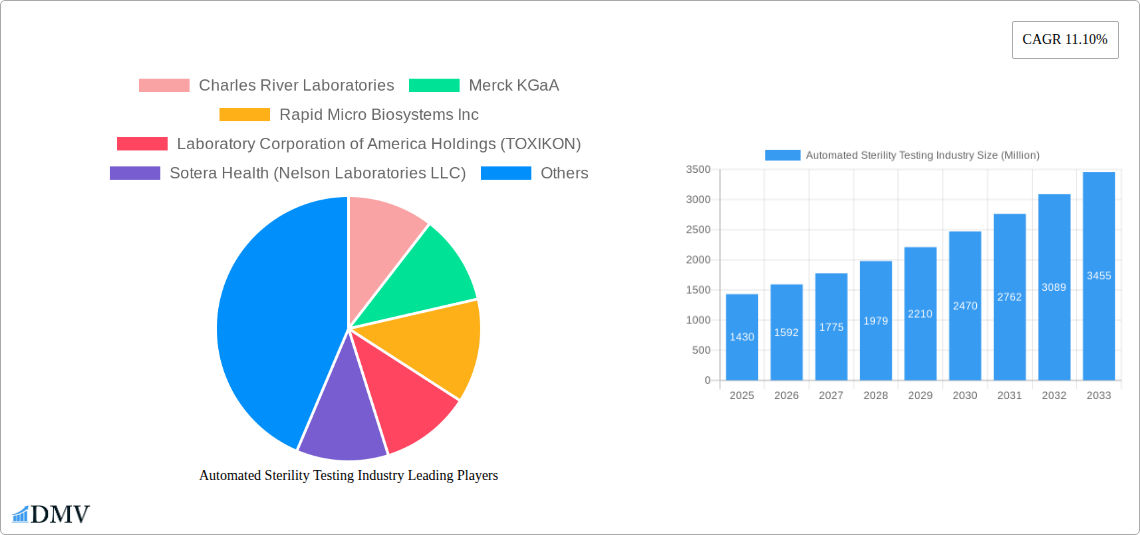
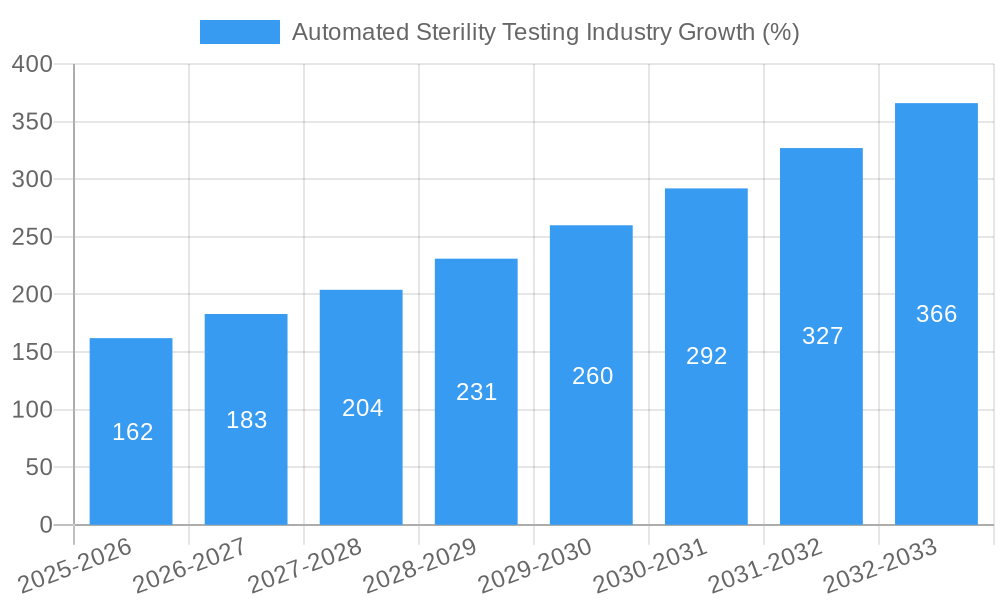
The automated sterility testing market, valued at $1.43 billion in 2025, is experiencing robust growth, projected to expand at a compound annual growth rate (CAGR) of 11.10% from 2025 to 2033. This expansion is driven by several key factors. Stringent regulatory requirements for pharmaceutical and medical device sterility are compelling manufacturers to adopt automated systems for improved accuracy, efficiency, and reduced human error. The increasing prevalence of contamination incidents and associated recalls further necessitates the adoption of advanced testing methodologies. Simultaneously, the rising demand for faster turnaround times and the need for high-throughput testing in the face of increasing production volumes are propelling market growth. Furthermore, continuous advancements in technology, including the development of more sophisticated instruments and automated software solutions, are enhancing the capabilities and appeal of automated sterility testing systems.
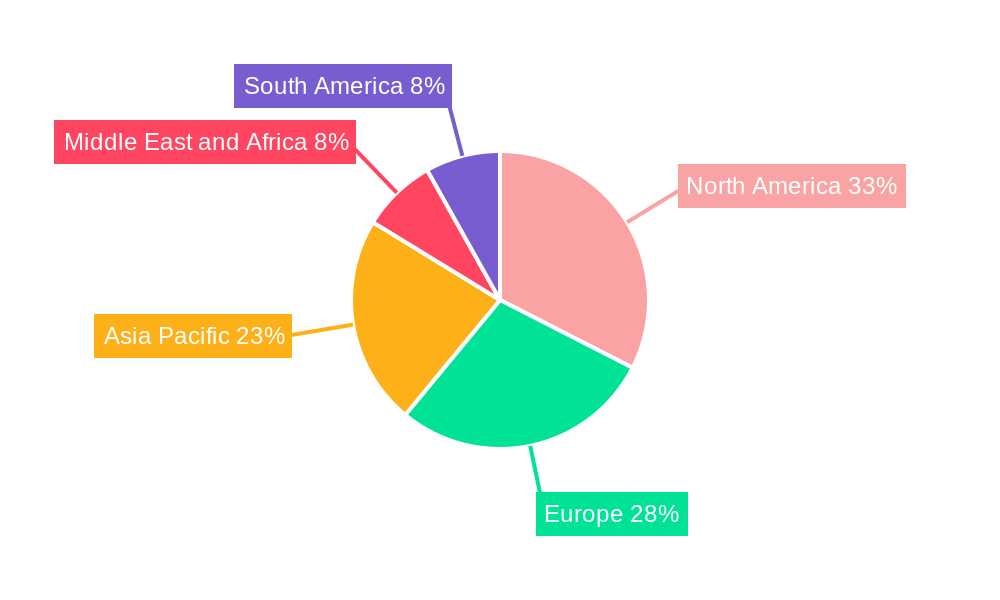
The market is segmented by test type (membrane filtration, direct inoculation, other sterility tests), application (pharmaceutical and biological manufacturing, medical device manufacturing, other applications), and product type (instruments, kits and reagents, services). While membrane filtration currently holds a significant market share due to its established reliability, direct inoculation methods are gaining traction owing to their speed and efficiency. Pharmaceutical and biological manufacturing constitutes the largest application segment, reflecting the strict sterility standards mandated in this sector. The geographic distribution of the market is diverse, with North America and Europe holding substantial shares currently, while Asia-Pacific is expected to witness the most rapid growth in the coming years due to burgeoning pharmaceutical industries and increasing healthcare investments in the region. Key players like Charles River Laboratories, Merck KGaA, and Sartorius AG are driving innovation and market competition through strategic partnerships, product development, and acquisitions, consolidating their positions within this lucrative market.
Automated Sterility Testing Industry Market Report: 2019-2033
This comprehensive report provides a detailed analysis of the Automated Sterility Testing industry, encompassing market size, growth trends, competitive landscape, and future projections from 2019 to 2033. The report delves into key segments, technological advancements, and regulatory influences shaping this crucial sector within pharmaceutical and medical device manufacturing. With a focus on data-driven insights and actionable intelligence, this report is an essential resource for stakeholders seeking to understand and capitalize on the opportunities within the automated sterility testing market. The global market value is projected to reach $XX Million by 2033.
Automated Sterility Testing Industry Market Composition & Trends
The automated sterility testing market is characterized by a moderately consolidated landscape with key players holding significant market share. Charles River Laboratories, Merck KGaA, and Thermo Fisher Scientific are among the leading companies, collectively accounting for an estimated XX% of the market in 2025. The market's growth is fueled by stringent regulatory requirements for sterility assurance in pharmaceutical and medical device manufacturing, increasing demand for faster and more accurate testing methods, and the rising adoption of automation to enhance efficiency and reduce human error.
- Market Concentration: High, with top 5 players holding approximately XX% market share in 2025.
- Innovation Catalysts: Stringent regulatory compliance, rising demand for automation, advancements in rapid microbiology technologies.
- Regulatory Landscape: Stringent regulations (e.g., FDA, EMA) driving adoption of automated systems.
- Substitute Products: Manual sterility testing methods, but with limitations in speed and accuracy.
- End-User Profiles: Pharmaceutical and biopharmaceutical companies, medical device manufacturers, contract research organizations (CROs).
- M&A Activities: Significant M&A activity expected in the forecast period, driven by the need for expansion and technological advancements. Deal values are estimated to exceed $XX Million annually.
Automated Sterility Testing Industry Industry Evolution
The automated sterility testing industry has witnessed significant growth from 2019 to 2024, expanding at a CAGR of XX%. This growth is primarily driven by the increasing adoption of advanced technologies such as rapid microbial methods and automated systems for membrane filtration and direct inoculation tests. The shift toward automation is fueled by the need to improve throughput, reduce testing time, and enhance the accuracy and reliability of sterility testing results. The pharmaceutical and medical device industries are increasingly adopting these technologies to meet stringent regulatory compliance requirements and enhance product quality. The market is also seeing an increasing focus on integrated solutions that combine automated instruments with software and data analytics for improved decision-making and enhanced efficiency. This trend is further fueled by the development of new technologies such as artificial intelligence (AI) and machine learning (ML) for more precise and rapid sterility testing. We expect the CAGR to increase to XX% from 2025 to 2033 driven by increased adoption in emerging markets and continuous innovation in technologies and processes.
Leading Regions, Countries, or Segments in Automated Sterility Testing Industry
North America currently dominates the automated sterility testing market, driven by robust pharmaceutical and medical device industries, stringent regulatory frameworks, and high adoption rates of advanced technologies. Europe follows closely as a major market, while Asia-Pacific is experiencing rapid growth, fueled by expanding manufacturing capabilities and increasing healthcare spending.
By Test Type:
- Membrane Filtration: Largest segment due to its established use and suitability for a wide range of applications.
- Direct Inoculation: Growing segment with increasing adoption for specific applications.
- Other Sterility Tests: Smaller segment but experiencing growth due to innovations in rapid microbiology techniques.
By Application:
- Pharmaceutical and Biological Manufacturing: Largest application due to stringent regulatory requirements.
- Medical Device Manufacturing: Significant application segment with growing demand for sterile devices.
- Other Applications: Includes applications in food and beverage, cosmetics, and other industries.
By Product Type:
- Instruments: Largest segment, offering sophisticated automated systems for sterility testing.
- Kits and Reagents: Essential for performing tests and supporting instrumentation.
- Services: Growing segment, offering testing and validation services.
Key Drivers:
- High investments in R&D to develop advanced technologies.
- Favorable regulatory support promoting automation.
- Growing demand from pharmaceutical and medical device companies.
Automated Sterility Testing Industry Product Innovations
Recent product innovations include integrated automated systems combining sample preparation, inoculation, and incubation steps into a single platform, alongside rapid microbial methods that significantly reduce testing time. These advancements offer improved accuracy, efficiency, and reduced testing costs. Unique selling propositions focus on ease-of-use, improved data management, and reduced manual handling, minimizing the risk of contamination and enhancing overall productivity.
Propelling Factors for Automated Sterility Testing Industry Growth
The automated sterility testing market is experiencing robust growth propelled by several key factors:
- Stringent Regulatory Compliance: Regulations like those from the FDA and EMA mandate rigorous sterility testing, driving adoption of automated systems.
- Technological Advancements: Innovations in rapid microbiology and automation are improving testing speed and accuracy.
- Increasing Demand: The expanding pharmaceutical and medical device industries fuel the demand for accurate and efficient sterility testing.
- Cost Reduction: Automation leads to improved efficiency and reduced labor costs.
Obstacles in the Automated Sterility Testing Industry Market
The market faces challenges such as:
- High Initial Investment Costs: Implementing automated systems can be expensive for smaller companies.
- Regulatory Hurdles: Navigating complex regulatory processes for new technologies can be time-consuming.
- Maintenance and Servicing: Automated systems require skilled personnel for maintenance and servicing, increasing operational costs.
- Competitive Pressure: The market is relatively consolidated, leading to intense competition among key players.
Future Opportunities in Automated Sterility Testing Industry
Future opportunities lie in:
- Expansion into Emerging Markets: Growing healthcare infrastructure in developing countries will create demand.
- Development of Novel Technologies: AI and machine learning can further improve speed and accuracy.
- Integration of Data Analytics: Leveraging data analytics for improved decision-making and quality control.
- Expansion of Services: Offering comprehensive testing and validation services to clients.
Major Players in the Automated Sterility Testing Industry Ecosystem
- Charles River Laboratories
- Merck KGaA
- Rapid Micro Biosystems Inc
- Laboratory Corporation of America Holdings (TOXIKON)
- Sotera Health (Nelson Laboratories LLC)
- Sartorius AG
- SGS SA
- bioMerieux SA
- WuXi AppTec
- Pace Analytical
- Thermo Fisher Scientific
- STERIS
Key Developments in Automated Sterility Testing Industry Industry
- June 2022: STEMart launched comprehensive microbiology and sterility testing for sterile, non-pyrogenic medical devices, enhancing testing capabilities.
- June 2022: Berkshire Sterile Manufacturing opened a sterility testing isolator, improving onsite GMP batch testing capabilities and supporting the growth of sterile injectable medicine manufacturing.
Strategic Automated Sterility Testing Industry Market Forecast
The automated sterility testing market is poised for continued strong growth, driven by technological advancements, increasing regulatory pressures, and the expanding pharmaceutical and medical device sectors. The market is expected to witness significant growth, fueled by adoption of rapid methods and integrated solutions, leading to improved efficiency and higher accuracy in sterility assurance. Emerging markets present significant opportunities for expansion, while ongoing technological innovations will shape the future landscape of the industry.
Automated Sterility Testing Industry Segmentation
-
1. Product Type
- 1.1. Instruments
- 1.2. Kits and Reagents
- 1.3. Services
-
2. Test Type
- 2.1. Membrane Filtration
- 2.2. Direct Inoculation
- 2.3. Other Sterility Tests
-
3. Application
- 3.1. Pharmaceutical and Biological Manufacturing
- 3.2. Medical Device Manufacturing
- 3.3. Other Applications
Automated Sterility Testing Industry Segmentation By Geography
-
1. North America
- 1.1. United States
- 1.2. Canada
- 1.3. Mexico
-
2. Europe
- 2.1. Germany
- 2.2. United Kingdom
- 2.3. France
- 2.4. Italy
- 2.5. Spain
- 2.6. Rest of Europe
-
3. Asia Pacific
- 3.1. China
- 3.2. Japan
- 3.3. India
- 3.4. Australia
- 3.5. South Korea
- 3.6. Rest of Asia Pacific
-
4. Middle East and Africa
- 4.1. GCC
- 4.2. South Africa
- 4.3. Rest of Middle East and Africa
-
5. South America
- 5.1. Brazil
- 5.2. Argentina
- 5.3. Rest of South America
Automated Sterility Testing Industry REPORT HIGHLIGHTS
| Aspects | Details |
|---|---|
| Study Period | 2019-2033 |
| Base Year | 2024 |
| Estimated Year | 2025 |
| Forecast Period | 2025-2033 |
| Historical Period | 2019-2024 |
| Growth Rate | CAGR of 11.10% from 2019-2033 |
| Segmentation |
|
Table of Contents
- 1. Introduction
- 1.1. Research Scope
- 1.2. Market Segmentation
- 1.3. Research Methodology
- 1.4. Definitions and Assumptions
- 2. Executive Summary
- 2.1. Introduction
- 3. Market Dynamics
- 3.1. Introduction
- 3.2. Market Drivers
- 3.2.1. Increasing Research and Development in Life Sciences; Increasing Number of Drug Launches; Rise in Demand for Sterilized Products
- 3.3. Market Restrains
- 3.3.1. Stringent Regulatory Framework
- 3.4. Market Trends
- 3.4.1. Pharmaceutical and Biological Manufacturing Segment Expected to Grow Over the Forecast Period
- 4. Market Factor Analysis
- 4.1. Porters Five Forces
- 4.2. Supply/Value Chain
- 4.3. PESTEL analysis
- 4.4. Market Entropy
- 4.5. Patent/Trademark Analysis
- 5. Global Automated Sterility Testing Industry Analysis, Insights and Forecast, 2019-2031
- 5.1. Market Analysis, Insights and Forecast - by Product Type
- 5.1.1. Instruments
- 5.1.2. Kits and Reagents
- 5.1.3. Services
- 5.2. Market Analysis, Insights and Forecast - by Test Type
- 5.2.1. Membrane Filtration
- 5.2.2. Direct Inoculation
- 5.2.3. Other Sterility Tests
- 5.3. Market Analysis, Insights and Forecast - by Application
- 5.3.1. Pharmaceutical and Biological Manufacturing
- 5.3.2. Medical Device Manufacturing
- 5.3.3. Other Applications
- 5.4. Market Analysis, Insights and Forecast - by Region
- 5.4.1. North America
- 5.4.2. Europe
- 5.4.3. Asia Pacific
- 5.4.4. Middle East and Africa
- 5.4.5. South America
- 5.1. Market Analysis, Insights and Forecast - by Product Type
- 6. North America Automated Sterility Testing Industry Analysis, Insights and Forecast, 2019-2031
- 6.1. Market Analysis, Insights and Forecast - by Product Type
- 6.1.1. Instruments
- 6.1.2. Kits and Reagents
- 6.1.3. Services
- 6.2. Market Analysis, Insights and Forecast - by Test Type
- 6.2.1. Membrane Filtration
- 6.2.2. Direct Inoculation
- 6.2.3. Other Sterility Tests
- 6.3. Market Analysis, Insights and Forecast - by Application
- 6.3.1. Pharmaceutical and Biological Manufacturing
- 6.3.2. Medical Device Manufacturing
- 6.3.3. Other Applications
- 6.1. Market Analysis, Insights and Forecast - by Product Type
- 7. Europe Automated Sterility Testing Industry Analysis, Insights and Forecast, 2019-2031
- 7.1. Market Analysis, Insights and Forecast - by Product Type
- 7.1.1. Instruments
- 7.1.2. Kits and Reagents
- 7.1.3. Services
- 7.2. Market Analysis, Insights and Forecast - by Test Type
- 7.2.1. Membrane Filtration
- 7.2.2. Direct Inoculation
- 7.2.3. Other Sterility Tests
- 7.3. Market Analysis, Insights and Forecast - by Application
- 7.3.1. Pharmaceutical and Biological Manufacturing
- 7.3.2. Medical Device Manufacturing
- 7.3.3. Other Applications
- 7.1. Market Analysis, Insights and Forecast - by Product Type
- 8. Asia Pacific Automated Sterility Testing Industry Analysis, Insights and Forecast, 2019-2031
- 8.1. Market Analysis, Insights and Forecast - by Product Type
- 8.1.1. Instruments
- 8.1.2. Kits and Reagents
- 8.1.3. Services
- 8.2. Market Analysis, Insights and Forecast - by Test Type
- 8.2.1. Membrane Filtration
- 8.2.2. Direct Inoculation
- 8.2.3. Other Sterility Tests
- 8.3. Market Analysis, Insights and Forecast - by Application
- 8.3.1. Pharmaceutical and Biological Manufacturing
- 8.3.2. Medical Device Manufacturing
- 8.3.3. Other Applications
- 8.1. Market Analysis, Insights and Forecast - by Product Type
- 9. Middle East and Africa Automated Sterility Testing Industry Analysis, Insights and Forecast, 2019-2031
- 9.1. Market Analysis, Insights and Forecast - by Product Type
- 9.1.1. Instruments
- 9.1.2. Kits and Reagents
- 9.1.3. Services
- 9.2. Market Analysis, Insights and Forecast - by Test Type
- 9.2.1. Membrane Filtration
- 9.2.2. Direct Inoculation
- 9.2.3. Other Sterility Tests
- 9.3. Market Analysis, Insights and Forecast - by Application
- 9.3.1. Pharmaceutical and Biological Manufacturing
- 9.3.2. Medical Device Manufacturing
- 9.3.3. Other Applications
- 9.1. Market Analysis, Insights and Forecast - by Product Type
- 10. South America Automated Sterility Testing Industry Analysis, Insights and Forecast, 2019-2031
- 10.1. Market Analysis, Insights and Forecast - by Product Type
- 10.1.1. Instruments
- 10.1.2. Kits and Reagents
- 10.1.3. Services
- 10.2. Market Analysis, Insights and Forecast - by Test Type
- 10.2.1. Membrane Filtration
- 10.2.2. Direct Inoculation
- 10.2.3. Other Sterility Tests
- 10.3. Market Analysis, Insights and Forecast - by Application
- 10.3.1. Pharmaceutical and Biological Manufacturing
- 10.3.2. Medical Device Manufacturing
- 10.3.3. Other Applications
- 10.1. Market Analysis, Insights and Forecast - by Product Type
- 11. North America Automated Sterility Testing Industry Analysis, Insights and Forecast, 2019-2031
- 11.1. Market Analysis, Insights and Forecast - By Country/Sub-region
- 11.1.1 United States
- 11.1.2 Canada
- 11.1.3 Mexico
- 12. Europe Automated Sterility Testing Industry Analysis, Insights and Forecast, 2019-2031
- 12.1. Market Analysis, Insights and Forecast - By Country/Sub-region
- 12.1.1 Germany
- 12.1.2 United Kingdom
- 12.1.3 France
- 12.1.4 Italy
- 12.1.5 Spain
- 12.1.6 Rest of Europe
- 13. Asia Pacific Automated Sterility Testing Industry Analysis, Insights and Forecast, 2019-2031
- 13.1. Market Analysis, Insights and Forecast - By Country/Sub-region
- 13.1.1 China
- 13.1.2 Japan
- 13.1.3 India
- 13.1.4 Australia
- 13.1.5 South Korea
- 13.1.6 Rest of Asia Pacific
- 14. Middle East and Africa Automated Sterility Testing Industry Analysis, Insights and Forecast, 2019-2031
- 14.1. Market Analysis, Insights and Forecast - By Country/Sub-region
- 14.1.1 GCC
- 14.1.2 South Africa
- 14.1.3 Rest of Middle East and Africa
- 15. South America Automated Sterility Testing Industry Analysis, Insights and Forecast, 2019-2031
- 15.1. Market Analysis, Insights and Forecast - By Country/Sub-region
- 15.1.1 Brazil
- 15.1.2 Argentina
- 15.1.3 Rest of South America
- 16. Competitive Analysis
- 16.1. Global Market Share Analysis 2024
- 16.2. Company Profiles
- 16.2.1 Charles River Laboratories
- 16.2.1.1. Overview
- 16.2.1.2. Products
- 16.2.1.3. SWOT Analysis
- 16.2.1.4. Recent Developments
- 16.2.1.5. Financials (Based on Availability)
- 16.2.2 Merck KGaA
- 16.2.2.1. Overview
- 16.2.2.2. Products
- 16.2.2.3. SWOT Analysis
- 16.2.2.4. Recent Developments
- 16.2.2.5. Financials (Based on Availability)
- 16.2.3 Rapid Micro Biosystems Inc
- 16.2.3.1. Overview
- 16.2.3.2. Products
- 16.2.3.3. SWOT Analysis
- 16.2.3.4. Recent Developments
- 16.2.3.5. Financials (Based on Availability)
- 16.2.4 Laboratory Corporation of America Holdings (TOXIKON)
- 16.2.4.1. Overview
- 16.2.4.2. Products
- 16.2.4.3. SWOT Analysis
- 16.2.4.4. Recent Developments
- 16.2.4.5. Financials (Based on Availability)
- 16.2.5 Sotera Health (Nelson Laboratories LLC)
- 16.2.5.1. Overview
- 16.2.5.2. Products
- 16.2.5.3. SWOT Analysis
- 16.2.5.4. Recent Developments
- 16.2.5.5. Financials (Based on Availability)
- 16.2.6 Sartorius AG
- 16.2.6.1. Overview
- 16.2.6.2. Products
- 16.2.6.3. SWOT Analysis
- 16.2.6.4. Recent Developments
- 16.2.6.5. Financials (Based on Availability)
- 16.2.7 SGS SA
- 16.2.7.1. Overview
- 16.2.7.2. Products
- 16.2.7.3. SWOT Analysis
- 16.2.7.4. Recent Developments
- 16.2.7.5. Financials (Based on Availability)
- 16.2.8 bioMerieux SA
- 16.2.8.1. Overview
- 16.2.8.2. Products
- 16.2.8.3. SWOT Analysis
- 16.2.8.4. Recent Developments
- 16.2.8.5. Financials (Based on Availability)
- 16.2.9 WuXi AppTec
- 16.2.9.1. Overview
- 16.2.9.2. Products
- 16.2.9.3. SWOT Analysis
- 16.2.9.4. Recent Developments
- 16.2.9.5. Financials (Based on Availability)
- 16.2.10 Pace Analytical
- 16.2.10.1. Overview
- 16.2.10.2. Products
- 16.2.10.3. SWOT Analysis
- 16.2.10.4. Recent Developments
- 16.2.10.5. Financials (Based on Availability)
- 16.2.11 Thermo Fisher Scientific
- 16.2.11.1. Overview
- 16.2.11.2. Products
- 16.2.11.3. SWOT Analysis
- 16.2.11.4. Recent Developments
- 16.2.11.5. Financials (Based on Availability)
- 16.2.12 STERIS
- 16.2.12.1. Overview
- 16.2.12.2. Products
- 16.2.12.3. SWOT Analysis
- 16.2.12.4. Recent Developments
- 16.2.12.5. Financials (Based on Availability)
- 16.2.1 Charles River Laboratories
List of Figures
- Figure 1: Global Automated Sterility Testing Industry Revenue Breakdown (Million, %) by Region 2024 & 2032
- Figure 2: North America Automated Sterility Testing Industry Revenue (Million), by Country 2024 & 2032
- Figure 3: North America Automated Sterility Testing Industry Revenue Share (%), by Country 2024 & 2032
- Figure 4: Europe Automated Sterility Testing Industry Revenue (Million), by Country 2024 & 2032
- Figure 5: Europe Automated Sterility Testing Industry Revenue Share (%), by Country 2024 & 2032
- Figure 6: Asia Pacific Automated Sterility Testing Industry Revenue (Million), by Country 2024 & 2032
- Figure 7: Asia Pacific Automated Sterility Testing Industry Revenue Share (%), by Country 2024 & 2032
- Figure 8: Middle East and Africa Automated Sterility Testing Industry Revenue (Million), by Country 2024 & 2032
- Figure 9: Middle East and Africa Automated Sterility Testing Industry Revenue Share (%), by Country 2024 & 2032
- Figure 10: South America Automated Sterility Testing Industry Revenue (Million), by Country 2024 & 2032
- Figure 11: South America Automated Sterility Testing Industry Revenue Share (%), by Country 2024 & 2032
- Figure 12: North America Automated Sterility Testing Industry Revenue (Million), by Product Type 2024 & 2032
- Figure 13: North America Automated Sterility Testing Industry Revenue Share (%), by Product Type 2024 & 2032
- Figure 14: North America Automated Sterility Testing Industry Revenue (Million), by Test Type 2024 & 2032
- Figure 15: North America Automated Sterility Testing Industry Revenue Share (%), by Test Type 2024 & 2032
- Figure 16: North America Automated Sterility Testing Industry Revenue (Million), by Application 2024 & 2032
- Figure 17: North America Automated Sterility Testing Industry Revenue Share (%), by Application 2024 & 2032
- Figure 18: North America Automated Sterility Testing Industry Revenue (Million), by Country 2024 & 2032
- Figure 19: North America Automated Sterility Testing Industry Revenue Share (%), by Country 2024 & 2032
- Figure 20: Europe Automated Sterility Testing Industry Revenue (Million), by Product Type 2024 & 2032
- Figure 21: Europe Automated Sterility Testing Industry Revenue Share (%), by Product Type 2024 & 2032
- Figure 22: Europe Automated Sterility Testing Industry Revenue (Million), by Test Type 2024 & 2032
- Figure 23: Europe Automated Sterility Testing Industry Revenue Share (%), by Test Type 2024 & 2032
- Figure 24: Europe Automated Sterility Testing Industry Revenue (Million), by Application 2024 & 2032
- Figure 25: Europe Automated Sterility Testing Industry Revenue Share (%), by Application 2024 & 2032
- Figure 26: Europe Automated Sterility Testing Industry Revenue (Million), by Country 2024 & 2032
- Figure 27: Europe Automated Sterility Testing Industry Revenue Share (%), by Country 2024 & 2032
- Figure 28: Asia Pacific Automated Sterility Testing Industry Revenue (Million), by Product Type 2024 & 2032
- Figure 29: Asia Pacific Automated Sterility Testing Industry Revenue Share (%), by Product Type 2024 & 2032
- Figure 30: Asia Pacific Automated Sterility Testing Industry Revenue (Million), by Test Type 2024 & 2032
- Figure 31: Asia Pacific Automated Sterility Testing Industry Revenue Share (%), by Test Type 2024 & 2032
- Figure 32: Asia Pacific Automated Sterility Testing Industry Revenue (Million), by Application 2024 & 2032
- Figure 33: Asia Pacific Automated Sterility Testing Industry Revenue Share (%), by Application 2024 & 2032
- Figure 34: Asia Pacific Automated Sterility Testing Industry Revenue (Million), by Country 2024 & 2032
- Figure 35: Asia Pacific Automated Sterility Testing Industry Revenue Share (%), by Country 2024 & 2032
- Figure 36: Middle East and Africa Automated Sterility Testing Industry Revenue (Million), by Product Type 2024 & 2032
- Figure 37: Middle East and Africa Automated Sterility Testing Industry Revenue Share (%), by Product Type 2024 & 2032
- Figure 38: Middle East and Africa Automated Sterility Testing Industry Revenue (Million), by Test Type 2024 & 2032
- Figure 39: Middle East and Africa Automated Sterility Testing Industry Revenue Share (%), by Test Type 2024 & 2032
- Figure 40: Middle East and Africa Automated Sterility Testing Industry Revenue (Million), by Application 2024 & 2032
- Figure 41: Middle East and Africa Automated Sterility Testing Industry Revenue Share (%), by Application 2024 & 2032
- Figure 42: Middle East and Africa Automated Sterility Testing Industry Revenue (Million), by Country 2024 & 2032
- Figure 43: Middle East and Africa Automated Sterility Testing Industry Revenue Share (%), by Country 2024 & 2032
- Figure 44: South America Automated Sterility Testing Industry Revenue (Million), by Product Type 2024 & 2032
- Figure 45: South America Automated Sterility Testing Industry Revenue Share (%), by Product Type 2024 & 2032
- Figure 46: South America Automated Sterility Testing Industry Revenue (Million), by Test Type 2024 & 2032
- Figure 47: South America Automated Sterility Testing Industry Revenue Share (%), by Test Type 2024 & 2032
- Figure 48: South America Automated Sterility Testing Industry Revenue (Million), by Application 2024 & 2032
- Figure 49: South America Automated Sterility Testing Industry Revenue Share (%), by Application 2024 & 2032
- Figure 50: South America Automated Sterility Testing Industry Revenue (Million), by Country 2024 & 2032
- Figure 51: South America Automated Sterility Testing Industry Revenue Share (%), by Country 2024 & 2032
List of Tables
- Table 1: Global Automated Sterility Testing Industry Revenue Million Forecast, by Region 2019 & 2032
- Table 2: Global Automated Sterility Testing Industry Revenue Million Forecast, by Product Type 2019 & 2032
- Table 3: Global Automated Sterility Testing Industry Revenue Million Forecast, by Test Type 2019 & 2032
- Table 4: Global Automated Sterility Testing Industry Revenue Million Forecast, by Application 2019 & 2032
- Table 5: Global Automated Sterility Testing Industry Revenue Million Forecast, by Region 2019 & 2032
- Table 6: Global Automated Sterility Testing Industry Revenue Million Forecast, by Country 2019 & 2032
- Table 7: United States Automated Sterility Testing Industry Revenue (Million) Forecast, by Application 2019 & 2032
- Table 8: Canada Automated Sterility Testing Industry Revenue (Million) Forecast, by Application 2019 & 2032
- Table 9: Mexico Automated Sterility Testing Industry Revenue (Million) Forecast, by Application 2019 & 2032
- Table 10: Global Automated Sterility Testing Industry Revenue Million Forecast, by Country 2019 & 2032
- Table 11: Germany Automated Sterility Testing Industry Revenue (Million) Forecast, by Application 2019 & 2032
- Table 12: United Kingdom Automated Sterility Testing Industry Revenue (Million) Forecast, by Application 2019 & 2032
- Table 13: France Automated Sterility Testing Industry Revenue (Million) Forecast, by Application 2019 & 2032
- Table 14: Italy Automated Sterility Testing Industry Revenue (Million) Forecast, by Application 2019 & 2032
- Table 15: Spain Automated Sterility Testing Industry Revenue (Million) Forecast, by Application 2019 & 2032
- Table 16: Rest of Europe Automated Sterility Testing Industry Revenue (Million) Forecast, by Application 2019 & 2032
- Table 17: Global Automated Sterility Testing Industry Revenue Million Forecast, by Country 2019 & 2032
- Table 18: China Automated Sterility Testing Industry Revenue (Million) Forecast, by Application 2019 & 2032
- Table 19: Japan Automated Sterility Testing Industry Revenue (Million) Forecast, by Application 2019 & 2032
- Table 20: India Automated Sterility Testing Industry Revenue (Million) Forecast, by Application 2019 & 2032
- Table 21: Australia Automated Sterility Testing Industry Revenue (Million) Forecast, by Application 2019 & 2032
- Table 22: South Korea Automated Sterility Testing Industry Revenue (Million) Forecast, by Application 2019 & 2032
- Table 23: Rest of Asia Pacific Automated Sterility Testing Industry Revenue (Million) Forecast, by Application 2019 & 2032
- Table 24: Global Automated Sterility Testing Industry Revenue Million Forecast, by Country 2019 & 2032
- Table 25: GCC Automated Sterility Testing Industry Revenue (Million) Forecast, by Application 2019 & 2032
- Table 26: South Africa Automated Sterility Testing Industry Revenue (Million) Forecast, by Application 2019 & 2032
- Table 27: Rest of Middle East and Africa Automated Sterility Testing Industry Revenue (Million) Forecast, by Application 2019 & 2032
- Table 28: Global Automated Sterility Testing Industry Revenue Million Forecast, by Country 2019 & 2032
- Table 29: Brazil Automated Sterility Testing Industry Revenue (Million) Forecast, by Application 2019 & 2032
- Table 30: Argentina Automated Sterility Testing Industry Revenue (Million) Forecast, by Application 2019 & 2032
- Table 31: Rest of South America Automated Sterility Testing Industry Revenue (Million) Forecast, by Application 2019 & 2032
- Table 32: Global Automated Sterility Testing Industry Revenue Million Forecast, by Product Type 2019 & 2032
- Table 33: Global Automated Sterility Testing Industry Revenue Million Forecast, by Test Type 2019 & 2032
- Table 34: Global Automated Sterility Testing Industry Revenue Million Forecast, by Application 2019 & 2032
- Table 35: Global Automated Sterility Testing Industry Revenue Million Forecast, by Country 2019 & 2032
- Table 36: United States Automated Sterility Testing Industry Revenue (Million) Forecast, by Application 2019 & 2032
- Table 37: Canada Automated Sterility Testing Industry Revenue (Million) Forecast, by Application 2019 & 2032
- Table 38: Mexico Automated Sterility Testing Industry Revenue (Million) Forecast, by Application 2019 & 2032
- Table 39: Global Automated Sterility Testing Industry Revenue Million Forecast, by Product Type 2019 & 2032
- Table 40: Global Automated Sterility Testing Industry Revenue Million Forecast, by Test Type 2019 & 2032
- Table 41: Global Automated Sterility Testing Industry Revenue Million Forecast, by Application 2019 & 2032
- Table 42: Global Automated Sterility Testing Industry Revenue Million Forecast, by Country 2019 & 2032
- Table 43: Germany Automated Sterility Testing Industry Revenue (Million) Forecast, by Application 2019 & 2032
- Table 44: United Kingdom Automated Sterility Testing Industry Revenue (Million) Forecast, by Application 2019 & 2032
- Table 45: France Automated Sterility Testing Industry Revenue (Million) Forecast, by Application 2019 & 2032
- Table 46: Italy Automated Sterility Testing Industry Revenue (Million) Forecast, by Application 2019 & 2032
- Table 47: Spain Automated Sterility Testing Industry Revenue (Million) Forecast, by Application 2019 & 2032
- Table 48: Rest of Europe Automated Sterility Testing Industry Revenue (Million) Forecast, by Application 2019 & 2032
- Table 49: Global Automated Sterility Testing Industry Revenue Million Forecast, by Product Type 2019 & 2032
- Table 50: Global Automated Sterility Testing Industry Revenue Million Forecast, by Test Type 2019 & 2032
- Table 51: Global Automated Sterility Testing Industry Revenue Million Forecast, by Application 2019 & 2032
- Table 52: Global Automated Sterility Testing Industry Revenue Million Forecast, by Country 2019 & 2032
- Table 53: China Automated Sterility Testing Industry Revenue (Million) Forecast, by Application 2019 & 2032
- Table 54: Japan Automated Sterility Testing Industry Revenue (Million) Forecast, by Application 2019 & 2032
- Table 55: India Automated Sterility Testing Industry Revenue (Million) Forecast, by Application 2019 & 2032
- Table 56: Australia Automated Sterility Testing Industry Revenue (Million) Forecast, by Application 2019 & 2032
- Table 57: South Korea Automated Sterility Testing Industry Revenue (Million) Forecast, by Application 2019 & 2032
- Table 58: Rest of Asia Pacific Automated Sterility Testing Industry Revenue (Million) Forecast, by Application 2019 & 2032
- Table 59: Global Automated Sterility Testing Industry Revenue Million Forecast, by Product Type 2019 & 2032
- Table 60: Global Automated Sterility Testing Industry Revenue Million Forecast, by Test Type 2019 & 2032
- Table 61: Global Automated Sterility Testing Industry Revenue Million Forecast, by Application 2019 & 2032
- Table 62: Global Automated Sterility Testing Industry Revenue Million Forecast, by Country 2019 & 2032
- Table 63: GCC Automated Sterility Testing Industry Revenue (Million) Forecast, by Application 2019 & 2032
- Table 64: South Africa Automated Sterility Testing Industry Revenue (Million) Forecast, by Application 2019 & 2032
- Table 65: Rest of Middle East and Africa Automated Sterility Testing Industry Revenue (Million) Forecast, by Application 2019 & 2032
- Table 66: Global Automated Sterility Testing Industry Revenue Million Forecast, by Product Type 2019 & 2032
- Table 67: Global Automated Sterility Testing Industry Revenue Million Forecast, by Test Type 2019 & 2032
- Table 68: Global Automated Sterility Testing Industry Revenue Million Forecast, by Application 2019 & 2032
- Table 69: Global Automated Sterility Testing Industry Revenue Million Forecast, by Country 2019 & 2032
- Table 70: Brazil Automated Sterility Testing Industry Revenue (Million) Forecast, by Application 2019 & 2032
- Table 71: Argentina Automated Sterility Testing Industry Revenue (Million) Forecast, by Application 2019 & 2032
- Table 72: Rest of South America Automated Sterility Testing Industry Revenue (Million) Forecast, by Application 2019 & 2032
Frequently Asked Questions
1. What is the projected Compound Annual Growth Rate (CAGR) of the Automated Sterility Testing Industry?
The projected CAGR is approximately 11.10%.
2. Which companies are prominent players in the Automated Sterility Testing Industry?
Key companies in the market include Charles River Laboratories, Merck KGaA, Rapid Micro Biosystems Inc, Laboratory Corporation of America Holdings (TOXIKON), Sotera Health (Nelson Laboratories LLC), Sartorius AG, SGS SA, bioMerieux SA, WuXi AppTec, Pace Analytical, Thermo Fisher Scientific, STERIS.
3. What are the main segments of the Automated Sterility Testing Industry?
The market segments include Product Type, Test Type, Application.
4. Can you provide details about the market size?
The market size is estimated to be USD 1.43 Million as of 2022.
5. What are some drivers contributing to market growth?
Increasing Research and Development in Life Sciences; Increasing Number of Drug Launches; Rise in Demand for Sterilized Products.
6. What are the notable trends driving market growth?
Pharmaceutical and Biological Manufacturing Segment Expected to Grow Over the Forecast Period.
7. Are there any restraints impacting market growth?
Stringent Regulatory Framework.
8. Can you provide examples of recent developments in the market?
Jun 2022: STEMart launched comprehensive microbiology and sterility testing for sterile, non-pyrogenic medical devices.
9. What pricing options are available for accessing the report?
Pricing options include single-user, multi-user, and enterprise licenses priced at USD 4750, USD 5250, and USD 8750 respectively.
10. Is the market size provided in terms of value or volume?
The market size is provided in terms of value, measured in Million.
11. Are there any specific market keywords associated with the report?
Yes, the market keyword associated with the report is "Automated Sterility Testing Industry," which aids in identifying and referencing the specific market segment covered.
12. How do I determine which pricing option suits my needs best?
The pricing options vary based on user requirements and access needs. Individual users may opt for single-user licenses, while businesses requiring broader access may choose multi-user or enterprise licenses for cost-effective access to the report.
13. Are there any additional resources or data provided in the Automated Sterility Testing Industry report?
While the report offers comprehensive insights, it's advisable to review the specific contents or supplementary materials provided to ascertain if additional resources or data are available.
14. How can I stay updated on further developments or reports in the Automated Sterility Testing Industry?
To stay informed about further developments, trends, and reports in the Automated Sterility Testing Industry, consider subscribing to industry newsletters, following relevant companies and organizations, or regularly checking reputable industry news sources and publications.
Methodology
Step 1 - Identification of Relevant Samples Size from Population Database


Step 2 - Approaches for Defining Global Market Size (Value, Volume* & Price*)

Note*: In applicable scenarios
Step 3 - Data Sources
Primary Research
- Web Analytics
- Survey Reports
- Research Institute
- Latest Research Reports
- Opinion Leaders
Secondary Research
- Annual Reports
- White Paper
- Latest Press Release
- Industry Association
- Paid Database
- Investor Presentations

Step 4 - Data Triangulation
Involves using different sources of information in order to increase the validity of a study
These sources are likely to be stakeholders in a program - participants, other researchers, program staff, other community members, and so on.
Then we put all data in single framework & apply various statistical tools to find out the dynamic on the market.
During the analysis stage, feedback from the stakeholder groups would be compared to determine areas of agreement as well as areas of divergence
