

Key Insights
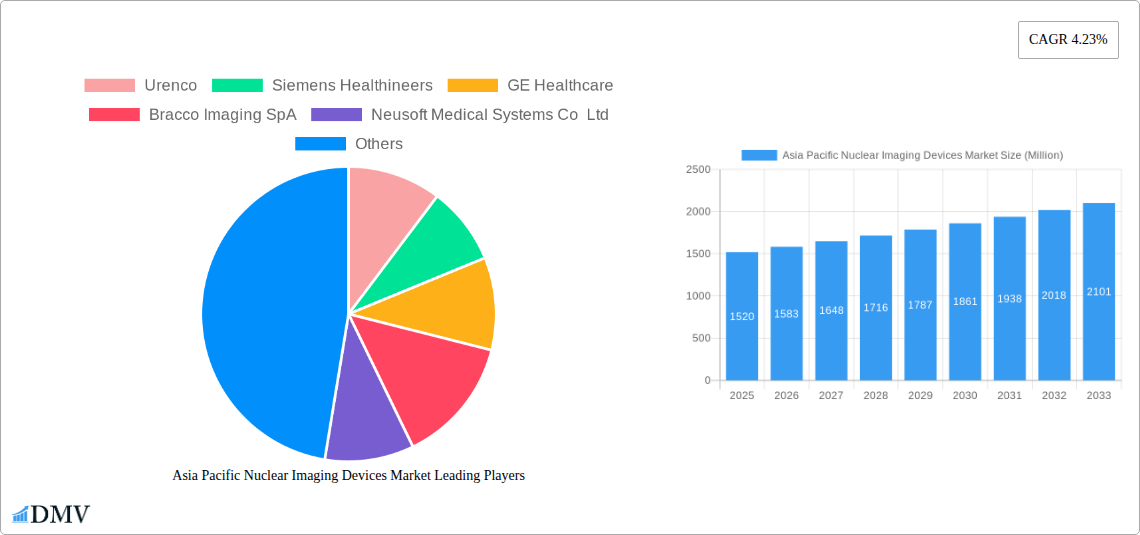
The Asia Pacific nuclear imaging devices market, valued at $1.52 billion in 2025, is projected to experience robust growth, driven by factors such as the rising prevalence of chronic diseases like cancer and cardiovascular ailments necessitating advanced diagnostic tools. The increasing geriatric population in the region further fuels demand for accurate and early disease detection. Technological advancements, including the development of more sophisticated SPECT and PET radioisotopes and imaging equipment with improved resolution and faster scan times, are contributing significantly to market expansion. Government initiatives promoting healthcare infrastructure development and increased funding for research and development in medical imaging technologies also play a crucial role. The market is segmented by product type (equipment and radioisotopes), with the equipment segment holding a larger share due to the high capital expenditure involved in acquiring sophisticated imaging systems. Further segmentation by specific radioisotopes (Technetium-99m, Fluorine-18, etc.) and applications (SPECT and PET) reflects the diverse needs within the field. Competition among key players like Siemens Healthineers, GE Healthcare, and Philips, characterized by continuous innovation and strategic partnerships, ensures a dynamic and competitive landscape.
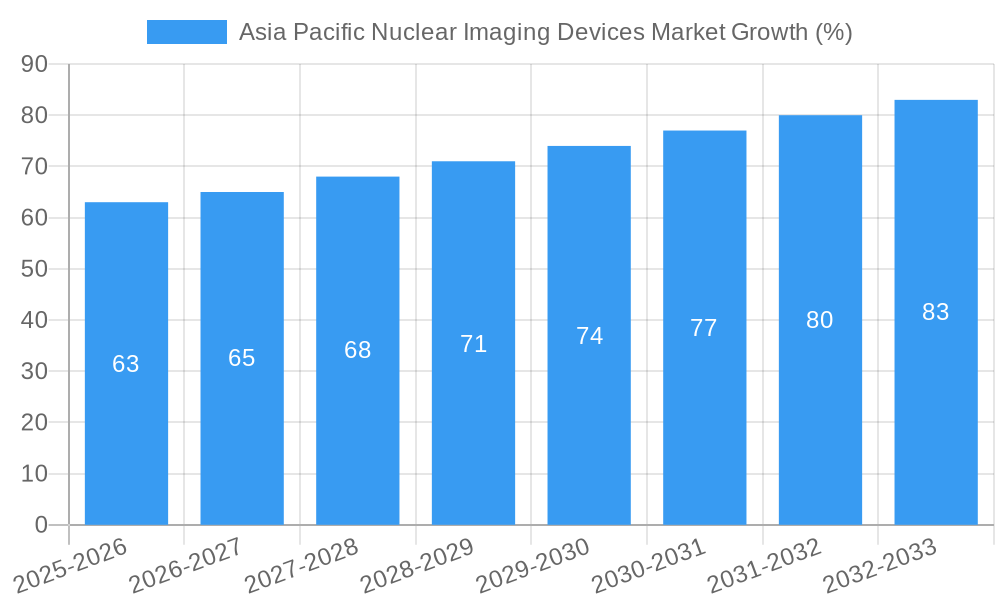
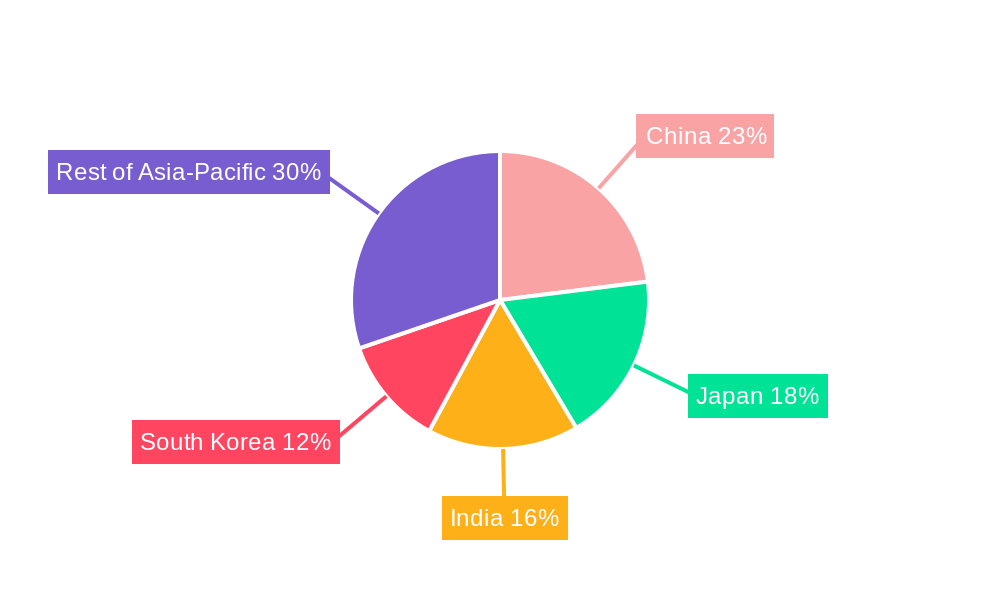
Growth in this market is also influenced by challenges such as the high cost of equipment and radioisotopes, stringent regulatory approvals for new technologies, and the need for skilled personnel to operate and maintain these complex systems. Despite these constraints, the increasing awareness of early diagnosis and its impact on treatment outcomes, coupled with rising disposable incomes in certain parts of the region, continues to propel market growth. Specifically, countries like China, India, and Japan, characterized by large populations and expanding healthcare sectors, are expected to demonstrate the highest growth rates within the Asia Pacific region. This sustained demand, coupled with continued technological advancements and supportive government policies, positions the Asia Pacific nuclear imaging devices market for significant expansion throughout the forecast period (2025-2033). A projected Compound Annual Growth Rate (CAGR) of 4.23% suggests a substantial market increase by 2033.
Asia Pacific Nuclear Imaging Devices Market: A Comprehensive Report (2019-2033)
This insightful report provides a detailed analysis of the Asia Pacific Nuclear Imaging Devices market, offering a comprehensive overview of its current state, future trajectory, and key players. Covering the period from 2019 to 2033, with 2025 as the base year, this research meticulously examines market trends, technological advancements, and competitive dynamics to empower stakeholders with data-driven decisions. The market is projected to reach xx Million by 2033.
Asia Pacific Nuclear Imaging Devices Market Composition & Trends
The Asia Pacific nuclear imaging devices market exhibits a moderately concentrated landscape, with key players like Siemens Healthineers, GE Healthcare, and Philips holding significant market share. The market's growth is propelled by factors such as increasing prevalence of chronic diseases, rising healthcare expenditure, and technological advancements leading to improved image quality and diagnostic capabilities. Regulatory landscapes vary across the region, influencing adoption rates and market access. Substitute products, such as MRI and ultrasound, pose some competitive pressure, while the market is also witnessing a rise in mergers and acquisitions (M&A) activities, with deal values exceeding xx Million in recent years.
- Market Concentration: Moderately concentrated, with top 5 players holding approximately xx% market share in 2025.
- Innovation Catalysts: Advances in PET/SPECT technology, AI-powered image analysis, and radiopharmaceutical development.
- Regulatory Landscape: Variable across countries, impacting market access and adoption rates.
- Substitute Products: MRI, Ultrasound, posing moderate competitive pressure.
- End-User Profiles: Hospitals, diagnostic centers, and research institutions.
- M&A Activities: Significant activity observed, with total deal values exceeding xx Million between 2019 and 2024.
Asia Pacific Nuclear Imaging Devices Market Industry Evolution
The Asia Pacific nuclear imaging devices market has experienced robust growth over the historical period (2019-2024), driven by increasing healthcare infrastructure development and rising demand for advanced diagnostic tools. The market is witnessing a shift towards technologically advanced systems, such as hybrid PET/CT and SPECT/CT scanners, offering improved image resolution and diagnostic accuracy. Furthermore, the growing prevalence of chronic diseases like cancer and cardiovascular disorders is significantly boosting the demand for nuclear imaging procedures. Technological advancements, including AI-powered image analysis tools, are streamlining workflow and enhancing diagnostic capabilities. Consumer demand is shifting towards more convenient, faster, and less invasive imaging procedures.
- CAGR (2019-2024): xx%
- Market Size (2024): xx Million
- Adoption Rate of Hybrid PET/CT: xx% in 2024
- Projected CAGR (2025-2033): xx%
Leading Regions, Countries, or Segments in Asia Pacific Nuclear Imaging Devices Market
Japan and China are the dominant markets in the Asia Pacific region, driven by strong healthcare infrastructure, high prevalence of target diseases, and increasing investments in advanced medical technologies. Within product types, Equipment (SPECT and PET scanners) holds the largest market share, followed by radioisotopes (Technetium-99m being the most prevalent). Among applications, oncology (both PET and SPECT applications) dominates the market.
Key Growth Drivers:
- Significant investments in healthcare infrastructure.
- Government initiatives promoting advanced medical technologies.
- Rising prevalence of chronic diseases (cancer, cardiovascular disorders).
- Increasing adoption of hybrid imaging systems (PET/CT, SPECT/CT).
Dominance Factors: High healthcare expenditure, advanced healthcare infrastructure, and growing awareness of nuclear imaging's diagnostic capabilities.
Asia Pacific Nuclear Imaging Devices Market Product Innovations
Recent years have witnessed significant product innovations in the Asia Pacific nuclear imaging devices market. Manufacturers are focusing on developing smaller, more portable, and cost-effective systems with improved image quality and reduced radiation exposure. Integration of artificial intelligence (AI) and machine learning (ML) algorithms is improving diagnostic accuracy and workflow efficiency. Hybrid imaging systems (PET/CT, SPECT/CT) are gaining traction due to their ability to provide comprehensive diagnostic information.
Propelling Factors for Asia Pacific Nuclear Imaging Devices Market Growth
Several factors propel the growth of the Asia Pacific nuclear imaging devices market. Technological advancements, such as the development of new radiotracers and advanced imaging techniques, significantly enhance diagnostic accuracy. Increasing government initiatives to improve healthcare infrastructure and expanding access to medical technologies boost market penetration. The rising prevalence of chronic diseases requiring nuclear imaging for diagnosis and treatment is another key driver. Favorable regulatory environments in certain countries expedite market access for new devices and radioisotopes.
Obstacles in the Asia Pacific Nuclear Imaging Devices Market
The Asia Pacific nuclear imaging devices market faces challenges like stringent regulatory approvals for new technologies and high costs associated with equipment and radioisotopes. Supply chain disruptions for radioisotopes can lead to shortages and affect accessibility. Intense competition among established players and the emergence of new entrants create competitive pressures impacting pricing and market share.
Future Opportunities in Asia Pacific Nuclear Imaging Devices Market
The market presents significant opportunities, including the expanding use of molecular imaging techniques, increasing adoption of cloud-based image analysis platforms, and development of personalized medicine approaches using nuclear imaging. Penetration into underserved markets within the region offers growth potential. The development of novel radiotracers and advanced imaging techniques will continue to drive market expansion.
Major Players in the Asia Pacific Nuclear Imaging Devices Market Ecosystem
- Urenco
- Siemens Healthineers
- GE Healthcare
- Bracco Imaging SpA
- Neusoft Medical Systems Co Ltd
- Koninklijke Philips NV
- Canon Medical Systems Corporation
- Taiyo Nippon Sanso
- MiE GmbH
Key Developments in Asia Pacific Nuclear Imaging Devices Market Industry
- January 2023: Siemens Healthineers launches a new PET/CT scanner with enhanced image quality in Japan.
- June 2022: GE Healthcare announces a strategic partnership with a regional radiopharmaceutical company to expand access to radioisotopes in South Korea.
- October 2021: Philips acquires a smaller medical imaging company specializing in AI-powered image analysis.
- (Add further developments with year/month and impact)
Strategic Asia Pacific Nuclear Imaging Devices Market Forecast
The Asia Pacific nuclear imaging devices market is poised for sustained growth driven by technological advancements, rising healthcare expenditure, and the increasing prevalence of chronic diseases. The market's future potential is substantial, especially with ongoing innovations in hybrid imaging, AI-driven analysis, and the development of targeted radiopharmaceuticals. Continued investment in healthcare infrastructure across the region will further contribute to market expansion.
Asia Pacific Nuclear Imaging Devices Market Segmentation
-
1. Product Type
- 1.1. Equipment
-
1.2. Radioisotope
-
1.2.1. SPECT Radioisotopes
- 1.2.1.1. Technetium-99m (TC-99m)
- 1.2.1.2. Thallium-201 (TI-201)
- 1.2.1.3. Gallium(Ga-67)
- 1.2.1.4. Iodine (I-123)
- 1.2.1.5. Other SPECT Radioisotopes
-
1.2.2. PET Radioisotopes
- 1.2.2.1. Fluorine-18 (F-18)
- 1.2.2.2. Rubidium-82 (RB-82)
- 1.2.2.3. Other PET Radioisotopes
-
1.2.1. SPECT Radioisotopes
-
2. Application
-
2.1. SPECT Applications
- 2.1.1. Cardiology
- 2.1.2. Neurology
- 2.1.3. Thyroid
- 2.1.4. Other SPECT Applications
-
2.2. PET Applications
- 2.2.1. Oncology
- 2.2.2. Other PET Applications
-
2.1. SPECT Applications
-
3. Geography
-
3.1. Asia-Pacific
- 3.1.1. China
- 3.1.2. Japan
- 3.1.3. India
- 3.1.4. Australia
- 3.1.5. South Korea
- 3.1.6. Rest of Asia-Pacific
-
3.1. Asia-Pacific
Asia Pacific Nuclear Imaging Devices Market Segmentation By Geography
-
1. Asia Pacific
- 1.1. China
- 1.2. Japan
- 1.3. India
- 1.4. Australia
- 1.5. South Korea
- 1.6. Rest of Asia Pacific
Asia Pacific Nuclear Imaging Devices Market REPORT HIGHLIGHTS
| Aspects | Details |
|---|---|
| Study Period | 2019-2033 |
| Base Year | 2024 |
| Estimated Year | 2025 |
| Forecast Period | 2025-2033 |
| Historical Period | 2019-2024 |
| Growth Rate | CAGR of 4.23% from 2019-2033 |
| Segmentation |
|
Table of Contents
- 1. Introduction
- 1.1. Research Scope
- 1.2. Market Segmentation
- 1.3. Research Methodology
- 1.4. Definitions and Assumptions
- 2. Executive Summary
- 2.1. Introduction
- 3. Market Dynamics
- 3.1. Introduction
- 3.2. Market Drivers
- 3.2.1. ; Rise in Prevalence of Cancer and Cardiac Disorders; Increase in Technological Advancements
- 3.3. Market Restrains
- 3.3.1. ; Limited Reimbursement and Stringent Regulatory Procedures
- 3.4. Market Trends
- 3.4.1. Cardiology is Expected to Hold the Highest Market Share in the Region
- 4. Market Factor Analysis
- 4.1. Porters Five Forces
- 4.2. Supply/Value Chain
- 4.3. PESTEL analysis
- 4.4. Market Entropy
- 4.5. Patent/Trademark Analysis
- 5. Asia Pacific Nuclear Imaging Devices Market Analysis, Insights and Forecast, 2019-2031
- 5.1. Market Analysis, Insights and Forecast - by Product Type
- 5.1.1. Equipment
- 5.1.2. Radioisotope
- 5.1.2.1. SPECT Radioisotopes
- 5.1.2.1.1. Technetium-99m (TC-99m)
- 5.1.2.1.2. Thallium-201 (TI-201)
- 5.1.2.1.3. Gallium(Ga-67)
- 5.1.2.1.4. Iodine (I-123)
- 5.1.2.1.5. Other SPECT Radioisotopes
- 5.1.2.2. PET Radioisotopes
- 5.1.2.2.1. Fluorine-18 (F-18)
- 5.1.2.2.2. Rubidium-82 (RB-82)
- 5.1.2.2.3. Other PET Radioisotopes
- 5.1.2.1. SPECT Radioisotopes
- 5.2. Market Analysis, Insights and Forecast - by Application
- 5.2.1. SPECT Applications
- 5.2.1.1. Cardiology
- 5.2.1.2. Neurology
- 5.2.1.3. Thyroid
- 5.2.1.4. Other SPECT Applications
- 5.2.2. PET Applications
- 5.2.2.1. Oncology
- 5.2.2.2. Other PET Applications
- 5.2.1. SPECT Applications
- 5.3. Market Analysis, Insights and Forecast - by Geography
- 5.3.1. Asia-Pacific
- 5.3.1.1. China
- 5.3.1.2. Japan
- 5.3.1.3. India
- 5.3.1.4. Australia
- 5.3.1.5. South Korea
- 5.3.1.6. Rest of Asia-Pacific
- 5.3.1. Asia-Pacific
- 5.4. Market Analysis, Insights and Forecast - by Region
- 5.4.1. Asia Pacific
- 5.1. Market Analysis, Insights and Forecast - by Product Type
- 6. China Asia Pacific Nuclear Imaging Devices Market Analysis, Insights and Forecast, 2019-2031
- 7. Japan Asia Pacific Nuclear Imaging Devices Market Analysis, Insights and Forecast, 2019-2031
- 8. India Asia Pacific Nuclear Imaging Devices Market Analysis, Insights and Forecast, 2019-2031
- 9. South Korea Asia Pacific Nuclear Imaging Devices Market Analysis, Insights and Forecast, 2019-2031
- 10. Taiwan Asia Pacific Nuclear Imaging Devices Market Analysis, Insights and Forecast, 2019-2031
- 11. Australia Asia Pacific Nuclear Imaging Devices Market Analysis, Insights and Forecast, 2019-2031
- 12. Rest of Asia-Pacific Asia Pacific Nuclear Imaging Devices Market Analysis, Insights and Forecast, 2019-2031
- 13. Competitive Analysis
- 13.1. Market Share Analysis 2024
- 13.2. Company Profiles
- 13.2.1 Urenco
- 13.2.1.1. Overview
- 13.2.1.2. Products
- 13.2.1.3. SWOT Analysis
- 13.2.1.4. Recent Developments
- 13.2.1.5. Financials (Based on Availability)
- 13.2.2 Siemens Healthineers
- 13.2.2.1. Overview
- 13.2.2.2. Products
- 13.2.2.3. SWOT Analysis
- 13.2.2.4. Recent Developments
- 13.2.2.5. Financials (Based on Availability)
- 13.2.3 GE Healthcare
- 13.2.3.1. Overview
- 13.2.3.2. Products
- 13.2.3.3. SWOT Analysis
- 13.2.3.4. Recent Developments
- 13.2.3.5. Financials (Based on Availability)
- 13.2.4 Bracco Imaging SpA
- 13.2.4.1. Overview
- 13.2.4.2. Products
- 13.2.4.3. SWOT Analysis
- 13.2.4.4. Recent Developments
- 13.2.4.5. Financials (Based on Availability)
- 13.2.5 Neusoft Medical Systems Co Ltd
- 13.2.5.1. Overview
- 13.2.5.2. Products
- 13.2.5.3. SWOT Analysis
- 13.2.5.4. Recent Developments
- 13.2.5.5. Financials (Based on Availability)
- 13.2.6 Koninklijke Philips NV
- 13.2.6.1. Overview
- 13.2.6.2. Products
- 13.2.6.3. SWOT Analysis
- 13.2.6.4. Recent Developments
- 13.2.6.5. Financials (Based on Availability)
- 13.2.7 Canon Medical Systems Corporation
- 13.2.7.1. Overview
- 13.2.7.2. Products
- 13.2.7.3. SWOT Analysis
- 13.2.7.4. Recent Developments
- 13.2.7.5. Financials (Based on Availability)
- 13.2.8 Taiyo Nippon Sanso
- 13.2.8.1. Overview
- 13.2.8.2. Products
- 13.2.8.3. SWOT Analysis
- 13.2.8.4. Recent Developments
- 13.2.8.5. Financials (Based on Availability)
- 13.2.9 MiE GmbH
- 13.2.9.1. Overview
- 13.2.9.2. Products
- 13.2.9.3. SWOT Analysis
- 13.2.9.4. Recent Developments
- 13.2.9.5. Financials (Based on Availability)
- 13.2.1 Urenco
List of Figures
- Figure 1: Asia Pacific Nuclear Imaging Devices Market Revenue Breakdown (Million, %) by Product 2024 & 2032
- Figure 2: Asia Pacific Nuclear Imaging Devices Market Share (%) by Company 2024
List of Tables
- Table 1: Asia Pacific Nuclear Imaging Devices Market Revenue Million Forecast, by Region 2019 & 2032
- Table 2: Asia Pacific Nuclear Imaging Devices Market Volume K Unit Forecast, by Region 2019 & 2032
- Table 3: Asia Pacific Nuclear Imaging Devices Market Revenue Million Forecast, by Product Type 2019 & 2032
- Table 4: Asia Pacific Nuclear Imaging Devices Market Volume K Unit Forecast, by Product Type 2019 & 2032
- Table 5: Asia Pacific Nuclear Imaging Devices Market Revenue Million Forecast, by Application 2019 & 2032
- Table 6: Asia Pacific Nuclear Imaging Devices Market Volume K Unit Forecast, by Application 2019 & 2032
- Table 7: Asia Pacific Nuclear Imaging Devices Market Revenue Million Forecast, by Geography 2019 & 2032
- Table 8: Asia Pacific Nuclear Imaging Devices Market Volume K Unit Forecast, by Geography 2019 & 2032
- Table 9: Asia Pacific Nuclear Imaging Devices Market Revenue Million Forecast, by Region 2019 & 2032
- Table 10: Asia Pacific Nuclear Imaging Devices Market Volume K Unit Forecast, by Region 2019 & 2032
- Table 11: Asia Pacific Nuclear Imaging Devices Market Revenue Million Forecast, by Country 2019 & 2032
- Table 12: Asia Pacific Nuclear Imaging Devices Market Volume K Unit Forecast, by Country 2019 & 2032
- Table 13: China Asia Pacific Nuclear Imaging Devices Market Revenue (Million) Forecast, by Application 2019 & 2032
- Table 14: China Asia Pacific Nuclear Imaging Devices Market Volume (K Unit) Forecast, by Application 2019 & 2032
- Table 15: Japan Asia Pacific Nuclear Imaging Devices Market Revenue (Million) Forecast, by Application 2019 & 2032
- Table 16: Japan Asia Pacific Nuclear Imaging Devices Market Volume (K Unit) Forecast, by Application 2019 & 2032
- Table 17: India Asia Pacific Nuclear Imaging Devices Market Revenue (Million) Forecast, by Application 2019 & 2032
- Table 18: India Asia Pacific Nuclear Imaging Devices Market Volume (K Unit) Forecast, by Application 2019 & 2032
- Table 19: South Korea Asia Pacific Nuclear Imaging Devices Market Revenue (Million) Forecast, by Application 2019 & 2032
- Table 20: South Korea Asia Pacific Nuclear Imaging Devices Market Volume (K Unit) Forecast, by Application 2019 & 2032
- Table 21: Taiwan Asia Pacific Nuclear Imaging Devices Market Revenue (Million) Forecast, by Application 2019 & 2032
- Table 22: Taiwan Asia Pacific Nuclear Imaging Devices Market Volume (K Unit) Forecast, by Application 2019 & 2032
- Table 23: Australia Asia Pacific Nuclear Imaging Devices Market Revenue (Million) Forecast, by Application 2019 & 2032
- Table 24: Australia Asia Pacific Nuclear Imaging Devices Market Volume (K Unit) Forecast, by Application 2019 & 2032
- Table 25: Rest of Asia-Pacific Asia Pacific Nuclear Imaging Devices Market Revenue (Million) Forecast, by Application 2019 & 2032
- Table 26: Rest of Asia-Pacific Asia Pacific Nuclear Imaging Devices Market Volume (K Unit) Forecast, by Application 2019 & 2032
- Table 27: Asia Pacific Nuclear Imaging Devices Market Revenue Million Forecast, by Product Type 2019 & 2032
- Table 28: Asia Pacific Nuclear Imaging Devices Market Volume K Unit Forecast, by Product Type 2019 & 2032
- Table 29: Asia Pacific Nuclear Imaging Devices Market Revenue Million Forecast, by Application 2019 & 2032
- Table 30: Asia Pacific Nuclear Imaging Devices Market Volume K Unit Forecast, by Application 2019 & 2032
- Table 31: Asia Pacific Nuclear Imaging Devices Market Revenue Million Forecast, by Geography 2019 & 2032
- Table 32: Asia Pacific Nuclear Imaging Devices Market Volume K Unit Forecast, by Geography 2019 & 2032
- Table 33: Asia Pacific Nuclear Imaging Devices Market Revenue Million Forecast, by Country 2019 & 2032
- Table 34: Asia Pacific Nuclear Imaging Devices Market Volume K Unit Forecast, by Country 2019 & 2032
- Table 35: China Asia Pacific Nuclear Imaging Devices Market Revenue (Million) Forecast, by Application 2019 & 2032
- Table 36: China Asia Pacific Nuclear Imaging Devices Market Volume (K Unit) Forecast, by Application 2019 & 2032
- Table 37: Japan Asia Pacific Nuclear Imaging Devices Market Revenue (Million) Forecast, by Application 2019 & 2032
- Table 38: Japan Asia Pacific Nuclear Imaging Devices Market Volume (K Unit) Forecast, by Application 2019 & 2032
- Table 39: India Asia Pacific Nuclear Imaging Devices Market Revenue (Million) Forecast, by Application 2019 & 2032
- Table 40: India Asia Pacific Nuclear Imaging Devices Market Volume (K Unit) Forecast, by Application 2019 & 2032
- Table 41: Australia Asia Pacific Nuclear Imaging Devices Market Revenue (Million) Forecast, by Application 2019 & 2032
- Table 42: Australia Asia Pacific Nuclear Imaging Devices Market Volume (K Unit) Forecast, by Application 2019 & 2032
- Table 43: South Korea Asia Pacific Nuclear Imaging Devices Market Revenue (Million) Forecast, by Application 2019 & 2032
- Table 44: South Korea Asia Pacific Nuclear Imaging Devices Market Volume (K Unit) Forecast, by Application 2019 & 2032
- Table 45: Rest of Asia Pacific Asia Pacific Nuclear Imaging Devices Market Revenue (Million) Forecast, by Application 2019 & 2032
- Table 46: Rest of Asia Pacific Asia Pacific Nuclear Imaging Devices Market Volume (K Unit) Forecast, by Application 2019 & 2032
Frequently Asked Questions
1. What is the projected Compound Annual Growth Rate (CAGR) of the Asia Pacific Nuclear Imaging Devices Market?
The projected CAGR is approximately 4.23%.
2. Which companies are prominent players in the Asia Pacific Nuclear Imaging Devices Market?
Key companies in the market include Urenco, Siemens Healthineers, GE Healthcare, Bracco Imaging SpA, Neusoft Medical Systems Co Ltd, Koninklijke Philips NV, Canon Medical Systems Corporation, Taiyo Nippon Sanso, MiE GmbH.
3. What are the main segments of the Asia Pacific Nuclear Imaging Devices Market?
The market segments include Product Type, Application, Geography.
4. Can you provide details about the market size?
The market size is estimated to be USD 1.52 Million as of 2022.
5. What are some drivers contributing to market growth?
; Rise in Prevalence of Cancer and Cardiac Disorders; Increase in Technological Advancements.
6. What are the notable trends driving market growth?
Cardiology is Expected to Hold the Highest Market Share in the Region.
7. Are there any restraints impacting market growth?
; Limited Reimbursement and Stringent Regulatory Procedures.
8. Can you provide examples of recent developments in the market?
N/A
9. What pricing options are available for accessing the report?
Pricing options include single-user, multi-user, and enterprise licenses priced at USD 4750, USD 5250, and USD 8750 respectively.
10. Is the market size provided in terms of value or volume?
The market size is provided in terms of value, measured in Million and volume, measured in K Unit.
11. Are there any specific market keywords associated with the report?
Yes, the market keyword associated with the report is "Asia Pacific Nuclear Imaging Devices Market," which aids in identifying and referencing the specific market segment covered.
12. How do I determine which pricing option suits my needs best?
The pricing options vary based on user requirements and access needs. Individual users may opt for single-user licenses, while businesses requiring broader access may choose multi-user or enterprise licenses for cost-effective access to the report.
13. Are there any additional resources or data provided in the Asia Pacific Nuclear Imaging Devices Market report?
While the report offers comprehensive insights, it's advisable to review the specific contents or supplementary materials provided to ascertain if additional resources or data are available.
14. How can I stay updated on further developments or reports in the Asia Pacific Nuclear Imaging Devices Market?
To stay informed about further developments, trends, and reports in the Asia Pacific Nuclear Imaging Devices Market, consider subscribing to industry newsletters, following relevant companies and organizations, or regularly checking reputable industry news sources and publications.
Methodology
Step 1 - Identification of Relevant Samples Size from Population Database


Step 2 - Approaches for Defining Global Market Size (Value, Volume* & Price*)

Note*: In applicable scenarios
Step 3 - Data Sources
Primary Research
- Web Analytics
- Survey Reports
- Research Institute
- Latest Research Reports
- Opinion Leaders
Secondary Research
- Annual Reports
- White Paper
- Latest Press Release
- Industry Association
- Paid Database
- Investor Presentations

Step 4 - Data Triangulation
Involves using different sources of information in order to increase the validity of a study
These sources are likely to be stakeholders in a program - participants, other researchers, program staff, other community members, and so on.
Then we put all data in single framework & apply various statistical tools to find out the dynamic on the market.
During the analysis stage, feedback from the stakeholder groups would be compared to determine areas of agreement as well as areas of divergence
