

Key Insights
The Asia-Pacific (APAC) patient monitoring market is experiencing robust growth, driven by factors such as rising prevalence of chronic diseases, an aging population, increasing healthcare expenditure, and expanding healthcare infrastructure across the region. Technological advancements in remote patient monitoring (RPM) devices, coupled with increasing government initiatives promoting telehealth and home healthcare, are further fueling market expansion. Specifically, countries like China, India, and Japan are significant contributors to this growth, exhibiting a strong demand for advanced patient monitoring solutions across hospitals, clinics, and home healthcare settings. The increasing adoption of minimally invasive procedures and the rising demand for improved patient care are key factors driving the demand for sophisticated patient monitoring devices, including hemodynamic, cardiac, and respiratory monitoring systems. The market is segmented by device type (hemodynamic, neuromonitoring, cardiac, etc.), end-user (hospitals, home healthcare, etc.), and application (cardiology, neurology, etc.), each segment contributing uniquely to the overall growth trajectory. Competition is intensifying with both established international players and emerging local companies vying for market share.
The forecast period (2025-2033) anticipates continued expansion, with the CAGR of 7.25% suggesting a substantial increase in market value. This growth will be influenced by the ongoing adoption of advanced technologies like artificial intelligence (AI) and the Internet of Medical Things (IoMT) in patient monitoring systems, enabling proactive healthcare management and improved patient outcomes. While challenges such as high costs of advanced technologies and regulatory hurdles in certain countries exist, the overall market outlook remains positive, fueled by the increasing healthcare awareness and the governments’ continuous investments in improving healthcare infrastructure and accessibility across the APAC region. The diverse healthcare landscape and varying levels of technological adoption across different APAC countries present both opportunities and complexities for market players, requiring strategic adaptations to effectively target specific segments and regions.
APAC Patient Monitoring Industry: A Comprehensive Market Report (2019-2033)
This insightful report provides a detailed analysis of the Asia-Pacific (APAC) patient monitoring industry, offering a comprehensive overview of market trends, leading players, and future growth opportunities. Covering the period 2019-2033, with a base year of 2025, this report is an essential resource for stakeholders seeking to understand and capitalize on this dynamic market. The APAC patient monitoring market is projected to reach xx Million by 2033, demonstrating significant growth potential.
APAC Patient Monitoring Industry Market Composition & Trends
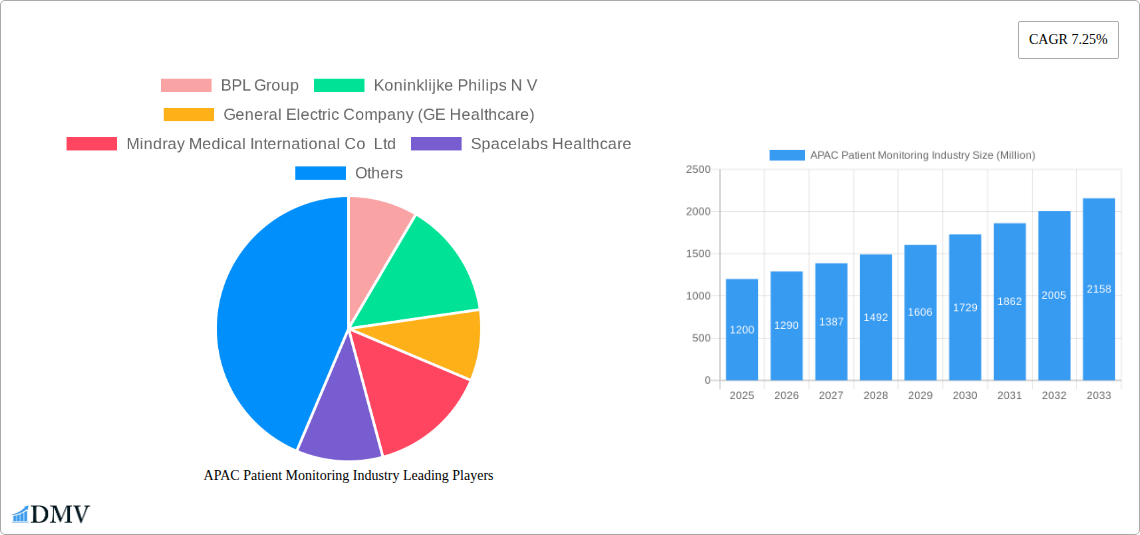
The APAC patient monitoring market is characterized by a moderately concentrated landscape, with key players like Koninklijke Philips N V, General Electric Company (GE Healthcare), Mindray Medical International Co Ltd, and Nihon Kohden Corporation holding significant market share. Market share distribution fluctuates based on product innovation and strategic partnerships. Innovation is driven by advancements in remote patient monitoring (RPM) technologies, artificial intelligence (AI) integration for diagnostics, and the increasing demand for wearable patient monitoring devices. The regulatory landscape, varying across APAC nations, influences market access and product approvals. Substitute products, such as traditional methods of patient observation, pose a competitive challenge but are gradually being replaced due to improvements in accuracy and efficiency. Mergers and acquisitions (M&A) activities are relatively frequent, with deal values often exceeding xx Million, reflecting the strategic importance of consolidating market positions and expanding product portfolios. End-users predominantly consist of hospitals and clinics, followed by home healthcare and other end-users, shaping the demand for specific devices and services.
- Market Concentration: Moderately concentrated, with top 5 players holding approximately xx% market share in 2024.
- Innovation Catalysts: AI integration, RPM technologies, wearable devices.
- Regulatory Landscape: Varied across APAC nations, impacting market access.
- M&A Activity: Frequent, with deal values exceeding xx Million in recent years.
- End-User Profile: Hospitals and clinics (xx%), Home Healthcare (xx%), Other (xx%).
APAC Patient Monitoring Industry Industry Evolution
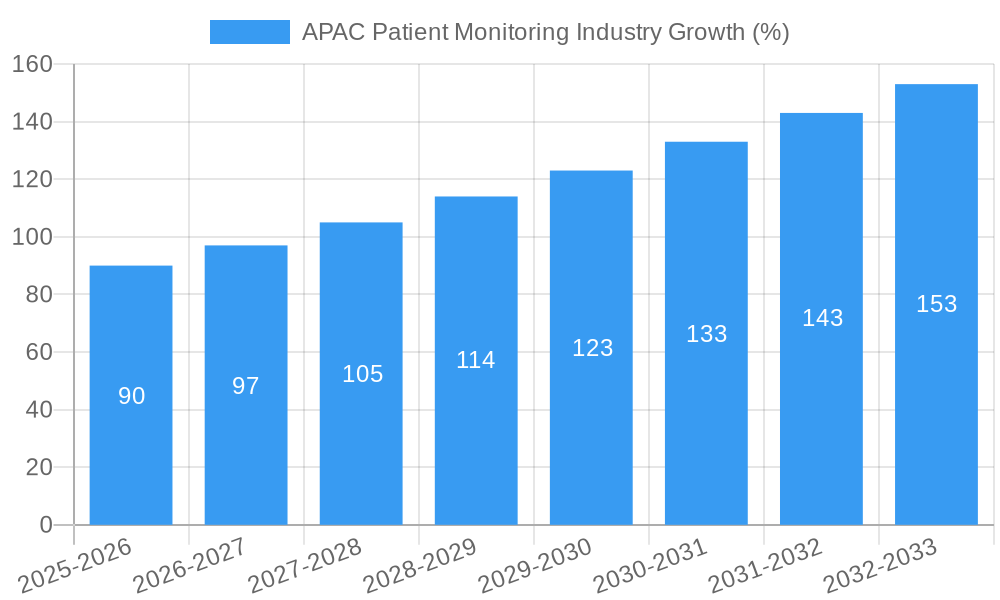
The APAC patient monitoring market has experienced robust growth from 2019 to 2024, with a Compound Annual Growth Rate (CAGR) of xx%. This growth is primarily fueled by increasing prevalence of chronic diseases, rising healthcare expenditure, technological advancements, and improving healthcare infrastructure across the region. The adoption of advanced technologies such as telehealth and remote patient monitoring is accelerating, driving demand for sophisticated devices like multi-parameter monitors and remote patient monitoring systems. Consumer demands are shifting towards personalized, convenient, and cost-effective monitoring solutions, creating opportunities for innovative product offerings. Furthermore, government initiatives promoting healthcare digitization and the increasing awareness among the population regarding preventive healthcare are creating a positive environment for market expansion. The market is expected to continue its upward trajectory, with projected CAGRs of xx% during the forecast period (2025-2033), driven by several factors including the rising geriatric population and increasing focus on early disease detection and preventive healthcare measures.
Leading Regions, Countries, or Segments in APAC Patient Monitoring Industry
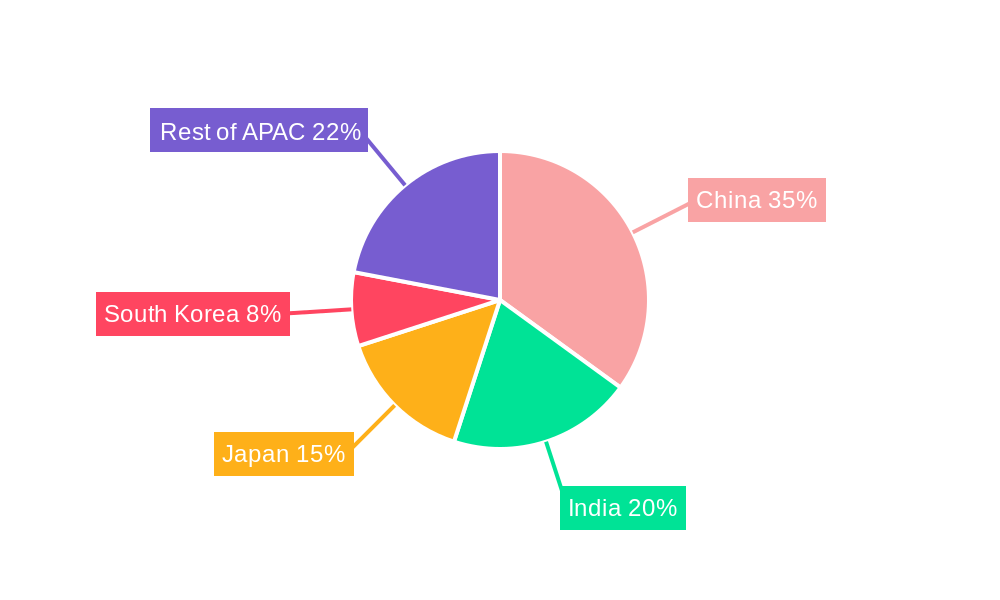
The APAC patient monitoring market is dominated by several key regions and segments. Hospitals and Clinics remain the largest end-user segment, driven by higher adoption rates of advanced monitoring technologies and the need for continuous patient surveillance. Within device types, Cardiac Monitoring Devices and Multi-parameter Monitors command significant market share, reflecting the prevalence of cardiovascular diseases and the necessity for comprehensive patient monitoring across various clinical settings. Among applications, Cardiology holds a leading position, followed by Neurology and Respiratory applications. China and India emerge as leading countries due to their large populations, increasing healthcare expenditure, and supportive government policies.
- Key Drivers:
- Investment Trends: Significant investments in healthcare infrastructure and technological advancements.
- Regulatory Support: Government initiatives promoting digital healthcare and medical device manufacturing (e.g., India's PLI scheme).
- Rising Prevalence of Chronic Diseases: High incidence of cardiovascular diseases, diabetes, and respiratory illnesses.
The dominance of these segments is primarily attributable to factors such as substantial investments in healthcare infrastructure, supportive government policies promoting advanced medical technologies, and the increasing prevalence of chronic diseases necessitating continuous monitoring.
APAC Patient Monitoring Industry Product Innovations
Recent years have witnessed significant innovations in the APAC patient monitoring market. The integration of AI and machine learning algorithms allows for improved diagnostic accuracy and early detection of adverse events. Miniaturization and wireless connectivity have facilitated the development of wearable and portable devices, enhancing patient comfort and mobility. Cloud-based platforms enable remote monitoring and data sharing, optimizing healthcare delivery. These innovations offer unique selling propositions, such as enhanced accuracy, improved patient experience, and cost-effectiveness.
Propelling Factors for APAP Patient Monitoring Industry Growth
Several factors contribute to the growth of the APAC patient monitoring industry. Technological advancements, such as AI-powered diagnostics and wearable sensors, are significantly enhancing the capabilities of monitoring devices. Expanding healthcare infrastructure and increasing government investments are fueling market expansion. Favorable regulatory frameworks promoting medical device adoption and telehealth services further boost the market. Moreover, rising disposable incomes and increasing health awareness among the population are driving the demand for advanced patient monitoring solutions.
Obstacles in the APAP Patient Monitoring Industry Market
The APAC patient monitoring market faces certain challenges. Regulatory hurdles related to device approvals and reimbursement policies can hinder market penetration. Supply chain disruptions and fluctuations in raw material costs can impact production and pricing. Intense competition among established players and emerging companies puts pressure on pricing and profitability. The lack of skilled professionals in certain regions limits the effective implementation of advanced monitoring technologies. These factors collectively impede market growth to some extent.
Future Opportunities in APAC Patient Monitoring Industry
The APAC patient monitoring market presents significant opportunities. Expansion into underserved rural areas presents a substantial potential market. The adoption of innovative technologies, such as the Internet of Medical Things (IoMT), promises improved patient outcomes and efficiency. Growing demand for personalized healthcare solutions and remote monitoring creates opportunities for tailored device development. Focusing on preventive healthcare and early disease detection presents an avenue for market growth.
Major Players in the APAC Patient Monitoring Industry Ecosystem
- BPL Group
- Koninklijke Philips N V
- General Electric Company (GE Healthcare)
- Mindray Medical International Co Ltd
- Spacelabs Healthcare
- Nihon Kohden Corporation
- Dragerwerk AG
- Schiller
- Siemens Healthcare GmBH
Key Developments in APAC Patient Monitoring Industry Industry
- October 2022: Apollo Hospitals launched an indigenously developed automated, rapid-response patient monitoring system, enhancing the domestic capabilities and potentially lowering costs.
- March 2022: Wipro GE Healthcare launched a new manufacturing facility in Bengaluru, India, under the PLI scheme, boosting local production of neurology monitoring devices and aligning with the 'Atmanirbhar Bharat' initiative.
Strategic APAC Patient Monitoring Industry Market Forecast
The APAC patient monitoring market is poised for sustained growth driven by technological innovation, expanding healthcare infrastructure, and increasing focus on preventive healthcare. The integration of AI, IoT, and cloud technologies will enhance the capabilities of monitoring devices, leading to improved patient outcomes and more efficient healthcare delivery. The market's continued expansion offers significant opportunities for both established players and new entrants, promising robust growth and substantial returns in the coming years.
APAC Patient Monitoring Industry Segmentation
-
1. Type of Device
- 1.1. Hemodynamic Monitoring Devices
- 1.2. Neuromonitoring Devices
- 1.3. Cardiac Monitoring Devices
- 1.4. Multi-parameter Monitors
- 1.5. Respiratory Monitoring Devices
- 1.6. Remote Patient Monitoring Devices
- 1.7. Other Types of Devices
-
2. Application
- 2.1. Cardiology
- 2.2. Neurology
- 2.3. Respiratory
- 2.4. Fetal and Neonatal
- 2.5. Weight Management and Fitness Monitoring
- 2.6. Other Applications
-
3. End-Users
- 3.1. Home Healthcare
- 3.2. Hospitals and Clinics
- 3.3. Other End-Users
-
4. Geography
- 4.1. China
- 4.2. Japan
- 4.3. India
- 4.4. Australia
- 4.5. South Korea
- 4.6. Rest of Asia-Pacific
APAC Patient Monitoring Industry Segmentation By Geography
- 1. China
- 2. Japan
- 3. India
- 4. Australia
- 5. South Korea
- 6. Rest of Asia Pacific
APAC Patient Monitoring Industry REPORT HIGHLIGHTS
| Aspects | Details |
|---|---|
| Study Period | 2019-2033 |
| Base Year | 2024 |
| Estimated Year | 2025 |
| Forecast Period | 2025-2033 |
| Historical Period | 2019-2024 |
| Growth Rate | CAGR of 7.25% from 2019-2033 |
| Segmentation |
|
Table of Contents
- 1. Introduction
- 1.1. Research Scope
- 1.2. Market Segmentation
- 1.3. Research Methodology
- 1.4. Definitions and Assumptions
- 2. Executive Summary
- 2.1. Introduction
- 3. Market Dynamics
- 3.1. Introduction
- 3.2. Market Drivers
- 3.2.1. Rising Incidences of Chronic Diseases; Increasing Preference for Home and Remote Monitoring
- 3.3. Market Restrains
- 3.3.1. High Cost of Devices
- 3.4. Market Trends
- 3.4.1. Remote Patient Monitoring Devices is Expected to Show a Significant Growth Rate Over the Forecast Period
- 4. Market Factor Analysis
- 4.1. Porters Five Forces
- 4.2. Supply/Value Chain
- 4.3. PESTEL analysis
- 4.4. Market Entropy
- 4.5. Patent/Trademark Analysis
- 5. Global APAC Patient Monitoring Industry Analysis, Insights and Forecast, 2019-2031
- 5.1. Market Analysis, Insights and Forecast - by Type of Device
- 5.1.1. Hemodynamic Monitoring Devices
- 5.1.2. Neuromonitoring Devices
- 5.1.3. Cardiac Monitoring Devices
- 5.1.4. Multi-parameter Monitors
- 5.1.5. Respiratory Monitoring Devices
- 5.1.6. Remote Patient Monitoring Devices
- 5.1.7. Other Types of Devices
- 5.2. Market Analysis, Insights and Forecast - by Application
- 5.2.1. Cardiology
- 5.2.2. Neurology
- 5.2.3. Respiratory
- 5.2.4. Fetal and Neonatal
- 5.2.5. Weight Management and Fitness Monitoring
- 5.2.6. Other Applications
- 5.3. Market Analysis, Insights and Forecast - by End-Users
- 5.3.1. Home Healthcare
- 5.3.2. Hospitals and Clinics
- 5.3.3. Other End-Users
- 5.4. Market Analysis, Insights and Forecast - by Geography
- 5.4.1. China
- 5.4.2. Japan
- 5.4.3. India
- 5.4.4. Australia
- 5.4.5. South Korea
- 5.4.6. Rest of Asia-Pacific
- 5.5. Market Analysis, Insights and Forecast - by Region
- 5.5.1. China
- 5.5.2. Japan
- 5.5.3. India
- 5.5.4. Australia
- 5.5.5. South Korea
- 5.5.6. Rest of Asia Pacific
- 5.1. Market Analysis, Insights and Forecast - by Type of Device
- 6. China APAC Patient Monitoring Industry Analysis, Insights and Forecast, 2019-2031
- 6.1. Market Analysis, Insights and Forecast - by Type of Device
- 6.1.1. Hemodynamic Monitoring Devices
- 6.1.2. Neuromonitoring Devices
- 6.1.3. Cardiac Monitoring Devices
- 6.1.4. Multi-parameter Monitors
- 6.1.5. Respiratory Monitoring Devices
- 6.1.6. Remote Patient Monitoring Devices
- 6.1.7. Other Types of Devices
- 6.2. Market Analysis, Insights and Forecast - by Application
- 6.2.1. Cardiology
- 6.2.2. Neurology
- 6.2.3. Respiratory
- 6.2.4. Fetal and Neonatal
- 6.2.5. Weight Management and Fitness Monitoring
- 6.2.6. Other Applications
- 6.3. Market Analysis, Insights and Forecast - by End-Users
- 6.3.1. Home Healthcare
- 6.3.2. Hospitals and Clinics
- 6.3.3. Other End-Users
- 6.4. Market Analysis, Insights and Forecast - by Geography
- 6.4.1. China
- 6.4.2. Japan
- 6.4.3. India
- 6.4.4. Australia
- 6.4.5. South Korea
- 6.4.6. Rest of Asia-Pacific
- 6.1. Market Analysis, Insights and Forecast - by Type of Device
- 7. Japan APAC Patient Monitoring Industry Analysis, Insights and Forecast, 2019-2031
- 7.1. Market Analysis, Insights and Forecast - by Type of Device
- 7.1.1. Hemodynamic Monitoring Devices
- 7.1.2. Neuromonitoring Devices
- 7.1.3. Cardiac Monitoring Devices
- 7.1.4. Multi-parameter Monitors
- 7.1.5. Respiratory Monitoring Devices
- 7.1.6. Remote Patient Monitoring Devices
- 7.1.7. Other Types of Devices
- 7.2. Market Analysis, Insights and Forecast - by Application
- 7.2.1. Cardiology
- 7.2.2. Neurology
- 7.2.3. Respiratory
- 7.2.4. Fetal and Neonatal
- 7.2.5. Weight Management and Fitness Monitoring
- 7.2.6. Other Applications
- 7.3. Market Analysis, Insights and Forecast - by End-Users
- 7.3.1. Home Healthcare
- 7.3.2. Hospitals and Clinics
- 7.3.3. Other End-Users
- 7.4. Market Analysis, Insights and Forecast - by Geography
- 7.4.1. China
- 7.4.2. Japan
- 7.4.3. India
- 7.4.4. Australia
- 7.4.5. South Korea
- 7.4.6. Rest of Asia-Pacific
- 7.1. Market Analysis, Insights and Forecast - by Type of Device
- 8. India APAC Patient Monitoring Industry Analysis, Insights and Forecast, 2019-2031
- 8.1. Market Analysis, Insights and Forecast - by Type of Device
- 8.1.1. Hemodynamic Monitoring Devices
- 8.1.2. Neuromonitoring Devices
- 8.1.3. Cardiac Monitoring Devices
- 8.1.4. Multi-parameter Monitors
- 8.1.5. Respiratory Monitoring Devices
- 8.1.6. Remote Patient Monitoring Devices
- 8.1.7. Other Types of Devices
- 8.2. Market Analysis, Insights and Forecast - by Application
- 8.2.1. Cardiology
- 8.2.2. Neurology
- 8.2.3. Respiratory
- 8.2.4. Fetal and Neonatal
- 8.2.5. Weight Management and Fitness Monitoring
- 8.2.6. Other Applications
- 8.3. Market Analysis, Insights and Forecast - by End-Users
- 8.3.1. Home Healthcare
- 8.3.2. Hospitals and Clinics
- 8.3.3. Other End-Users
- 8.4. Market Analysis, Insights and Forecast - by Geography
- 8.4.1. China
- 8.4.2. Japan
- 8.4.3. India
- 8.4.4. Australia
- 8.4.5. South Korea
- 8.4.6. Rest of Asia-Pacific
- 8.1. Market Analysis, Insights and Forecast - by Type of Device
- 9. Australia APAC Patient Monitoring Industry Analysis, Insights and Forecast, 2019-2031
- 9.1. Market Analysis, Insights and Forecast - by Type of Device
- 9.1.1. Hemodynamic Monitoring Devices
- 9.1.2. Neuromonitoring Devices
- 9.1.3. Cardiac Monitoring Devices
- 9.1.4. Multi-parameter Monitors
- 9.1.5. Respiratory Monitoring Devices
- 9.1.6. Remote Patient Monitoring Devices
- 9.1.7. Other Types of Devices
- 9.2. Market Analysis, Insights and Forecast - by Application
- 9.2.1. Cardiology
- 9.2.2. Neurology
- 9.2.3. Respiratory
- 9.2.4. Fetal and Neonatal
- 9.2.5. Weight Management and Fitness Monitoring
- 9.2.6. Other Applications
- 9.3. Market Analysis, Insights and Forecast - by End-Users
- 9.3.1. Home Healthcare
- 9.3.2. Hospitals and Clinics
- 9.3.3. Other End-Users
- 9.4. Market Analysis, Insights and Forecast - by Geography
- 9.4.1. China
- 9.4.2. Japan
- 9.4.3. India
- 9.4.4. Australia
- 9.4.5. South Korea
- 9.4.6. Rest of Asia-Pacific
- 9.1. Market Analysis, Insights and Forecast - by Type of Device
- 10. South Korea APAC Patient Monitoring Industry Analysis, Insights and Forecast, 2019-2031
- 10.1. Market Analysis, Insights and Forecast - by Type of Device
- 10.1.1. Hemodynamic Monitoring Devices
- 10.1.2. Neuromonitoring Devices
- 10.1.3. Cardiac Monitoring Devices
- 10.1.4. Multi-parameter Monitors
- 10.1.5. Respiratory Monitoring Devices
- 10.1.6. Remote Patient Monitoring Devices
- 10.1.7. Other Types of Devices
- 10.2. Market Analysis, Insights and Forecast - by Application
- 10.2.1. Cardiology
- 10.2.2. Neurology
- 10.2.3. Respiratory
- 10.2.4. Fetal and Neonatal
- 10.2.5. Weight Management and Fitness Monitoring
- 10.2.6. Other Applications
- 10.3. Market Analysis, Insights and Forecast - by End-Users
- 10.3.1. Home Healthcare
- 10.3.2. Hospitals and Clinics
- 10.3.3. Other End-Users
- 10.4. Market Analysis, Insights and Forecast - by Geography
- 10.4.1. China
- 10.4.2. Japan
- 10.4.3. India
- 10.4.4. Australia
- 10.4.5. South Korea
- 10.4.6. Rest of Asia-Pacific
- 10.1. Market Analysis, Insights and Forecast - by Type of Device
- 11. Rest of Asia Pacific APAC Patient Monitoring Industry Analysis, Insights and Forecast, 2019-2031
- 11.1. Market Analysis, Insights and Forecast - by Type of Device
- 11.1.1. Hemodynamic Monitoring Devices
- 11.1.2. Neuromonitoring Devices
- 11.1.3. Cardiac Monitoring Devices
- 11.1.4. Multi-parameter Monitors
- 11.1.5. Respiratory Monitoring Devices
- 11.1.6. Remote Patient Monitoring Devices
- 11.1.7. Other Types of Devices
- 11.2. Market Analysis, Insights and Forecast - by Application
- 11.2.1. Cardiology
- 11.2.2. Neurology
- 11.2.3. Respiratory
- 11.2.4. Fetal and Neonatal
- 11.2.5. Weight Management and Fitness Monitoring
- 11.2.6. Other Applications
- 11.3. Market Analysis, Insights and Forecast - by End-Users
- 11.3.1. Home Healthcare
- 11.3.2. Hospitals and Clinics
- 11.3.3. Other End-Users
- 11.4. Market Analysis, Insights and Forecast - by Geography
- 11.4.1. China
- 11.4.2. Japan
- 11.4.3. India
- 11.4.4. Australia
- 11.4.5. South Korea
- 11.4.6. Rest of Asia-Pacific
- 11.1. Market Analysis, Insights and Forecast - by Type of Device
- 12. North America APAC Patient Monitoring Industry Analysis, Insights and Forecast, 2019-2031
- 12.1. Market Analysis, Insights and Forecast - By Country/Sub-region
- 12.1.1 United States
- 12.1.2 Canada
- 12.1.3 Mexico
- 13. Europe APAC Patient Monitoring Industry Analysis, Insights and Forecast, 2019-2031
- 13.1. Market Analysis, Insights and Forecast - By Country/Sub-region
- 13.1.1 Germany
- 13.1.2 United Kingdom
- 13.1.3 France
- 13.1.4 Spain
- 13.1.5 Italy
- 13.1.6 Spain
- 13.1.7 Belgium
- 13.1.8 Netherland
- 13.1.9 Nordics
- 13.1.10 Rest of Europe
- 14. Asia Pacific APAC Patient Monitoring Industry Analysis, Insights and Forecast, 2019-2031
- 14.1. Market Analysis, Insights and Forecast - By Country/Sub-region
- 14.1.1 China
- 14.1.2 Japan
- 14.1.3 India
- 14.1.4 South Korea
- 14.1.5 Southeast Asia
- 14.1.6 Australia
- 14.1.7 Indonesia
- 14.1.8 Phillipes
- 14.1.9 Singapore
- 14.1.10 Thailandc
- 14.1.11 Rest of Asia Pacific
- 15. South America APAC Patient Monitoring Industry Analysis, Insights and Forecast, 2019-2031
- 15.1. Market Analysis, Insights and Forecast - By Country/Sub-region
- 15.1.1 Brazil
- 15.1.2 Argentina
- 15.1.3 Peru
- 15.1.4 Chile
- 15.1.5 Colombia
- 15.1.6 Ecuador
- 15.1.7 Venezuela
- 15.1.8 Rest of South America
- 16. MEA APAC Patient Monitoring Industry Analysis, Insights and Forecast, 2019-2031
- 16.1. Market Analysis, Insights and Forecast - By Country/Sub-region
- 16.1.1 United Arab Emirates
- 16.1.2 Saudi Arabia
- 16.1.3 South Africa
- 16.1.4 Rest of Middle East and Africa
- 17. Competitive Analysis
- 17.1. Global Market Share Analysis 2024
- 17.2. Company Profiles
- 17.2.1 BPL Group
- 17.2.1.1. Overview
- 17.2.1.2. Products
- 17.2.1.3. SWOT Analysis
- 17.2.1.4. Recent Developments
- 17.2.1.5. Financials (Based on Availability)
- 17.2.2 Koninklijke Philips N V
- 17.2.2.1. Overview
- 17.2.2.2. Products
- 17.2.2.3. SWOT Analysis
- 17.2.2.4. Recent Developments
- 17.2.2.5. Financials (Based on Availability)
- 17.2.3 General Electric Company (GE Healthcare)
- 17.2.3.1. Overview
- 17.2.3.2. Products
- 17.2.3.3. SWOT Analysis
- 17.2.3.4. Recent Developments
- 17.2.3.5. Financials (Based on Availability)
- 17.2.4 Mindray Medical International Co Ltd
- 17.2.4.1. Overview
- 17.2.4.2. Products
- 17.2.4.3. SWOT Analysis
- 17.2.4.4. Recent Developments
- 17.2.4.5. Financials (Based on Availability)
- 17.2.5 Spacelabs Healthcare
- 17.2.5.1. Overview
- 17.2.5.2. Products
- 17.2.5.3. SWOT Analysis
- 17.2.5.4. Recent Developments
- 17.2.5.5. Financials (Based on Availability)
- 17.2.6 Nihon Kohden Corporation
- 17.2.6.1. Overview
- 17.2.6.2. Products
- 17.2.6.3. SWOT Analysis
- 17.2.6.4. Recent Developments
- 17.2.6.5. Financials (Based on Availability)
- 17.2.7 Dragerwerk AG
- 17.2.7.1. Overview
- 17.2.7.2. Products
- 17.2.7.3. SWOT Analysis
- 17.2.7.4. Recent Developments
- 17.2.7.5. Financials (Based on Availability)
- 17.2.8 Schiller
- 17.2.8.1. Overview
- 17.2.8.2. Products
- 17.2.8.3. SWOT Analysis
- 17.2.8.4. Recent Developments
- 17.2.8.5. Financials (Based on Availability)
- 17.2.9 Siemens Healthcare GmBH
- 17.2.9.1. Overview
- 17.2.9.2. Products
- 17.2.9.3. SWOT Analysis
- 17.2.9.4. Recent Developments
- 17.2.9.5. Financials (Based on Availability)
- 17.2.1 BPL Group
List of Figures
- Figure 1: Global APAC Patient Monitoring Industry Revenue Breakdown (Million, %) by Region 2024 & 2032
- Figure 2: Global APAC Patient Monitoring Industry Volume Breakdown (K Units, %) by Region 2024 & 2032
- Figure 3: North America APAC Patient Monitoring Industry Revenue (Million), by Country 2024 & 2032
- Figure 4: North America APAC Patient Monitoring Industry Volume (K Units), by Country 2024 & 2032
- Figure 5: North America APAC Patient Monitoring Industry Revenue Share (%), by Country 2024 & 2032
- Figure 6: North America APAC Patient Monitoring Industry Volume Share (%), by Country 2024 & 2032
- Figure 7: Europe APAC Patient Monitoring Industry Revenue (Million), by Country 2024 & 2032
- Figure 8: Europe APAC Patient Monitoring Industry Volume (K Units), by Country 2024 & 2032
- Figure 9: Europe APAC Patient Monitoring Industry Revenue Share (%), by Country 2024 & 2032
- Figure 10: Europe APAC Patient Monitoring Industry Volume Share (%), by Country 2024 & 2032
- Figure 11: Asia Pacific APAC Patient Monitoring Industry Revenue (Million), by Country 2024 & 2032
- Figure 12: Asia Pacific APAC Patient Monitoring Industry Volume (K Units), by Country 2024 & 2032
- Figure 13: Asia Pacific APAC Patient Monitoring Industry Revenue Share (%), by Country 2024 & 2032
- Figure 14: Asia Pacific APAC Patient Monitoring Industry Volume Share (%), by Country 2024 & 2032
- Figure 15: South America APAC Patient Monitoring Industry Revenue (Million), by Country 2024 & 2032
- Figure 16: South America APAC Patient Monitoring Industry Volume (K Units), by Country 2024 & 2032
- Figure 17: South America APAC Patient Monitoring Industry Revenue Share (%), by Country 2024 & 2032
- Figure 18: South America APAC Patient Monitoring Industry Volume Share (%), by Country 2024 & 2032
- Figure 19: MEA APAC Patient Monitoring Industry Revenue (Million), by Country 2024 & 2032
- Figure 20: MEA APAC Patient Monitoring Industry Volume (K Units), by Country 2024 & 2032
- Figure 21: MEA APAC Patient Monitoring Industry Revenue Share (%), by Country 2024 & 2032
- Figure 22: MEA APAC Patient Monitoring Industry Volume Share (%), by Country 2024 & 2032
- Figure 23: China APAC Patient Monitoring Industry Revenue (Million), by Type of Device 2024 & 2032
- Figure 24: China APAC Patient Monitoring Industry Volume (K Units), by Type of Device 2024 & 2032
- Figure 25: China APAC Patient Monitoring Industry Revenue Share (%), by Type of Device 2024 & 2032
- Figure 26: China APAC Patient Monitoring Industry Volume Share (%), by Type of Device 2024 & 2032
- Figure 27: China APAC Patient Monitoring Industry Revenue (Million), by Application 2024 & 2032
- Figure 28: China APAC Patient Monitoring Industry Volume (K Units), by Application 2024 & 2032
- Figure 29: China APAC Patient Monitoring Industry Revenue Share (%), by Application 2024 & 2032
- Figure 30: China APAC Patient Monitoring Industry Volume Share (%), by Application 2024 & 2032
- Figure 31: China APAC Patient Monitoring Industry Revenue (Million), by End-Users 2024 & 2032
- Figure 32: China APAC Patient Monitoring Industry Volume (K Units), by End-Users 2024 & 2032
- Figure 33: China APAC Patient Monitoring Industry Revenue Share (%), by End-Users 2024 & 2032
- Figure 34: China APAC Patient Monitoring Industry Volume Share (%), by End-Users 2024 & 2032
- Figure 35: China APAC Patient Monitoring Industry Revenue (Million), by Geography 2024 & 2032
- Figure 36: China APAC Patient Monitoring Industry Volume (K Units), by Geography 2024 & 2032
- Figure 37: China APAC Patient Monitoring Industry Revenue Share (%), by Geography 2024 & 2032
- Figure 38: China APAC Patient Monitoring Industry Volume Share (%), by Geography 2024 & 2032
- Figure 39: China APAC Patient Monitoring Industry Revenue (Million), by Country 2024 & 2032
- Figure 40: China APAC Patient Monitoring Industry Volume (K Units), by Country 2024 & 2032
- Figure 41: China APAC Patient Monitoring Industry Revenue Share (%), by Country 2024 & 2032
- Figure 42: China APAC Patient Monitoring Industry Volume Share (%), by Country 2024 & 2032
- Figure 43: Japan APAC Patient Monitoring Industry Revenue (Million), by Type of Device 2024 & 2032
- Figure 44: Japan APAC Patient Monitoring Industry Volume (K Units), by Type of Device 2024 & 2032
- Figure 45: Japan APAC Patient Monitoring Industry Revenue Share (%), by Type of Device 2024 & 2032
- Figure 46: Japan APAC Patient Monitoring Industry Volume Share (%), by Type of Device 2024 & 2032
- Figure 47: Japan APAC Patient Monitoring Industry Revenue (Million), by Application 2024 & 2032
- Figure 48: Japan APAC Patient Monitoring Industry Volume (K Units), by Application 2024 & 2032
- Figure 49: Japan APAC Patient Monitoring Industry Revenue Share (%), by Application 2024 & 2032
- Figure 50: Japan APAC Patient Monitoring Industry Volume Share (%), by Application 2024 & 2032
- Figure 51: Japan APAC Patient Monitoring Industry Revenue (Million), by End-Users 2024 & 2032
- Figure 52: Japan APAC Patient Monitoring Industry Volume (K Units), by End-Users 2024 & 2032
- Figure 53: Japan APAC Patient Monitoring Industry Revenue Share (%), by End-Users 2024 & 2032
- Figure 54: Japan APAC Patient Monitoring Industry Volume Share (%), by End-Users 2024 & 2032
- Figure 55: Japan APAC Patient Monitoring Industry Revenue (Million), by Geography 2024 & 2032
- Figure 56: Japan APAC Patient Monitoring Industry Volume (K Units), by Geography 2024 & 2032
- Figure 57: Japan APAC Patient Monitoring Industry Revenue Share (%), by Geography 2024 & 2032
- Figure 58: Japan APAC Patient Monitoring Industry Volume Share (%), by Geography 2024 & 2032
- Figure 59: Japan APAC Patient Monitoring Industry Revenue (Million), by Country 2024 & 2032
- Figure 60: Japan APAC Patient Monitoring Industry Volume (K Units), by Country 2024 & 2032
- Figure 61: Japan APAC Patient Monitoring Industry Revenue Share (%), by Country 2024 & 2032
- Figure 62: Japan APAC Patient Monitoring Industry Volume Share (%), by Country 2024 & 2032
- Figure 63: India APAC Patient Monitoring Industry Revenue (Million), by Type of Device 2024 & 2032
- Figure 64: India APAC Patient Monitoring Industry Volume (K Units), by Type of Device 2024 & 2032
- Figure 65: India APAC Patient Monitoring Industry Revenue Share (%), by Type of Device 2024 & 2032
- Figure 66: India APAC Patient Monitoring Industry Volume Share (%), by Type of Device 2024 & 2032
- Figure 67: India APAC Patient Monitoring Industry Revenue (Million), by Application 2024 & 2032
- Figure 68: India APAC Patient Monitoring Industry Volume (K Units), by Application 2024 & 2032
- Figure 69: India APAC Patient Monitoring Industry Revenue Share (%), by Application 2024 & 2032
- Figure 70: India APAC Patient Monitoring Industry Volume Share (%), by Application 2024 & 2032
- Figure 71: India APAC Patient Monitoring Industry Revenue (Million), by End-Users 2024 & 2032
- Figure 72: India APAC Patient Monitoring Industry Volume (K Units), by End-Users 2024 & 2032
- Figure 73: India APAC Patient Monitoring Industry Revenue Share (%), by End-Users 2024 & 2032
- Figure 74: India APAC Patient Monitoring Industry Volume Share (%), by End-Users 2024 & 2032
- Figure 75: India APAC Patient Monitoring Industry Revenue (Million), by Geography 2024 & 2032
- Figure 76: India APAC Patient Monitoring Industry Volume (K Units), by Geography 2024 & 2032
- Figure 77: India APAC Patient Monitoring Industry Revenue Share (%), by Geography 2024 & 2032
- Figure 78: India APAC Patient Monitoring Industry Volume Share (%), by Geography 2024 & 2032
- Figure 79: India APAC Patient Monitoring Industry Revenue (Million), by Country 2024 & 2032
- Figure 80: India APAC Patient Monitoring Industry Volume (K Units), by Country 2024 & 2032
- Figure 81: India APAC Patient Monitoring Industry Revenue Share (%), by Country 2024 & 2032
- Figure 82: India APAC Patient Monitoring Industry Volume Share (%), by Country 2024 & 2032
- Figure 83: Australia APAC Patient Monitoring Industry Revenue (Million), by Type of Device 2024 & 2032
- Figure 84: Australia APAC Patient Monitoring Industry Volume (K Units), by Type of Device 2024 & 2032
- Figure 85: Australia APAC Patient Monitoring Industry Revenue Share (%), by Type of Device 2024 & 2032
- Figure 86: Australia APAC Patient Monitoring Industry Volume Share (%), by Type of Device 2024 & 2032
- Figure 87: Australia APAC Patient Monitoring Industry Revenue (Million), by Application 2024 & 2032
- Figure 88: Australia APAC Patient Monitoring Industry Volume (K Units), by Application 2024 & 2032
- Figure 89: Australia APAC Patient Monitoring Industry Revenue Share (%), by Application 2024 & 2032
- Figure 90: Australia APAC Patient Monitoring Industry Volume Share (%), by Application 2024 & 2032
- Figure 91: Australia APAC Patient Monitoring Industry Revenue (Million), by End-Users 2024 & 2032
- Figure 92: Australia APAC Patient Monitoring Industry Volume (K Units), by End-Users 2024 & 2032
- Figure 93: Australia APAC Patient Monitoring Industry Revenue Share (%), by End-Users 2024 & 2032
- Figure 94: Australia APAC Patient Monitoring Industry Volume Share (%), by End-Users 2024 & 2032
- Figure 95: Australia APAC Patient Monitoring Industry Revenue (Million), by Geography 2024 & 2032
- Figure 96: Australia APAC Patient Monitoring Industry Volume (K Units), by Geography 2024 & 2032
- Figure 97: Australia APAC Patient Monitoring Industry Revenue Share (%), by Geography 2024 & 2032
- Figure 98: Australia APAC Patient Monitoring Industry Volume Share (%), by Geography 2024 & 2032
- Figure 99: Australia APAC Patient Monitoring Industry Revenue (Million), by Country 2024 & 2032
- Figure 100: Australia APAC Patient Monitoring Industry Volume (K Units), by Country 2024 & 2032
- Figure 101: Australia APAC Patient Monitoring Industry Revenue Share (%), by Country 2024 & 2032
- Figure 102: Australia APAC Patient Monitoring Industry Volume Share (%), by Country 2024 & 2032
- Figure 103: South Korea APAC Patient Monitoring Industry Revenue (Million), by Type of Device 2024 & 2032
- Figure 104: South Korea APAC Patient Monitoring Industry Volume (K Units), by Type of Device 2024 & 2032
- Figure 105: South Korea APAC Patient Monitoring Industry Revenue Share (%), by Type of Device 2024 & 2032
- Figure 106: South Korea APAC Patient Monitoring Industry Volume Share (%), by Type of Device 2024 & 2032
- Figure 107: South Korea APAC Patient Monitoring Industry Revenue (Million), by Application 2024 & 2032
- Figure 108: South Korea APAC Patient Monitoring Industry Volume (K Units), by Application 2024 & 2032
- Figure 109: South Korea APAC Patient Monitoring Industry Revenue Share (%), by Application 2024 & 2032
- Figure 110: South Korea APAC Patient Monitoring Industry Volume Share (%), by Application 2024 & 2032
- Figure 111: South Korea APAC Patient Monitoring Industry Revenue (Million), by End-Users 2024 & 2032
- Figure 112: South Korea APAC Patient Monitoring Industry Volume (K Units), by End-Users 2024 & 2032
- Figure 113: South Korea APAC Patient Monitoring Industry Revenue Share (%), by End-Users 2024 & 2032
- Figure 114: South Korea APAC Patient Monitoring Industry Volume Share (%), by End-Users 2024 & 2032
- Figure 115: South Korea APAC Patient Monitoring Industry Revenue (Million), by Geography 2024 & 2032
- Figure 116: South Korea APAC Patient Monitoring Industry Volume (K Units), by Geography 2024 & 2032
- Figure 117: South Korea APAC Patient Monitoring Industry Revenue Share (%), by Geography 2024 & 2032
- Figure 118: South Korea APAC Patient Monitoring Industry Volume Share (%), by Geography 2024 & 2032
- Figure 119: South Korea APAC Patient Monitoring Industry Revenue (Million), by Country 2024 & 2032
- Figure 120: South Korea APAC Patient Monitoring Industry Volume (K Units), by Country 2024 & 2032
- Figure 121: South Korea APAC Patient Monitoring Industry Revenue Share (%), by Country 2024 & 2032
- Figure 122: South Korea APAC Patient Monitoring Industry Volume Share (%), by Country 2024 & 2032
- Figure 123: Rest of Asia Pacific APAC Patient Monitoring Industry Revenue (Million), by Type of Device 2024 & 2032
- Figure 124: Rest of Asia Pacific APAC Patient Monitoring Industry Volume (K Units), by Type of Device 2024 & 2032
- Figure 125: Rest of Asia Pacific APAC Patient Monitoring Industry Revenue Share (%), by Type of Device 2024 & 2032
- Figure 126: Rest of Asia Pacific APAC Patient Monitoring Industry Volume Share (%), by Type of Device 2024 & 2032
- Figure 127: Rest of Asia Pacific APAC Patient Monitoring Industry Revenue (Million), by Application 2024 & 2032
- Figure 128: Rest of Asia Pacific APAC Patient Monitoring Industry Volume (K Units), by Application 2024 & 2032
- Figure 129: Rest of Asia Pacific APAC Patient Monitoring Industry Revenue Share (%), by Application 2024 & 2032
- Figure 130: Rest of Asia Pacific APAC Patient Monitoring Industry Volume Share (%), by Application 2024 & 2032
- Figure 131: Rest of Asia Pacific APAC Patient Monitoring Industry Revenue (Million), by End-Users 2024 & 2032
- Figure 132: Rest of Asia Pacific APAC Patient Monitoring Industry Volume (K Units), by End-Users 2024 & 2032
- Figure 133: Rest of Asia Pacific APAC Patient Monitoring Industry Revenue Share (%), by End-Users 2024 & 2032
- Figure 134: Rest of Asia Pacific APAC Patient Monitoring Industry Volume Share (%), by End-Users 2024 & 2032
- Figure 135: Rest of Asia Pacific APAC Patient Monitoring Industry Revenue (Million), by Geography 2024 & 2032
- Figure 136: Rest of Asia Pacific APAC Patient Monitoring Industry Volume (K Units), by Geography 2024 & 2032
- Figure 137: Rest of Asia Pacific APAC Patient Monitoring Industry Revenue Share (%), by Geography 2024 & 2032
- Figure 138: Rest of Asia Pacific APAC Patient Monitoring Industry Volume Share (%), by Geography 2024 & 2032
- Figure 139: Rest of Asia Pacific APAC Patient Monitoring Industry Revenue (Million), by Country 2024 & 2032
- Figure 140: Rest of Asia Pacific APAC Patient Monitoring Industry Volume (K Units), by Country 2024 & 2032
- Figure 141: Rest of Asia Pacific APAC Patient Monitoring Industry Revenue Share (%), by Country 2024 & 2032
- Figure 142: Rest of Asia Pacific APAC Patient Monitoring Industry Volume Share (%), by Country 2024 & 2032
List of Tables
- Table 1: Global APAC Patient Monitoring Industry Revenue Million Forecast, by Region 2019 & 2032
- Table 2: Global APAC Patient Monitoring Industry Volume K Units Forecast, by Region 2019 & 2032
- Table 3: Global APAC Patient Monitoring Industry Revenue Million Forecast, by Type of Device 2019 & 2032
- Table 4: Global APAC Patient Monitoring Industry Volume K Units Forecast, by Type of Device 2019 & 2032
- Table 5: Global APAC Patient Monitoring Industry Revenue Million Forecast, by Application 2019 & 2032
- Table 6: Global APAC Patient Monitoring Industry Volume K Units Forecast, by Application 2019 & 2032
- Table 7: Global APAC Patient Monitoring Industry Revenue Million Forecast, by End-Users 2019 & 2032
- Table 8: Global APAC Patient Monitoring Industry Volume K Units Forecast, by End-Users 2019 & 2032
- Table 9: Global APAC Patient Monitoring Industry Revenue Million Forecast, by Geography 2019 & 2032
- Table 10: Global APAC Patient Monitoring Industry Volume K Units Forecast, by Geography 2019 & 2032
- Table 11: Global APAC Patient Monitoring Industry Revenue Million Forecast, by Region 2019 & 2032
- Table 12: Global APAC Patient Monitoring Industry Volume K Units Forecast, by Region 2019 & 2032
- Table 13: Global APAC Patient Monitoring Industry Revenue Million Forecast, by Country 2019 & 2032
- Table 14: Global APAC Patient Monitoring Industry Volume K Units Forecast, by Country 2019 & 2032
- Table 15: United States APAC Patient Monitoring Industry Revenue (Million) Forecast, by Application 2019 & 2032
- Table 16: United States APAC Patient Monitoring Industry Volume (K Units) Forecast, by Application 2019 & 2032
- Table 17: Canada APAC Patient Monitoring Industry Revenue (Million) Forecast, by Application 2019 & 2032
- Table 18: Canada APAC Patient Monitoring Industry Volume (K Units) Forecast, by Application 2019 & 2032
- Table 19: Mexico APAC Patient Monitoring Industry Revenue (Million) Forecast, by Application 2019 & 2032
- Table 20: Mexico APAC Patient Monitoring Industry Volume (K Units) Forecast, by Application 2019 & 2032
- Table 21: Global APAC Patient Monitoring Industry Revenue Million Forecast, by Country 2019 & 2032
- Table 22: Global APAC Patient Monitoring Industry Volume K Units Forecast, by Country 2019 & 2032
- Table 23: Germany APAC Patient Monitoring Industry Revenue (Million) Forecast, by Application 2019 & 2032
- Table 24: Germany APAC Patient Monitoring Industry Volume (K Units) Forecast, by Application 2019 & 2032
- Table 25: United Kingdom APAC Patient Monitoring Industry Revenue (Million) Forecast, by Application 2019 & 2032
- Table 26: United Kingdom APAC Patient Monitoring Industry Volume (K Units) Forecast, by Application 2019 & 2032
- Table 27: France APAC Patient Monitoring Industry Revenue (Million) Forecast, by Application 2019 & 2032
- Table 28: France APAC Patient Monitoring Industry Volume (K Units) Forecast, by Application 2019 & 2032
- Table 29: Spain APAC Patient Monitoring Industry Revenue (Million) Forecast, by Application 2019 & 2032
- Table 30: Spain APAC Patient Monitoring Industry Volume (K Units) Forecast, by Application 2019 & 2032
- Table 31: Italy APAC Patient Monitoring Industry Revenue (Million) Forecast, by Application 2019 & 2032
- Table 32: Italy APAC Patient Monitoring Industry Volume (K Units) Forecast, by Application 2019 & 2032
- Table 33: Spain APAC Patient Monitoring Industry Revenue (Million) Forecast, by Application 2019 & 2032
- Table 34: Spain APAC Patient Monitoring Industry Volume (K Units) Forecast, by Application 2019 & 2032
- Table 35: Belgium APAC Patient Monitoring Industry Revenue (Million) Forecast, by Application 2019 & 2032
- Table 36: Belgium APAC Patient Monitoring Industry Volume (K Units) Forecast, by Application 2019 & 2032
- Table 37: Netherland APAC Patient Monitoring Industry Revenue (Million) Forecast, by Application 2019 & 2032
- Table 38: Netherland APAC Patient Monitoring Industry Volume (K Units) Forecast, by Application 2019 & 2032
- Table 39: Nordics APAC Patient Monitoring Industry Revenue (Million) Forecast, by Application 2019 & 2032
- Table 40: Nordics APAC Patient Monitoring Industry Volume (K Units) Forecast, by Application 2019 & 2032
- Table 41: Rest of Europe APAC Patient Monitoring Industry Revenue (Million) Forecast, by Application 2019 & 2032
- Table 42: Rest of Europe APAC Patient Monitoring Industry Volume (K Units) Forecast, by Application 2019 & 2032
- Table 43: Global APAC Patient Monitoring Industry Revenue Million Forecast, by Country 2019 & 2032
- Table 44: Global APAC Patient Monitoring Industry Volume K Units Forecast, by Country 2019 & 2032
- Table 45: China APAC Patient Monitoring Industry Revenue (Million) Forecast, by Application 2019 & 2032
- Table 46: China APAC Patient Monitoring Industry Volume (K Units) Forecast, by Application 2019 & 2032
- Table 47: Japan APAC Patient Monitoring Industry Revenue (Million) Forecast, by Application 2019 & 2032
- Table 48: Japan APAC Patient Monitoring Industry Volume (K Units) Forecast, by Application 2019 & 2032
- Table 49: India APAC Patient Monitoring Industry Revenue (Million) Forecast, by Application 2019 & 2032
- Table 50: India APAC Patient Monitoring Industry Volume (K Units) Forecast, by Application 2019 & 2032
- Table 51: South Korea APAC Patient Monitoring Industry Revenue (Million) Forecast, by Application 2019 & 2032
- Table 52: South Korea APAC Patient Monitoring Industry Volume (K Units) Forecast, by Application 2019 & 2032
- Table 53: Southeast Asia APAC Patient Monitoring Industry Revenue (Million) Forecast, by Application 2019 & 2032
- Table 54: Southeast Asia APAC Patient Monitoring Industry Volume (K Units) Forecast, by Application 2019 & 2032
- Table 55: Australia APAC Patient Monitoring Industry Revenue (Million) Forecast, by Application 2019 & 2032
- Table 56: Australia APAC Patient Monitoring Industry Volume (K Units) Forecast, by Application 2019 & 2032
- Table 57: Indonesia APAC Patient Monitoring Industry Revenue (Million) Forecast, by Application 2019 & 2032
- Table 58: Indonesia APAC Patient Monitoring Industry Volume (K Units) Forecast, by Application 2019 & 2032
- Table 59: Phillipes APAC Patient Monitoring Industry Revenue (Million) Forecast, by Application 2019 & 2032
- Table 60: Phillipes APAC Patient Monitoring Industry Volume (K Units) Forecast, by Application 2019 & 2032
- Table 61: Singapore APAC Patient Monitoring Industry Revenue (Million) Forecast, by Application 2019 & 2032
- Table 62: Singapore APAC Patient Monitoring Industry Volume (K Units) Forecast, by Application 2019 & 2032
- Table 63: Thailandc APAC Patient Monitoring Industry Revenue (Million) Forecast, by Application 2019 & 2032
- Table 64: Thailandc APAC Patient Monitoring Industry Volume (K Units) Forecast, by Application 2019 & 2032
- Table 65: Rest of Asia Pacific APAC Patient Monitoring Industry Revenue (Million) Forecast, by Application 2019 & 2032
- Table 66: Rest of Asia Pacific APAC Patient Monitoring Industry Volume (K Units) Forecast, by Application 2019 & 2032
- Table 67: Global APAC Patient Monitoring Industry Revenue Million Forecast, by Country 2019 & 2032
- Table 68: Global APAC Patient Monitoring Industry Volume K Units Forecast, by Country 2019 & 2032
- Table 69: Brazil APAC Patient Monitoring Industry Revenue (Million) Forecast, by Application 2019 & 2032
- Table 70: Brazil APAC Patient Monitoring Industry Volume (K Units) Forecast, by Application 2019 & 2032
- Table 71: Argentina APAC Patient Monitoring Industry Revenue (Million) Forecast, by Application 2019 & 2032
- Table 72: Argentina APAC Patient Monitoring Industry Volume (K Units) Forecast, by Application 2019 & 2032
- Table 73: Peru APAC Patient Monitoring Industry Revenue (Million) Forecast, by Application 2019 & 2032
- Table 74: Peru APAC Patient Monitoring Industry Volume (K Units) Forecast, by Application 2019 & 2032
- Table 75: Chile APAC Patient Monitoring Industry Revenue (Million) Forecast, by Application 2019 & 2032
- Table 76: Chile APAC Patient Monitoring Industry Volume (K Units) Forecast, by Application 2019 & 2032
- Table 77: Colombia APAC Patient Monitoring Industry Revenue (Million) Forecast, by Application 2019 & 2032
- Table 78: Colombia APAC Patient Monitoring Industry Volume (K Units) Forecast, by Application 2019 & 2032
- Table 79: Ecuador APAC Patient Monitoring Industry Revenue (Million) Forecast, by Application 2019 & 2032
- Table 80: Ecuador APAC Patient Monitoring Industry Volume (K Units) Forecast, by Application 2019 & 2032
- Table 81: Venezuela APAC Patient Monitoring Industry Revenue (Million) Forecast, by Application 2019 & 2032
- Table 82: Venezuela APAC Patient Monitoring Industry Volume (K Units) Forecast, by Application 2019 & 2032
- Table 83: Rest of South America APAC Patient Monitoring Industry Revenue (Million) Forecast, by Application 2019 & 2032
- Table 84: Rest of South America APAC Patient Monitoring Industry Volume (K Units) Forecast, by Application 2019 & 2032
- Table 85: Global APAC Patient Monitoring Industry Revenue Million Forecast, by Country 2019 & 2032
- Table 86: Global APAC Patient Monitoring Industry Volume K Units Forecast, by Country 2019 & 2032
- Table 87: United Arab Emirates APAC Patient Monitoring Industry Revenue (Million) Forecast, by Application 2019 & 2032
- Table 88: United Arab Emirates APAC Patient Monitoring Industry Volume (K Units) Forecast, by Application 2019 & 2032
- Table 89: Saudi Arabia APAC Patient Monitoring Industry Revenue (Million) Forecast, by Application 2019 & 2032
- Table 90: Saudi Arabia APAC Patient Monitoring Industry Volume (K Units) Forecast, by Application 2019 & 2032
- Table 91: South Africa APAC Patient Monitoring Industry Revenue (Million) Forecast, by Application 2019 & 2032
- Table 92: South Africa APAC Patient Monitoring Industry Volume (K Units) Forecast, by Application 2019 & 2032
- Table 93: Rest of Middle East and Africa APAC Patient Monitoring Industry Revenue (Million) Forecast, by Application 2019 & 2032
- Table 94: Rest of Middle East and Africa APAC Patient Monitoring Industry Volume (K Units) Forecast, by Application 2019 & 2032
- Table 95: Global APAC Patient Monitoring Industry Revenue Million Forecast, by Type of Device 2019 & 2032
- Table 96: Global APAC Patient Monitoring Industry Volume K Units Forecast, by Type of Device 2019 & 2032
- Table 97: Global APAC Patient Monitoring Industry Revenue Million Forecast, by Application 2019 & 2032
- Table 98: Global APAC Patient Monitoring Industry Volume K Units Forecast, by Application 2019 & 2032
- Table 99: Global APAC Patient Monitoring Industry Revenue Million Forecast, by End-Users 2019 & 2032
- Table 100: Global APAC Patient Monitoring Industry Volume K Units Forecast, by End-Users 2019 & 2032
- Table 101: Global APAC Patient Monitoring Industry Revenue Million Forecast, by Geography 2019 & 2032
- Table 102: Global APAC Patient Monitoring Industry Volume K Units Forecast, by Geography 2019 & 2032
- Table 103: Global APAC Patient Monitoring Industry Revenue Million Forecast, by Country 2019 & 2032
- Table 104: Global APAC Patient Monitoring Industry Volume K Units Forecast, by Country 2019 & 2032
- Table 105: Global APAC Patient Monitoring Industry Revenue Million Forecast, by Type of Device 2019 & 2032
- Table 106: Global APAC Patient Monitoring Industry Volume K Units Forecast, by Type of Device 2019 & 2032
- Table 107: Global APAC Patient Monitoring Industry Revenue Million Forecast, by Application 2019 & 2032
- Table 108: Global APAC Patient Monitoring Industry Volume K Units Forecast, by Application 2019 & 2032
- Table 109: Global APAC Patient Monitoring Industry Revenue Million Forecast, by End-Users 2019 & 2032
- Table 110: Global APAC Patient Monitoring Industry Volume K Units Forecast, by End-Users 2019 & 2032
- Table 111: Global APAC Patient Monitoring Industry Revenue Million Forecast, by Geography 2019 & 2032
- Table 112: Global APAC Patient Monitoring Industry Volume K Units Forecast, by Geography 2019 & 2032
- Table 113: Global APAC Patient Monitoring Industry Revenue Million Forecast, by Country 2019 & 2032
- Table 114: Global APAC Patient Monitoring Industry Volume K Units Forecast, by Country 2019 & 2032
- Table 115: Global APAC Patient Monitoring Industry Revenue Million Forecast, by Type of Device 2019 & 2032
- Table 116: Global APAC Patient Monitoring Industry Volume K Units Forecast, by Type of Device 2019 & 2032
- Table 117: Global APAC Patient Monitoring Industry Revenue Million Forecast, by Application 2019 & 2032
- Table 118: Global APAC Patient Monitoring Industry Volume K Units Forecast, by Application 2019 & 2032
- Table 119: Global APAC Patient Monitoring Industry Revenue Million Forecast, by End-Users 2019 & 2032
- Table 120: Global APAC Patient Monitoring Industry Volume K Units Forecast, by End-Users 2019 & 2032
- Table 121: Global APAC Patient Monitoring Industry Revenue Million Forecast, by Geography 2019 & 2032
- Table 122: Global APAC Patient Monitoring Industry Volume K Units Forecast, by Geography 2019 & 2032
- Table 123: Global APAC Patient Monitoring Industry Revenue Million Forecast, by Country 2019 & 2032
- Table 124: Global APAC Patient Monitoring Industry Volume K Units Forecast, by Country 2019 & 2032
- Table 125: Global APAC Patient Monitoring Industry Revenue Million Forecast, by Type of Device 2019 & 2032
- Table 126: Global APAC Patient Monitoring Industry Volume K Units Forecast, by Type of Device 2019 & 2032
- Table 127: Global APAC Patient Monitoring Industry Revenue Million Forecast, by Application 2019 & 2032
- Table 128: Global APAC Patient Monitoring Industry Volume K Units Forecast, by Application 2019 & 2032
- Table 129: Global APAC Patient Monitoring Industry Revenue Million Forecast, by End-Users 2019 & 2032
- Table 130: Global APAC Patient Monitoring Industry Volume K Units Forecast, by End-Users 2019 & 2032
- Table 131: Global APAC Patient Monitoring Industry Revenue Million Forecast, by Geography 2019 & 2032
- Table 132: Global APAC Patient Monitoring Industry Volume K Units Forecast, by Geography 2019 & 2032
- Table 133: Global APAC Patient Monitoring Industry Revenue Million Forecast, by Country 2019 & 2032
- Table 134: Global APAC Patient Monitoring Industry Volume K Units Forecast, by Country 2019 & 2032
- Table 135: Global APAC Patient Monitoring Industry Revenue Million Forecast, by Type of Device 2019 & 2032
- Table 136: Global APAC Patient Monitoring Industry Volume K Units Forecast, by Type of Device 2019 & 2032
- Table 137: Global APAC Patient Monitoring Industry Revenue Million Forecast, by Application 2019 & 2032
- Table 138: Global APAC Patient Monitoring Industry Volume K Units Forecast, by Application 2019 & 2032
- Table 139: Global APAC Patient Monitoring Industry Revenue Million Forecast, by End-Users 2019 & 2032
- Table 140: Global APAC Patient Monitoring Industry Volume K Units Forecast, by End-Users 2019 & 2032
- Table 141: Global APAC Patient Monitoring Industry Revenue Million Forecast, by Geography 2019 & 2032
- Table 142: Global APAC Patient Monitoring Industry Volume K Units Forecast, by Geography 2019 & 2032
- Table 143: Global APAC Patient Monitoring Industry Revenue Million Forecast, by Country 2019 & 2032
- Table 144: Global APAC Patient Monitoring Industry Volume K Units Forecast, by Country 2019 & 2032
- Table 145: Global APAC Patient Monitoring Industry Revenue Million Forecast, by Type of Device 2019 & 2032
- Table 146: Global APAC Patient Monitoring Industry Volume K Units Forecast, by Type of Device 2019 & 2032
- Table 147: Global APAC Patient Monitoring Industry Revenue Million Forecast, by Application 2019 & 2032
- Table 148: Global APAC Patient Monitoring Industry Volume K Units Forecast, by Application 2019 & 2032
- Table 149: Global APAC Patient Monitoring Industry Revenue Million Forecast, by End-Users 2019 & 2032
- Table 150: Global APAC Patient Monitoring Industry Volume K Units Forecast, by End-Users 2019 & 2032
- Table 151: Global APAC Patient Monitoring Industry Revenue Million Forecast, by Geography 2019 & 2032
- Table 152: Global APAC Patient Monitoring Industry Volume K Units Forecast, by Geography 2019 & 2032
- Table 153: Global APAC Patient Monitoring Industry Revenue Million Forecast, by Country 2019 & 2032
- Table 154: Global APAC Patient Monitoring Industry Volume K Units Forecast, by Country 2019 & 2032
Frequently Asked Questions
1. What is the projected Compound Annual Growth Rate (CAGR) of the APAC Patient Monitoring Industry?
The projected CAGR is approximately 7.25%.
2. Which companies are prominent players in the APAC Patient Monitoring Industry?
Key companies in the market include BPL Group, Koninklijke Philips N V, General Electric Company (GE Healthcare), Mindray Medical International Co Ltd, Spacelabs Healthcare, Nihon Kohden Corporation, Dragerwerk AG, Schiller, Siemens Healthcare GmBH.
3. What are the main segments of the APAC Patient Monitoring Industry?
The market segments include Type of Device, Application, End-Users, Geography.
4. Can you provide details about the market size?
The market size is estimated to be USD 9.97 Million as of 2022.
5. What are some drivers contributing to market growth?
Rising Incidences of Chronic Diseases; Increasing Preference for Home and Remote Monitoring.
6. What are the notable trends driving market growth?
Remote Patient Monitoring Devices is Expected to Show a Significant Growth Rate Over the Forecast Period.
7. Are there any restraints impacting market growth?
High Cost of Devices.
8. Can you provide examples of recent developments in the market?
October 2022: Apollo Hospitals launched its indigenously developed automated, rapid-response patient monitoring system. The system is intended to track patient health and proactively warn a team of experts if it foresees an unanticipated decline in that patient's condition.
9. What pricing options are available for accessing the report?
Pricing options include single-user, multi-user, and enterprise licenses priced at USD 4750, USD 5250, and USD 8750 respectively.
10. Is the market size provided in terms of value or volume?
The market size is provided in terms of value, measured in Million and volume, measured in K Units.
11. Are there any specific market keywords associated with the report?
Yes, the market keyword associated with the report is "APAC Patient Monitoring Industry," which aids in identifying and referencing the specific market segment covered.
12. How do I determine which pricing option suits my needs best?
The pricing options vary based on user requirements and access needs. Individual users may opt for single-user licenses, while businesses requiring broader access may choose multi-user or enterprise licenses for cost-effective access to the report.
13. Are there any additional resources or data provided in the APAC Patient Monitoring Industry report?
While the report offers comprehensive insights, it's advisable to review the specific contents or supplementary materials provided to ascertain if additional resources or data are available.
14. How can I stay updated on further developments or reports in the APAC Patient Monitoring Industry?
To stay informed about further developments, trends, and reports in the APAC Patient Monitoring Industry, consider subscribing to industry newsletters, following relevant companies and organizations, or regularly checking reputable industry news sources and publications.
Methodology
Step 1 - Identification of Relevant Samples Size from Population Database


Step 2 - Approaches for Defining Global Market Size (Value, Volume* & Price*)

Note*: In applicable scenarios
Step 3 - Data Sources
Primary Research
- Web Analytics
- Survey Reports
- Research Institute
- Latest Research Reports
- Opinion Leaders
Secondary Research
- Annual Reports
- White Paper
- Latest Press Release
- Industry Association
- Paid Database
- Investor Presentations

Step 4 - Data Triangulation
Involves using different sources of information in order to increase the validity of a study
These sources are likely to be stakeholders in a program - participants, other researchers, program staff, other community members, and so on.
Then we put all data in single framework & apply various statistical tools to find out the dynamic on the market.
During the analysis stage, feedback from the stakeholder groups would be compared to determine areas of agreement as well as areas of divergence
