

Key Insights
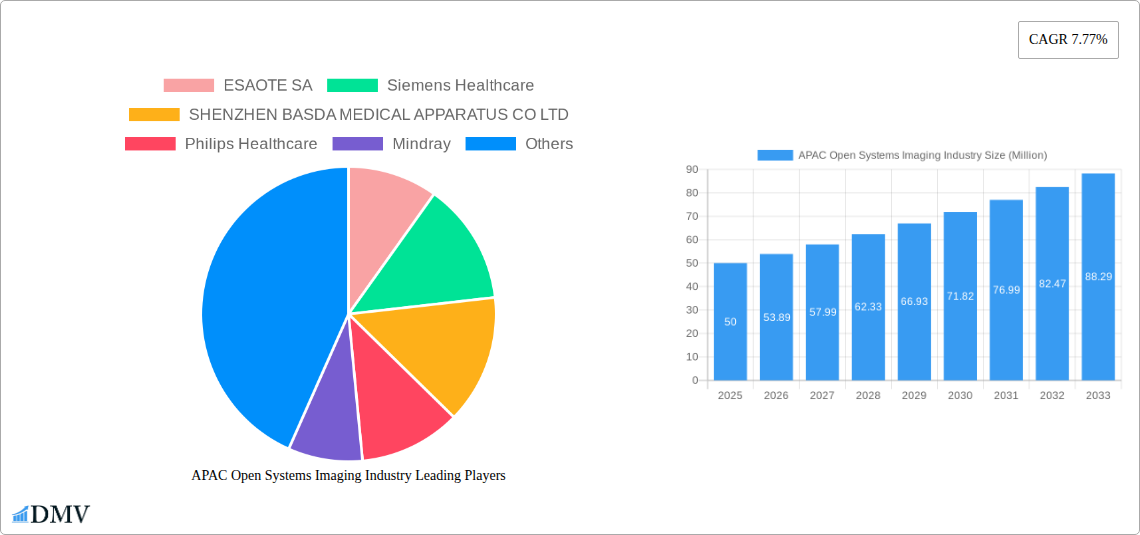
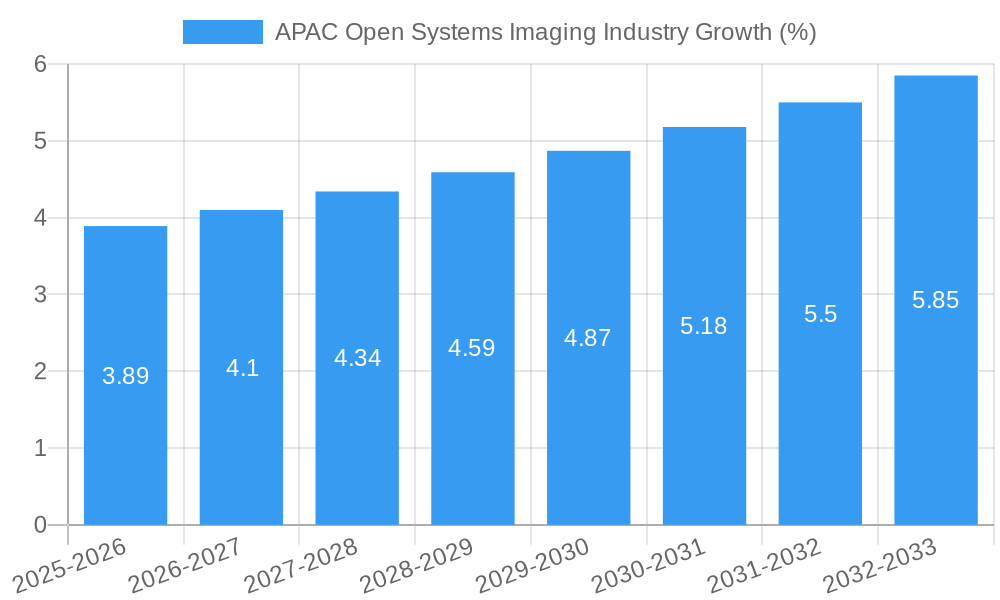
The Asia-Pacific (APAC) open systems imaging market is experiencing robust growth, driven by increasing healthcare infrastructure development, rising prevalence of chronic diseases necessitating advanced diagnostic imaging, and the growing adoption of technologically advanced systems offering superior image quality and efficiency. The market's Compound Annual Growth Rate (CAGR) of 7.77% from 2019 to 2024 suggests a strong trajectory, which is likely to continue throughout the forecast period (2025-2033). Key segments within APAC driving this expansion include high-field scanners, catering to the demand for higher resolution images for complex diagnoses in neurology, cardiology, and oncology. Growth in these applications is further fueled by increasing disposable incomes and improving healthcare access, particularly in rapidly developing economies like China and India. While regulatory hurdles and high initial investment costs present some restraints, the overall market outlook remains positive due to the aforementioned growth drivers and the increasing preference for open systems offering greater flexibility and integration with existing healthcare IT infrastructure. The competitive landscape features both established global players and emerging regional companies, leading to innovation and price competitiveness, thereby fostering market penetration and expansion.
Significant growth is expected to emanate from countries like China, India, and Japan, where substantial investments in healthcare infrastructure are underway. The rising prevalence of cardiovascular diseases, neurological disorders, and cancer is driving demand for sophisticated imaging systems. Moreover, the increasing adoption of telemedicine and remote diagnostics is further contributing to the market's expansion. The preference for open systems, offering greater flexibility in workflow integration, is also a crucial factor contributing to market growth. While the cost of these systems remains a factor, the long-term benefits of improved diagnostic accuracy and efficiency are outweighing this concern, leading to higher adoption rates in both public and private healthcare facilities across the region. The market is expected to see further consolidation in the coming years, with larger players acquiring smaller companies to strengthen their market presence and expand their product portfolios.
APAC Open Systems Imaging Industry: Market Analysis, Trends & Forecast (2019-2033)
This comprehensive report provides an in-depth analysis of the Asia-Pacific (APAC) open systems imaging industry, offering invaluable insights for stakeholders seeking to navigate this dynamic market. Covering the period from 2019 to 2033, with 2025 as the base and estimated year, this report meticulously examines market size, segmentation, leading players, and future growth potential. The APAC region presents significant opportunities driven by rising healthcare expenditure, technological advancements, and a growing aging population. This report is essential for strategic decision-making, investment planning, and competitive benchmarking within the APAC open systems imaging sector.
APAC Open Systems Imaging Industry Market Composition & Trends
The APAC open systems imaging market is characterized by a moderately concentrated landscape with key players like ESAOTE SA, Siemens Healthcare, SHENZHEN BASDA MEDICAL APPARATUS CO LTD, Philips Healthcare, Mindray, Hitachi Medical Corporation, and Canon Medical Systems Corporation vying for market share. Market concentration is estimated at xx% in 2025, with the top five players holding a combined xx% share. Innovation is fueled by advancements in MRI, CT, and ultrasound technologies, driving demand for higher resolution and faster imaging speeds. Regulatory landscapes vary across APAC nations, influencing market access and product approvals. Substitute products, such as conventional imaging techniques, pose a moderate competitive threat. End-users include hospitals, diagnostic imaging centers, and clinics, with hospitals dominating the market. M&A activity has been moderate, with estimated deal values totaling $xx Million in the last five years.
- Market Share (2025): Top 5 players – xx%
- M&A Deal Value (2020-2024): $xx Million
- Regulatory Landscape: Highly variable across APAC nations.
- Key End-Users: Hospitals, Diagnostic centers, Clinics
APAC Open Systems Imaging Industry Industry Evolution
The APAC open systems imaging market has witnessed substantial growth from 2019 to 2024, expanding at a CAGR of xx%. This growth is attributed to several factors, including increasing prevalence of chronic diseases, rising healthcare spending, and technological advancements. The market is transitioning towards higher-resolution scanners, particularly in high-growth segments like cardiology and oncology. Consumer demand is shifting towards more portable and user-friendly systems, coupled with a preference for improved image quality and faster scan times. Technological advancements like AI-powered image analysis and cloud-based image management systems are further propelling market growth. Adoption rates for advanced imaging technologies, such as AI-assisted diagnosis, are increasing at a CAGR of xx% during the forecast period. The overall market is poised for continued expansion, driven by growing demand and ongoing technological advancements. We project a CAGR of xx% from 2025 to 2033, reaching a market value of $xx Million by 2033.
Leading Regions, Countries, or Segments in APAC Open Systems Imaging Industry
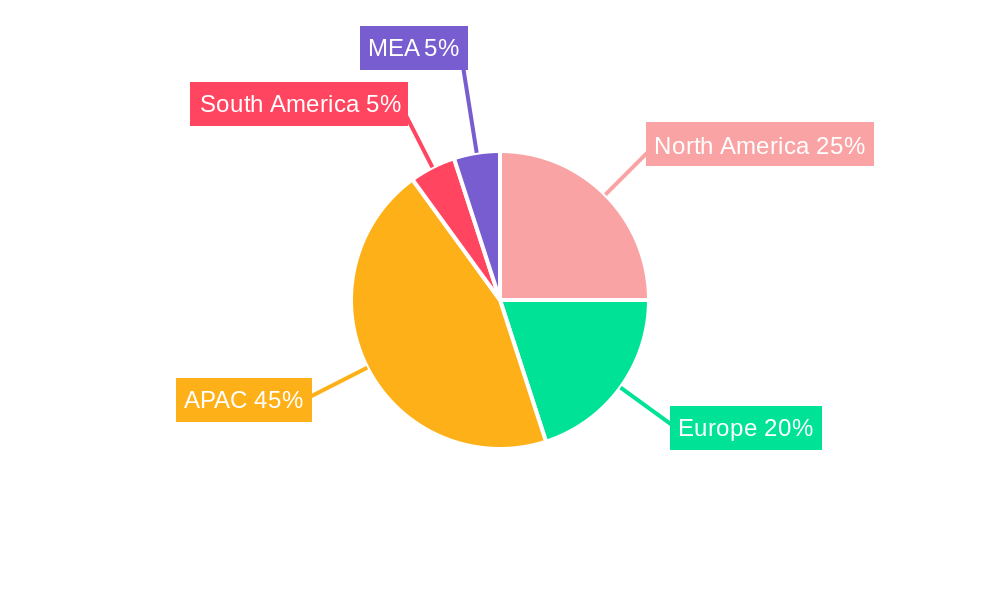
China remains the dominant market within APAC, accounting for xx% of the total market value in 2025. This dominance is driven by several factors:
- High Healthcare Expenditure: Significant government investment in healthcare infrastructure.
- Rising Prevalence of Chronic Diseases: Increasing rates of cancer, cardiovascular diseases, and neurological disorders.
- Growing Adoption of Advanced Imaging Technologies: Increasing demand for high-resolution scanners and AI-powered diagnostic tools.
Other key regional markets include Japan, India, and South Korea, each experiencing strong growth albeit at varying paces. In terms of segments, the high-field scanner segment demonstrates significant growth potential, driven by its superior image quality and diagnostic capabilities. The cardiology application segment holds a large share owing to the increasing prevalence of cardiovascular diseases.
- Dominant Region: China
- Fastest-Growing Segment (By Resolution): High-Field Scanner
- Largest Application Segment: Cardiology
APAP Open Systems Imaging Industry Product Innovations
Recent innovations include the integration of artificial intelligence (AI) for automated image analysis and improved diagnostic accuracy. Miniaturization of scanners is enhancing portability and accessibility, while cloud-based platforms are facilitating remote image analysis and collaboration among healthcare professionals. These advancements are improving the efficiency and effectiveness of diagnostic imaging procedures, ultimately leading to better patient outcomes. Unique selling propositions include faster scan times, superior image quality, and enhanced user-friendliness.
Propelling Factors for APAC Open Systems Imaging Industry Growth
Several factors are driving growth in the APAC open systems imaging industry. Technological advancements, such as AI integration and improved image processing, are enhancing diagnostic accuracy and efficiency. Economic growth in many APAC countries is increasing healthcare spending, funding investments in new imaging technologies. Favorable government policies and regulatory approvals are facilitating market access for new products and fostering innovation. The rising prevalence of chronic diseases is further boosting demand for advanced imaging solutions.
Obstacles in the APAP Open Systems Imaging Industry Market
The APAC open systems imaging market faces challenges such as stringent regulatory hurdles in certain countries, leading to delays in product approvals and increased costs. Supply chain disruptions due to geopolitical factors or pandemics can impact the availability of components and affect production. Intense competition among established players and new entrants creates pricing pressures and limits profit margins. These factors collectively impact market growth and profitability.
Future Opportunities in APAC Open Systems Imaging Industry
Emerging opportunities lie in expanding into underserved rural markets, developing portable and affordable imaging solutions, and leveraging telemedicine to improve access to specialized imaging services. The integration of AI and big data analytics has the potential to transform diagnostic imaging with predictive models and personalized treatment plans. New consumer trends towards preventive healthcare can fuel the demand for screening and diagnostic imaging.
Major Players in the APAC Open Systems Imaging Industry Ecosystem
- ESAOTE SA
- Siemens Healthcare
- SHENZHEN BASDA MEDICAL APPARATUS CO LTD
- Philips Healthcare
- Mindray
- Hitachi Medical Corporation
- Canon Medical Systems Corporation
Key Developments in APAC Open Systems Imaging Industry Industry
- 2022 Q4: Launch of a new AI-powered ultrasound system by Mindray.
- 2023 Q1: Siemens Healthcare announces a strategic partnership with a major hospital chain in China.
- 2023 Q2: Approval of a new MRI scanner by regulatory authorities in India. (Further developments to be added based on available information)
Strategic APAC Open Systems Imaging Industry Market Forecast
The APAC open systems imaging market is poised for robust growth over the next decade, driven by technological innovation, expanding healthcare infrastructure, and increasing prevalence of chronic diseases. Emerging technologies, such as AI-powered diagnostics and cloud-based platforms, will further transform the industry. The market is expected to witness significant expansion in both high-growth economies and underserved regions, presenting lucrative opportunities for existing players and new entrants alike. Strategic partnerships and collaborations will be crucial to capitalizing on this growth potential.
APAC Open Systems Imaging Industry Segmentation
-
1. Resolution
- 1.1. Low- Field Scanner
- 1.2. Mid-field Scanner
- 1.3. High-Field Scanner
-
2. Application
- 2.1. Neurology
- 2.2. Gastroenterology
- 2.3. Cardiology
- 2.4. Oncology
- 2.5. Others
-
3. Geography
-
3.1. Asia-Pacific
- 3.1.1. China
- 3.1.2. Japan
- 3.1.3. India
- 3.1.4. Australia
- 3.1.5. South Korea
- 3.1.6. Rest of Asia-Pacific
-
3.1. Asia-Pacific
APAC Open Systems Imaging Industry Segmentation By Geography
-
1. Asia Pacific
- 1.1. China
- 1.2. Japan
- 1.3. India
- 1.4. Australia
- 1.5. South Korea
- 1.6. Rest of Asia Pacific
APAC Open Systems Imaging Industry REPORT HIGHLIGHTS
| Aspects | Details |
|---|---|
| Study Period | 2019-2033 |
| Base Year | 2024 |
| Estimated Year | 2025 |
| Forecast Period | 2025-2033 |
| Historical Period | 2019-2024 |
| Growth Rate | CAGR of 7.77% from 2019-2033 |
| Segmentation |
|
Table of Contents
- 1. Introduction
- 1.1. Research Scope
- 1.2. Market Segmentation
- 1.3. Research Methodology
- 1.4. Definitions and Assumptions
- 2. Executive Summary
- 2.1. Introduction
- 3. Market Dynamics
- 3.1. Introduction
- 3.2. Market Drivers
- 3.2.1. ; Increasing Number of MRI Procedures; Increasing Applications in Clinical Diagnosis and Increasing Disease Burden
- 3.3. Market Restrains
- 3.3.1. ; High Cost of Open MRI Systems
- 3.4. Market Trends
- 3.4.1. Application in Neurology is Expected to Dominate the Asia Pacific Open System MRI Market
- 4. Market Factor Analysis
- 4.1. Porters Five Forces
- 4.2. Supply/Value Chain
- 4.3. PESTEL analysis
- 4.4. Market Entropy
- 4.5. Patent/Trademark Analysis
- 5. Global APAC Open Systems Imaging Industry Analysis, Insights and Forecast, 2019-2031
- 5.1. Market Analysis, Insights and Forecast - by Resolution
- 5.1.1. Low- Field Scanner
- 5.1.2. Mid-field Scanner
- 5.1.3. High-Field Scanner
- 5.2. Market Analysis, Insights and Forecast - by Application
- 5.2.1. Neurology
- 5.2.2. Gastroenterology
- 5.2.3. Cardiology
- 5.2.4. Oncology
- 5.2.5. Others
- 5.3. Market Analysis, Insights and Forecast - by Geography
- 5.3.1. Asia-Pacific
- 5.3.1.1. China
- 5.3.1.2. Japan
- 5.3.1.3. India
- 5.3.1.4. Australia
- 5.3.1.5. South Korea
- 5.3.1.6. Rest of Asia-Pacific
- 5.3.1. Asia-Pacific
- 5.4. Market Analysis, Insights and Forecast - by Region
- 5.4.1. Asia Pacific
- 5.1. Market Analysis, Insights and Forecast - by Resolution
- 6. North America APAC Open Systems Imaging Industry Analysis, Insights and Forecast, 2019-2031
- 6.1. Market Analysis, Insights and Forecast - By Country/Sub-region
- 6.1.1 United States
- 6.1.2 Canada
- 6.1.3 Mexico
- 7. Europe APAC Open Systems Imaging Industry Analysis, Insights and Forecast, 2019-2031
- 7.1. Market Analysis, Insights and Forecast - By Country/Sub-region
- 7.1.1 Germany
- 7.1.2 United Kingdom
- 7.1.3 France
- 7.1.4 Spain
- 7.1.5 Italy
- 7.1.6 Spain
- 7.1.7 Belgium
- 7.1.8 Netherland
- 7.1.9 Nordics
- 7.1.10 Rest of Europe
- 8. Asia Pacific APAC Open Systems Imaging Industry Analysis, Insights and Forecast, 2019-2031
- 8.1. Market Analysis, Insights and Forecast - By Country/Sub-region
- 8.1.1 China
- 8.1.2 Japan
- 8.1.3 India
- 8.1.4 South Korea
- 8.1.5 Southeast Asia
- 8.1.6 Australia
- 8.1.7 Indonesia
- 8.1.8 Phillipes
- 8.1.9 Singapore
- 8.1.10 Thailandc
- 8.1.11 Rest of Asia Pacific
- 9. South America APAC Open Systems Imaging Industry Analysis, Insights and Forecast, 2019-2031
- 9.1. Market Analysis, Insights and Forecast - By Country/Sub-region
- 9.1.1 Brazil
- 9.1.2 Argentina
- 9.1.3 Peru
- 9.1.4 Chile
- 9.1.5 Colombia
- 9.1.6 Ecuador
- 9.1.7 Venezuela
- 9.1.8 Rest of South America
- 10. North America APAC Open Systems Imaging Industry Analysis, Insights and Forecast, 2019-2031
- 10.1. Market Analysis, Insights and Forecast - By Country/Sub-region
- 10.1.1 United States
- 10.1.2 Canada
- 10.1.3 Mexico
- 11. MEA APAC Open Systems Imaging Industry Analysis, Insights and Forecast, 2019-2031
- 11.1. Market Analysis, Insights and Forecast - By Country/Sub-region
- 11.1.1 United Arab Emirates
- 11.1.2 Saudi Arabia
- 11.1.3 South Africa
- 11.1.4 Rest of Middle East and Africa
- 12. Competitive Analysis
- 12.1. Global Market Share Analysis 2024
- 12.2. Company Profiles
- 12.2.1 ESAOTE SA
- 12.2.1.1. Overview
- 12.2.1.2. Products
- 12.2.1.3. SWOT Analysis
- 12.2.1.4. Recent Developments
- 12.2.1.5. Financials (Based on Availability)
- 12.2.2 Siemens Healthcare
- 12.2.2.1. Overview
- 12.2.2.2. Products
- 12.2.2.3. SWOT Analysis
- 12.2.2.4. Recent Developments
- 12.2.2.5. Financials (Based on Availability)
- 12.2.3 SHENZHEN BASDA MEDICAL APPARATUS CO LTD
- 12.2.3.1. Overview
- 12.2.3.2. Products
- 12.2.3.3. SWOT Analysis
- 12.2.3.4. Recent Developments
- 12.2.3.5. Financials (Based on Availability)
- 12.2.4 Philips Healthcare
- 12.2.4.1. Overview
- 12.2.4.2. Products
- 12.2.4.3. SWOT Analysis
- 12.2.4.4. Recent Developments
- 12.2.4.5. Financials (Based on Availability)
- 12.2.5 Mindray
- 12.2.5.1. Overview
- 12.2.5.2. Products
- 12.2.5.3. SWOT Analysis
- 12.2.5.4. Recent Developments
- 12.2.5.5. Financials (Based on Availability)
- 12.2.6 Hitachi Medical Corporation
- 12.2.6.1. Overview
- 12.2.6.2. Products
- 12.2.6.3. SWOT Analysis
- 12.2.6.4. Recent Developments
- 12.2.6.5. Financials (Based on Availability)
- 12.2.7 Canon Medical Systems Corporation
- 12.2.7.1. Overview
- 12.2.7.2. Products
- 12.2.7.3. SWOT Analysis
- 12.2.7.4. Recent Developments
- 12.2.7.5. Financials (Based on Availability)
- 12.2.1 ESAOTE SA
List of Figures
- Figure 1: Global APAC Open Systems Imaging Industry Revenue Breakdown (Million, %) by Region 2024 & 2032
- Figure 2: Global APAC Open Systems Imaging Industry Volume Breakdown (K Unit, %) by Region 2024 & 2032
- Figure 3: North America APAC Open Systems Imaging Industry Revenue (Million), by Country 2024 & 2032
- Figure 4: North America APAC Open Systems Imaging Industry Volume (K Unit), by Country 2024 & 2032
- Figure 5: North America APAC Open Systems Imaging Industry Revenue Share (%), by Country 2024 & 2032
- Figure 6: North America APAC Open Systems Imaging Industry Volume Share (%), by Country 2024 & 2032
- Figure 7: Europe APAC Open Systems Imaging Industry Revenue (Million), by Country 2024 & 2032
- Figure 8: Europe APAC Open Systems Imaging Industry Volume (K Unit), by Country 2024 & 2032
- Figure 9: Europe APAC Open Systems Imaging Industry Revenue Share (%), by Country 2024 & 2032
- Figure 10: Europe APAC Open Systems Imaging Industry Volume Share (%), by Country 2024 & 2032
- Figure 11: Asia Pacific APAC Open Systems Imaging Industry Revenue (Million), by Country 2024 & 2032
- Figure 12: Asia Pacific APAC Open Systems Imaging Industry Volume (K Unit), by Country 2024 & 2032
- Figure 13: Asia Pacific APAC Open Systems Imaging Industry Revenue Share (%), by Country 2024 & 2032
- Figure 14: Asia Pacific APAC Open Systems Imaging Industry Volume Share (%), by Country 2024 & 2032
- Figure 15: South America APAC Open Systems Imaging Industry Revenue (Million), by Country 2024 & 2032
- Figure 16: South America APAC Open Systems Imaging Industry Volume (K Unit), by Country 2024 & 2032
- Figure 17: South America APAC Open Systems Imaging Industry Revenue Share (%), by Country 2024 & 2032
- Figure 18: South America APAC Open Systems Imaging Industry Volume Share (%), by Country 2024 & 2032
- Figure 19: North America APAC Open Systems Imaging Industry Revenue (Million), by Country 2024 & 2032
- Figure 20: North America APAC Open Systems Imaging Industry Volume (K Unit), by Country 2024 & 2032
- Figure 21: North America APAC Open Systems Imaging Industry Revenue Share (%), by Country 2024 & 2032
- Figure 22: North America APAC Open Systems Imaging Industry Volume Share (%), by Country 2024 & 2032
- Figure 23: MEA APAC Open Systems Imaging Industry Revenue (Million), by Country 2024 & 2032
- Figure 24: MEA APAC Open Systems Imaging Industry Volume (K Unit), by Country 2024 & 2032
- Figure 25: MEA APAC Open Systems Imaging Industry Revenue Share (%), by Country 2024 & 2032
- Figure 26: MEA APAC Open Systems Imaging Industry Volume Share (%), by Country 2024 & 2032
- Figure 27: Asia Pacific APAC Open Systems Imaging Industry Revenue (Million), by Resolution 2024 & 2032
- Figure 28: Asia Pacific APAC Open Systems Imaging Industry Volume (K Unit), by Resolution 2024 & 2032
- Figure 29: Asia Pacific APAC Open Systems Imaging Industry Revenue Share (%), by Resolution 2024 & 2032
- Figure 30: Asia Pacific APAC Open Systems Imaging Industry Volume Share (%), by Resolution 2024 & 2032
- Figure 31: Asia Pacific APAC Open Systems Imaging Industry Revenue (Million), by Application 2024 & 2032
- Figure 32: Asia Pacific APAC Open Systems Imaging Industry Volume (K Unit), by Application 2024 & 2032
- Figure 33: Asia Pacific APAC Open Systems Imaging Industry Revenue Share (%), by Application 2024 & 2032
- Figure 34: Asia Pacific APAC Open Systems Imaging Industry Volume Share (%), by Application 2024 & 2032
- Figure 35: Asia Pacific APAC Open Systems Imaging Industry Revenue (Million), by Geography 2024 & 2032
- Figure 36: Asia Pacific APAC Open Systems Imaging Industry Volume (K Unit), by Geography 2024 & 2032
- Figure 37: Asia Pacific APAC Open Systems Imaging Industry Revenue Share (%), by Geography 2024 & 2032
- Figure 38: Asia Pacific APAC Open Systems Imaging Industry Volume Share (%), by Geography 2024 & 2032
- Figure 39: Asia Pacific APAC Open Systems Imaging Industry Revenue (Million), by Country 2024 & 2032
- Figure 40: Asia Pacific APAC Open Systems Imaging Industry Volume (K Unit), by Country 2024 & 2032
- Figure 41: Asia Pacific APAC Open Systems Imaging Industry Revenue Share (%), by Country 2024 & 2032
- Figure 42: Asia Pacific APAC Open Systems Imaging Industry Volume Share (%), by Country 2024 & 2032
List of Tables
- Table 1: Global APAC Open Systems Imaging Industry Revenue Million Forecast, by Region 2019 & 2032
- Table 2: Global APAC Open Systems Imaging Industry Volume K Unit Forecast, by Region 2019 & 2032
- Table 3: Global APAC Open Systems Imaging Industry Revenue Million Forecast, by Resolution 2019 & 2032
- Table 4: Global APAC Open Systems Imaging Industry Volume K Unit Forecast, by Resolution 2019 & 2032
- Table 5: Global APAC Open Systems Imaging Industry Revenue Million Forecast, by Application 2019 & 2032
- Table 6: Global APAC Open Systems Imaging Industry Volume K Unit Forecast, by Application 2019 & 2032
- Table 7: Global APAC Open Systems Imaging Industry Revenue Million Forecast, by Geography 2019 & 2032
- Table 8: Global APAC Open Systems Imaging Industry Volume K Unit Forecast, by Geography 2019 & 2032
- Table 9: Global APAC Open Systems Imaging Industry Revenue Million Forecast, by Region 2019 & 2032
- Table 10: Global APAC Open Systems Imaging Industry Volume K Unit Forecast, by Region 2019 & 2032
- Table 11: Global APAC Open Systems Imaging Industry Revenue Million Forecast, by Country 2019 & 2032
- Table 12: Global APAC Open Systems Imaging Industry Volume K Unit Forecast, by Country 2019 & 2032
- Table 13: United States APAC Open Systems Imaging Industry Revenue (Million) Forecast, by Application 2019 & 2032
- Table 14: United States APAC Open Systems Imaging Industry Volume (K Unit) Forecast, by Application 2019 & 2032
- Table 15: Canada APAC Open Systems Imaging Industry Revenue (Million) Forecast, by Application 2019 & 2032
- Table 16: Canada APAC Open Systems Imaging Industry Volume (K Unit) Forecast, by Application 2019 & 2032
- Table 17: Mexico APAC Open Systems Imaging Industry Revenue (Million) Forecast, by Application 2019 & 2032
- Table 18: Mexico APAC Open Systems Imaging Industry Volume (K Unit) Forecast, by Application 2019 & 2032
- Table 19: Global APAC Open Systems Imaging Industry Revenue Million Forecast, by Country 2019 & 2032
- Table 20: Global APAC Open Systems Imaging Industry Volume K Unit Forecast, by Country 2019 & 2032
- Table 21: Germany APAC Open Systems Imaging Industry Revenue (Million) Forecast, by Application 2019 & 2032
- Table 22: Germany APAC Open Systems Imaging Industry Volume (K Unit) Forecast, by Application 2019 & 2032
- Table 23: United Kingdom APAC Open Systems Imaging Industry Revenue (Million) Forecast, by Application 2019 & 2032
- Table 24: United Kingdom APAC Open Systems Imaging Industry Volume (K Unit) Forecast, by Application 2019 & 2032
- Table 25: France APAC Open Systems Imaging Industry Revenue (Million) Forecast, by Application 2019 & 2032
- Table 26: France APAC Open Systems Imaging Industry Volume (K Unit) Forecast, by Application 2019 & 2032
- Table 27: Spain APAC Open Systems Imaging Industry Revenue (Million) Forecast, by Application 2019 & 2032
- Table 28: Spain APAC Open Systems Imaging Industry Volume (K Unit) Forecast, by Application 2019 & 2032
- Table 29: Italy APAC Open Systems Imaging Industry Revenue (Million) Forecast, by Application 2019 & 2032
- Table 30: Italy APAC Open Systems Imaging Industry Volume (K Unit) Forecast, by Application 2019 & 2032
- Table 31: Spain APAC Open Systems Imaging Industry Revenue (Million) Forecast, by Application 2019 & 2032
- Table 32: Spain APAC Open Systems Imaging Industry Volume (K Unit) Forecast, by Application 2019 & 2032
- Table 33: Belgium APAC Open Systems Imaging Industry Revenue (Million) Forecast, by Application 2019 & 2032
- Table 34: Belgium APAC Open Systems Imaging Industry Volume (K Unit) Forecast, by Application 2019 & 2032
- Table 35: Netherland APAC Open Systems Imaging Industry Revenue (Million) Forecast, by Application 2019 & 2032
- Table 36: Netherland APAC Open Systems Imaging Industry Volume (K Unit) Forecast, by Application 2019 & 2032
- Table 37: Nordics APAC Open Systems Imaging Industry Revenue (Million) Forecast, by Application 2019 & 2032
- Table 38: Nordics APAC Open Systems Imaging Industry Volume (K Unit) Forecast, by Application 2019 & 2032
- Table 39: Rest of Europe APAC Open Systems Imaging Industry Revenue (Million) Forecast, by Application 2019 & 2032
- Table 40: Rest of Europe APAC Open Systems Imaging Industry Volume (K Unit) Forecast, by Application 2019 & 2032
- Table 41: Global APAC Open Systems Imaging Industry Revenue Million Forecast, by Country 2019 & 2032
- Table 42: Global APAC Open Systems Imaging Industry Volume K Unit Forecast, by Country 2019 & 2032
- Table 43: China APAC Open Systems Imaging Industry Revenue (Million) Forecast, by Application 2019 & 2032
- Table 44: China APAC Open Systems Imaging Industry Volume (K Unit) Forecast, by Application 2019 & 2032
- Table 45: Japan APAC Open Systems Imaging Industry Revenue (Million) Forecast, by Application 2019 & 2032
- Table 46: Japan APAC Open Systems Imaging Industry Volume (K Unit) Forecast, by Application 2019 & 2032
- Table 47: India APAC Open Systems Imaging Industry Revenue (Million) Forecast, by Application 2019 & 2032
- Table 48: India APAC Open Systems Imaging Industry Volume (K Unit) Forecast, by Application 2019 & 2032
- Table 49: South Korea APAC Open Systems Imaging Industry Revenue (Million) Forecast, by Application 2019 & 2032
- Table 50: South Korea APAC Open Systems Imaging Industry Volume (K Unit) Forecast, by Application 2019 & 2032
- Table 51: Southeast Asia APAC Open Systems Imaging Industry Revenue (Million) Forecast, by Application 2019 & 2032
- Table 52: Southeast Asia APAC Open Systems Imaging Industry Volume (K Unit) Forecast, by Application 2019 & 2032
- Table 53: Australia APAC Open Systems Imaging Industry Revenue (Million) Forecast, by Application 2019 & 2032
- Table 54: Australia APAC Open Systems Imaging Industry Volume (K Unit) Forecast, by Application 2019 & 2032
- Table 55: Indonesia APAC Open Systems Imaging Industry Revenue (Million) Forecast, by Application 2019 & 2032
- Table 56: Indonesia APAC Open Systems Imaging Industry Volume (K Unit) Forecast, by Application 2019 & 2032
- Table 57: Phillipes APAC Open Systems Imaging Industry Revenue (Million) Forecast, by Application 2019 & 2032
- Table 58: Phillipes APAC Open Systems Imaging Industry Volume (K Unit) Forecast, by Application 2019 & 2032
- Table 59: Singapore APAC Open Systems Imaging Industry Revenue (Million) Forecast, by Application 2019 & 2032
- Table 60: Singapore APAC Open Systems Imaging Industry Volume (K Unit) Forecast, by Application 2019 & 2032
- Table 61: Thailandc APAC Open Systems Imaging Industry Revenue (Million) Forecast, by Application 2019 & 2032
- Table 62: Thailandc APAC Open Systems Imaging Industry Volume (K Unit) Forecast, by Application 2019 & 2032
- Table 63: Rest of Asia Pacific APAC Open Systems Imaging Industry Revenue (Million) Forecast, by Application 2019 & 2032
- Table 64: Rest of Asia Pacific APAC Open Systems Imaging Industry Volume (K Unit) Forecast, by Application 2019 & 2032
- Table 65: Global APAC Open Systems Imaging Industry Revenue Million Forecast, by Country 2019 & 2032
- Table 66: Global APAC Open Systems Imaging Industry Volume K Unit Forecast, by Country 2019 & 2032
- Table 67: Brazil APAC Open Systems Imaging Industry Revenue (Million) Forecast, by Application 2019 & 2032
- Table 68: Brazil APAC Open Systems Imaging Industry Volume (K Unit) Forecast, by Application 2019 & 2032
- Table 69: Argentina APAC Open Systems Imaging Industry Revenue (Million) Forecast, by Application 2019 & 2032
- Table 70: Argentina APAC Open Systems Imaging Industry Volume (K Unit) Forecast, by Application 2019 & 2032
- Table 71: Peru APAC Open Systems Imaging Industry Revenue (Million) Forecast, by Application 2019 & 2032
- Table 72: Peru APAC Open Systems Imaging Industry Volume (K Unit) Forecast, by Application 2019 & 2032
- Table 73: Chile APAC Open Systems Imaging Industry Revenue (Million) Forecast, by Application 2019 & 2032
- Table 74: Chile APAC Open Systems Imaging Industry Volume (K Unit) Forecast, by Application 2019 & 2032
- Table 75: Colombia APAC Open Systems Imaging Industry Revenue (Million) Forecast, by Application 2019 & 2032
- Table 76: Colombia APAC Open Systems Imaging Industry Volume (K Unit) Forecast, by Application 2019 & 2032
- Table 77: Ecuador APAC Open Systems Imaging Industry Revenue (Million) Forecast, by Application 2019 & 2032
- Table 78: Ecuador APAC Open Systems Imaging Industry Volume (K Unit) Forecast, by Application 2019 & 2032
- Table 79: Venezuela APAC Open Systems Imaging Industry Revenue (Million) Forecast, by Application 2019 & 2032
- Table 80: Venezuela APAC Open Systems Imaging Industry Volume (K Unit) Forecast, by Application 2019 & 2032
- Table 81: Rest of South America APAC Open Systems Imaging Industry Revenue (Million) Forecast, by Application 2019 & 2032
- Table 82: Rest of South America APAC Open Systems Imaging Industry Volume (K Unit) Forecast, by Application 2019 & 2032
- Table 83: Global APAC Open Systems Imaging Industry Revenue Million Forecast, by Country 2019 & 2032
- Table 84: Global APAC Open Systems Imaging Industry Volume K Unit Forecast, by Country 2019 & 2032
- Table 85: United States APAC Open Systems Imaging Industry Revenue (Million) Forecast, by Application 2019 & 2032
- Table 86: United States APAC Open Systems Imaging Industry Volume (K Unit) Forecast, by Application 2019 & 2032
- Table 87: Canada APAC Open Systems Imaging Industry Revenue (Million) Forecast, by Application 2019 & 2032
- Table 88: Canada APAC Open Systems Imaging Industry Volume (K Unit) Forecast, by Application 2019 & 2032
- Table 89: Mexico APAC Open Systems Imaging Industry Revenue (Million) Forecast, by Application 2019 & 2032
- Table 90: Mexico APAC Open Systems Imaging Industry Volume (K Unit) Forecast, by Application 2019 & 2032
- Table 91: Global APAC Open Systems Imaging Industry Revenue Million Forecast, by Country 2019 & 2032
- Table 92: Global APAC Open Systems Imaging Industry Volume K Unit Forecast, by Country 2019 & 2032
- Table 93: United Arab Emirates APAC Open Systems Imaging Industry Revenue (Million) Forecast, by Application 2019 & 2032
- Table 94: United Arab Emirates APAC Open Systems Imaging Industry Volume (K Unit) Forecast, by Application 2019 & 2032
- Table 95: Saudi Arabia APAC Open Systems Imaging Industry Revenue (Million) Forecast, by Application 2019 & 2032
- Table 96: Saudi Arabia APAC Open Systems Imaging Industry Volume (K Unit) Forecast, by Application 2019 & 2032
- Table 97: South Africa APAC Open Systems Imaging Industry Revenue (Million) Forecast, by Application 2019 & 2032
- Table 98: South Africa APAC Open Systems Imaging Industry Volume (K Unit) Forecast, by Application 2019 & 2032
- Table 99: Rest of Middle East and Africa APAC Open Systems Imaging Industry Revenue (Million) Forecast, by Application 2019 & 2032
- Table 100: Rest of Middle East and Africa APAC Open Systems Imaging Industry Volume (K Unit) Forecast, by Application 2019 & 2032
- Table 101: Global APAC Open Systems Imaging Industry Revenue Million Forecast, by Resolution 2019 & 2032
- Table 102: Global APAC Open Systems Imaging Industry Volume K Unit Forecast, by Resolution 2019 & 2032
- Table 103: Global APAC Open Systems Imaging Industry Revenue Million Forecast, by Application 2019 & 2032
- Table 104: Global APAC Open Systems Imaging Industry Volume K Unit Forecast, by Application 2019 & 2032
- Table 105: Global APAC Open Systems Imaging Industry Revenue Million Forecast, by Geography 2019 & 2032
- Table 106: Global APAC Open Systems Imaging Industry Volume K Unit Forecast, by Geography 2019 & 2032
- Table 107: Global APAC Open Systems Imaging Industry Revenue Million Forecast, by Country 2019 & 2032
- Table 108: Global APAC Open Systems Imaging Industry Volume K Unit Forecast, by Country 2019 & 2032
- Table 109: China APAC Open Systems Imaging Industry Revenue (Million) Forecast, by Application 2019 & 2032
- Table 110: China APAC Open Systems Imaging Industry Volume (K Unit) Forecast, by Application 2019 & 2032
- Table 111: Japan APAC Open Systems Imaging Industry Revenue (Million) Forecast, by Application 2019 & 2032
- Table 112: Japan APAC Open Systems Imaging Industry Volume (K Unit) Forecast, by Application 2019 & 2032
- Table 113: India APAC Open Systems Imaging Industry Revenue (Million) Forecast, by Application 2019 & 2032
- Table 114: India APAC Open Systems Imaging Industry Volume (K Unit) Forecast, by Application 2019 & 2032
- Table 115: Australia APAC Open Systems Imaging Industry Revenue (Million) Forecast, by Application 2019 & 2032
- Table 116: Australia APAC Open Systems Imaging Industry Volume (K Unit) Forecast, by Application 2019 & 2032
- Table 117: South Korea APAC Open Systems Imaging Industry Revenue (Million) Forecast, by Application 2019 & 2032
- Table 118: South Korea APAC Open Systems Imaging Industry Volume (K Unit) Forecast, by Application 2019 & 2032
- Table 119: Rest of Asia Pacific APAC Open Systems Imaging Industry Revenue (Million) Forecast, by Application 2019 & 2032
- Table 120: Rest of Asia Pacific APAC Open Systems Imaging Industry Volume (K Unit) Forecast, by Application 2019 & 2032
Frequently Asked Questions
1. What is the projected Compound Annual Growth Rate (CAGR) of the APAC Open Systems Imaging Industry?
The projected CAGR is approximately 7.77%.
2. Which companies are prominent players in the APAC Open Systems Imaging Industry?
Key companies in the market include ESAOTE SA, Siemens Healthcare, SHENZHEN BASDA MEDICAL APPARATUS CO LTD, Philips Healthcare, Mindray, Hitachi Medical Corporation, Canon Medical Systems Corporation.
3. What are the main segments of the APAC Open Systems Imaging Industry?
The market segments include Resolution, Application, Geography.
4. Can you provide details about the market size?
The market size is estimated to be USD 338.09 Million as of 2022.
5. What are some drivers contributing to market growth?
; Increasing Number of MRI Procedures; Increasing Applications in Clinical Diagnosis and Increasing Disease Burden.
6. What are the notable trends driving market growth?
Application in Neurology is Expected to Dominate the Asia Pacific Open System MRI Market.
7. Are there any restraints impacting market growth?
; High Cost of Open MRI Systems.
8. Can you provide examples of recent developments in the market?
N/A
9. What pricing options are available for accessing the report?
Pricing options include single-user, multi-user, and enterprise licenses priced at USD 4750, USD 5250, and USD 8750 respectively.
10. Is the market size provided in terms of value or volume?
The market size is provided in terms of value, measured in Million and volume, measured in K Unit.
11. Are there any specific market keywords associated with the report?
Yes, the market keyword associated with the report is "APAC Open Systems Imaging Industry," which aids in identifying and referencing the specific market segment covered.
12. How do I determine which pricing option suits my needs best?
The pricing options vary based on user requirements and access needs. Individual users may opt for single-user licenses, while businesses requiring broader access may choose multi-user or enterprise licenses for cost-effective access to the report.
13. Are there any additional resources or data provided in the APAC Open Systems Imaging Industry report?
While the report offers comprehensive insights, it's advisable to review the specific contents or supplementary materials provided to ascertain if additional resources or data are available.
14. How can I stay updated on further developments or reports in the APAC Open Systems Imaging Industry?
To stay informed about further developments, trends, and reports in the APAC Open Systems Imaging Industry, consider subscribing to industry newsletters, following relevant companies and organizations, or regularly checking reputable industry news sources and publications.
Methodology
Step 1 - Identification of Relevant Samples Size from Population Database


Step 2 - Approaches for Defining Global Market Size (Value, Volume* & Price*)

Note*: In applicable scenarios
Step 3 - Data Sources
Primary Research
- Web Analytics
- Survey Reports
- Research Institute
- Latest Research Reports
- Opinion Leaders
Secondary Research
- Annual Reports
- White Paper
- Latest Press Release
- Industry Association
- Paid Database
- Investor Presentations

Step 4 - Data Triangulation
Involves using different sources of information in order to increase the validity of a study
These sources are likely to be stakeholders in a program - participants, other researchers, program staff, other community members, and so on.
Then we put all data in single framework & apply various statistical tools to find out the dynamic on the market.
During the analysis stage, feedback from the stakeholder groups would be compared to determine areas of agreement as well as areas of divergence
