

Key Insights
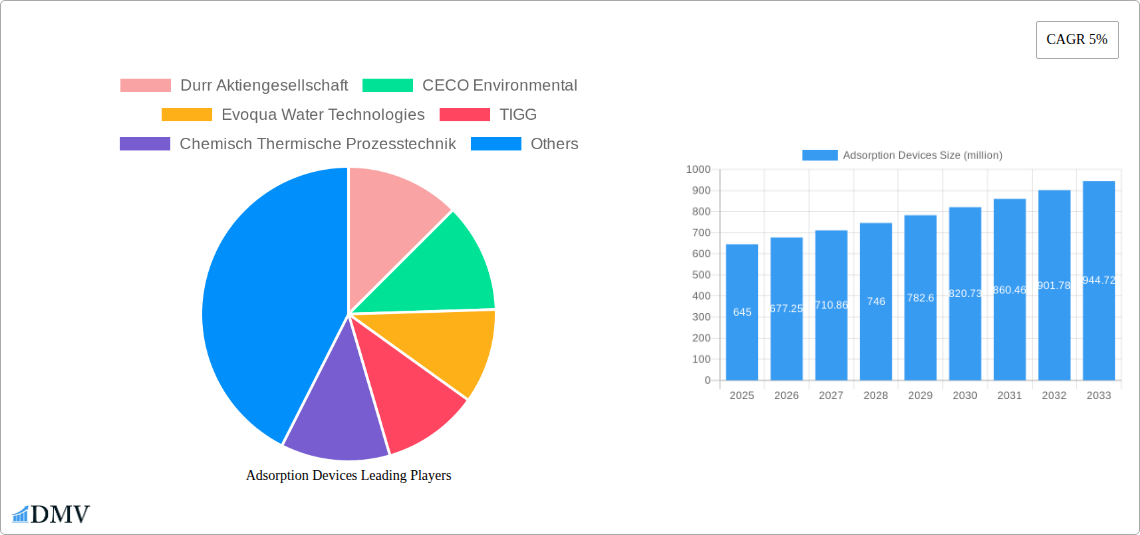
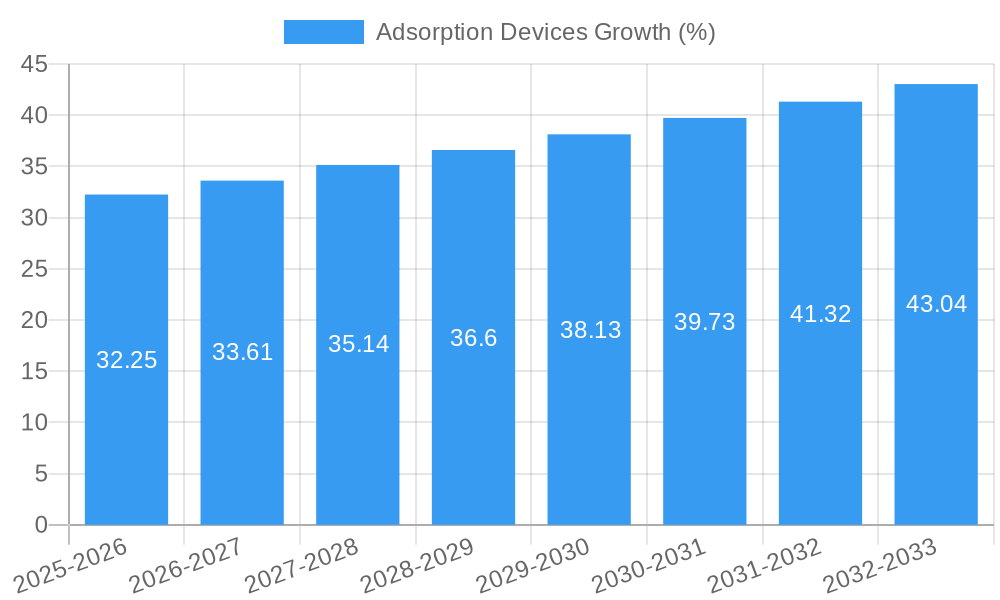
The adsorption devices market, currently valued at $645 million in 2025, is projected to experience robust growth, driven by increasing industrial wastewater treatment needs and stringent environmental regulations globally. The 5% CAGR indicates a steady expansion over the forecast period (2025-2033), with market size exceeding $850 million by 2033. Key drivers include the rising demand for clean water in various sectors like pharmaceuticals, chemicals, and food processing, coupled with the increasing adoption of advanced adsorption technologies offering higher efficiency and cost-effectiveness compared to traditional methods. Growth is further fueled by technological advancements in adsorbent materials, leading to improved adsorption capacities and selectivity. While challenges like high initial investment costs and potential regeneration complexities exist, the long-term benefits of efficient pollutant removal are overriding these restraints, especially with the increasing focus on sustainable practices and circular economy models. The market is segmented by various factors, including adsorption technology (e.g., activated carbon adsorption, zeolite adsorption), application (e.g., water purification, air purification, gas separation), and end-use industry. Major players like Dürr Aktiengesellschaft, CECO Environmental, and Evoqua Water Technologies are actively shaping the market through technological innovations and strategic acquisitions.
The competitive landscape is characterized by both established players and emerging companies offering specialized solutions. Continuous innovation in adsorbent materials, along with the development of advanced process control systems, are expected to further propel market growth. Regional variations are anticipated, with North America and Europe likely holding significant market shares due to the presence of established industries and stringent environmental regulations. However, the Asia-Pacific region is predicted to witness faster growth rates due to rapid industrialization and increasing investments in water and air purification infrastructure. The market's future prospects remain positive, driven by the ever-growing need for sustainable and efficient pollution control technologies across diverse industries and geographic locations. This growth trajectory is expected to continue, with consistent improvement in technological efficiency and decreasing cost of production, leading to a wider adoption of adsorption devices.
Adsorption Devices Market Report: A Comprehensive Analysis (2019-2033)
This insightful report provides a comprehensive analysis of the global Adsorption Devices market, projecting a market value exceeding $XX million by 2033. The study covers the historical period (2019-2024), the base year (2025), and the forecast period (2025-2033), offering invaluable insights for stakeholders across the industry. Key players like Dürr Aktiengesellschaft, CECO Environmental, Evoqua Water Technologies, and others are profiled, providing a granular understanding of market dynamics and future trends.
Adsorption Devices Market Composition & Trends
The global adsorption devices market is moderately concentrated, with the top five players commanding approximately 40% market share in 2025. Innovation is primarily driven by advancements in material science, leading to enhanced adsorption capacity and selectivity. Stringent environmental regulations, particularly concerning air and water quality, are key catalysts for market growth. Substitute technologies, such as membrane filtration, present competition, but adsorption's unique advantages in specific applications maintain its relevance. The end-user profile is diverse, encompassing industrial, municipal, and commercial sectors, with the industrial segment dominating due to high-volume applications. Significant M&A activity has been observed in recent years, with deal values exceeding $XX million annually.
- Market Share Distribution (2025): Top 5 players: 40%; Remaining players: 60%
- M&A Activity (2019-2024): Total deal value exceeding $XX million.
- Key End-Users: Industrial, Municipal, Commercial.
- Innovation Drivers: Advancements in adsorbent materials, process optimization.
Adsorption Devices Industry Evolution
The adsorption devices market has experienced robust growth during the historical period (2019-2024), registering a CAGR of XX%. This growth is attributed to several factors including increasing industrialization, stricter environmental regulations, and rising consumer awareness of environmental issues. Technological advancements, particularly in the development of novel adsorbent materials with improved efficiency and selectivity, have further propelled market expansion. Consumer demand is shifting towards more sustainable and energy-efficient solutions, driving the adoption of advanced adsorption technologies. We project a CAGR of XX% during the forecast period (2025-2033), reaching a market value exceeding $XX million by 2033. Adoption rates are expected to increase significantly in emerging economies due to rising industrial activity and government initiatives focused on environmental protection.
Leading Regions, Countries, or Segments in Adsorption Devices
The North American region holds a dominant position in the global adsorption devices market in 2025, driven by stringent environmental regulations, a robust industrial base, and significant investments in water and air purification technologies.
- Key Drivers in North America:
- Stringent environmental regulations and enforcement.
- High levels of industrial activity and manufacturing.
- Significant investments in R&D and infrastructure development.
- Growing awareness regarding water scarcity and air pollution.
The dominance of North America is largely attributed to factors such as higher per capita income, advanced infrastructure, and a strong regulatory framework promoting environmental sustainability. Europe and Asia-Pacific also exhibit significant growth potential, fueled by rising industrialization and government initiatives to mitigate environmental pollution.
Adsorption Devices Product Innovations
Recent innovations focus on developing high-performance adsorbents with enhanced selectivity and capacity, enabling efficient removal of specific pollutants. This includes advancements in activated carbon, zeolites, and metal-organic frameworks (MOFs). New applications are emerging in areas like CO2 capture, volatile organic compound (VOC) removal, and pharmaceutical purification. Performance metrics are improving continuously, with higher adsorption capacities, faster adsorption rates, and enhanced regeneration capabilities.
Propelling Factors for Adsorption Devices Growth
The growth of the adsorption devices market is driven by several key factors. Stringent environmental regulations globally are pushing industries to adopt cleaner technologies. The increasing demand for clean water and air, especially in rapidly developing economies, fuels the market. Technological advancements in adsorbent materials are making adsorption a more efficient and cost-effective solution. Government incentives and subsidies for clean technologies further accelerate market expansion. For example, the US and EU are heavily investing in carbon capture technologies which utilizes adsorption.
Obstacles in the Adsorption Devices Market
High upfront capital costs associated with implementing adsorption systems can be a significant barrier to entry, particularly for smaller businesses. Supply chain disruptions, especially related to the availability of raw materials for adsorbent production, can impact market growth. Intense competition from substitute technologies like membrane filtration and other separation processes poses a challenge. Regulatory uncertainties and inconsistencies across different regions can also create obstacles for market expansion. These factors collectively impact the market's growth trajectory, potentially slowing down its expansion in specific sectors.
Future Opportunities in Adsorption Devices
Emerging opportunities lie in the development of novel adsorbent materials with enhanced properties, such as improved selectivity and regeneration capabilities. Expansion into new applications, particularly in the fields of renewable energy and resource recovery, presents substantial growth potential. The increasing demand for portable and decentralized water and air purification systems creates opportunities for miniaturized and energy-efficient adsorption devices. Developing cost-effective solutions will be crucial to expanding market penetration in emerging economies.
Major Players in the Adsorption Devices Ecosystem
- Durr Aktiengesellschaft
- CECO Environmental
- Evoqua Water Technologies
- TIGG
- Chemisch Thermische Prozesstechnik
- TAIKISHA LIMITED
- Environmental C & C Inc.
- Gulf Coast Environmental Systems
- Monroe Environmental
Key Developments in Adsorption Devices Industry
- 2022 Q3: Evoqua Water Technologies launched a new line of advanced adsorption filters for industrial wastewater treatment.
- 2023 Q1: Dürr Aktiengesellschaft partnered with a leading material science company to develop novel adsorbents for CO2 capture.
- 2024 Q2: Significant investment in R&D of MOF based adsorbents by several companies. (Further details need to be added here based on actual data)
Strategic Adsorption Devices Market Forecast
The global adsorption devices market is poised for significant growth driven by increasing environmental concerns and the development of innovative technologies. Future opportunities lie in expanding applications, improving adsorbent materials, and addressing the cost challenges. Government support for clean technologies and rising consumer awareness will further drive market expansion, resulting in a market value exceeding $XX million by 2033. The focus on sustainable and energy-efficient solutions will shape the future landscape of the adsorption devices market.
Adsorption Devices Segmentation
-
1. Application
- 1.1. Automotive Paints
- 1.2. Chemical
- 1.3. Semiconductor
- 1.4. Printing
-
2. Type
- 2.1. Less than 10,000 CFM
- 2.2. 10,000-50,000 CFM
- 2.3. More than 50,000 CFM
Adsorption Devices Segmentation By Geography
-
1. North America
- 1.1. United States
- 1.2. Canada
- 1.3. Mexico
-
2. South America
- 2.1. Brazil
- 2.2. Argentina
- 2.3. Rest of South America
-
3. Europe
- 3.1. United Kingdom
- 3.2. Germany
- 3.3. France
- 3.4. Italy
- 3.5. Spain
- 3.6. Russia
- 3.7. Benelux
- 3.8. Nordics
- 3.9. Rest of Europe
-
4. Middle East & Africa
- 4.1. Turkey
- 4.2. Israel
- 4.3. GCC
- 4.4. North Africa
- 4.5. South Africa
- 4.6. Rest of Middle East & Africa
-
5. Asia Pacific
- 5.1. China
- 5.2. India
- 5.3. Japan
- 5.4. South Korea
- 5.5. ASEAN
- 5.6. Oceania
- 5.7. Rest of Asia Pacific

Adsorption Devices REPORT HIGHLIGHTS
| Aspects | Details |
|---|---|
| Study Period | 2019-2033 |
| Base Year | 2024 |
| Estimated Year | 2025 |
| Forecast Period | 2025-2033 |
| Historical Period | 2019-2024 |
| Growth Rate | CAGR of 5% from 2019-2033 |
| Segmentation |
|
Table of Contents
- 1. Introduction
- 1.1. Research Scope
- 1.2. Market Segmentation
- 1.3. Research Methodology
- 1.4. Definitions and Assumptions
- 2. Executive Summary
- 2.1. Introduction
- 3. Market Dynamics
- 3.1. Introduction
- 3.2. Market Drivers
- 3.3. Market Restrains
- 3.4. Market Trends
- 4. Market Factor Analysis
- 4.1. Porters Five Forces
- 4.2. Supply/Value Chain
- 4.3. PESTEL analysis
- 4.4. Market Entropy
- 4.5. Patent/Trademark Analysis
- 5. Global Adsorption Devices Analysis, Insights and Forecast, 2019-2031
- 5.1. Market Analysis, Insights and Forecast - by Application
- 5.1.1. Automotive Paints
- 5.1.2. Chemical
- 5.1.3. Semiconductor
- 5.1.4. Printing
- 5.2. Market Analysis, Insights and Forecast - by Type
- 5.2.1. Less than 10,000 CFM
- 5.2.2. 10,000-50,000 CFM
- 5.2.3. More than 50,000 CFM
- 5.3. Market Analysis, Insights and Forecast - by Region
- 5.3.1. North America
- 5.3.2. South America
- 5.3.3. Europe
- 5.3.4. Middle East & Africa
- 5.3.5. Asia Pacific
- 5.1. Market Analysis, Insights and Forecast - by Application
- 6. North America Adsorption Devices Analysis, Insights and Forecast, 2019-2031
- 6.1. Market Analysis, Insights and Forecast - by Application
- 6.1.1. Automotive Paints
- 6.1.2. Chemical
- 6.1.3. Semiconductor
- 6.1.4. Printing
- 6.2. Market Analysis, Insights and Forecast - by Type
- 6.2.1. Less than 10,000 CFM
- 6.2.2. 10,000-50,000 CFM
- 6.2.3. More than 50,000 CFM
- 6.1. Market Analysis, Insights and Forecast - by Application
- 7. South America Adsorption Devices Analysis, Insights and Forecast, 2019-2031
- 7.1. Market Analysis, Insights and Forecast - by Application
- 7.1.1. Automotive Paints
- 7.1.2. Chemical
- 7.1.3. Semiconductor
- 7.1.4. Printing
- 7.2. Market Analysis, Insights and Forecast - by Type
- 7.2.1. Less than 10,000 CFM
- 7.2.2. 10,000-50,000 CFM
- 7.2.3. More than 50,000 CFM
- 7.1. Market Analysis, Insights and Forecast - by Application
- 8. Europe Adsorption Devices Analysis, Insights and Forecast, 2019-2031
- 8.1. Market Analysis, Insights and Forecast - by Application
- 8.1.1. Automotive Paints
- 8.1.2. Chemical
- 8.1.3. Semiconductor
- 8.1.4. Printing
- 8.2. Market Analysis, Insights and Forecast - by Type
- 8.2.1. Less than 10,000 CFM
- 8.2.2. 10,000-50,000 CFM
- 8.2.3. More than 50,000 CFM
- 8.1. Market Analysis, Insights and Forecast - by Application
- 9. Middle East & Africa Adsorption Devices Analysis, Insights and Forecast, 2019-2031
- 9.1. Market Analysis, Insights and Forecast - by Application
- 9.1.1. Automotive Paints
- 9.1.2. Chemical
- 9.1.3. Semiconductor
- 9.1.4. Printing
- 9.2. Market Analysis, Insights and Forecast - by Type
- 9.2.1. Less than 10,000 CFM
- 9.2.2. 10,000-50,000 CFM
- 9.2.3. More than 50,000 CFM
- 9.1. Market Analysis, Insights and Forecast - by Application
- 10. Asia Pacific Adsorption Devices Analysis, Insights and Forecast, 2019-2031
- 10.1. Market Analysis, Insights and Forecast - by Application
- 10.1.1. Automotive Paints
- 10.1.2. Chemical
- 10.1.3. Semiconductor
- 10.1.4. Printing
- 10.2. Market Analysis, Insights and Forecast - by Type
- 10.2.1. Less than 10,000 CFM
- 10.2.2. 10,000-50,000 CFM
- 10.2.3. More than 50,000 CFM
- 10.1. Market Analysis, Insights and Forecast - by Application
- 11. Competitive Analysis
- 11.1. Global Market Share Analysis 2024
- 11.2. Company Profiles
- 11.2.1 Durr Aktiengesellschaft
- 11.2.1.1. Overview
- 11.2.1.2. Products
- 11.2.1.3. SWOT Analysis
- 11.2.1.4. Recent Developments
- 11.2.1.5. Financials (Based on Availability)
- 11.2.2 CECO Environmental
- 11.2.2.1. Overview
- 11.2.2.2. Products
- 11.2.2.3. SWOT Analysis
- 11.2.2.4. Recent Developments
- 11.2.2.5. Financials (Based on Availability)
- 11.2.3 Evoqua Water Technologies
- 11.2.3.1. Overview
- 11.2.3.2. Products
- 11.2.3.3. SWOT Analysis
- 11.2.3.4. Recent Developments
- 11.2.3.5. Financials (Based on Availability)
- 11.2.4 TIGG
- 11.2.4.1. Overview
- 11.2.4.2. Products
- 11.2.4.3. SWOT Analysis
- 11.2.4.4. Recent Developments
- 11.2.4.5. Financials (Based on Availability)
- 11.2.5 Chemisch Thermische Prozesstechnik
- 11.2.5.1. Overview
- 11.2.5.2. Products
- 11.2.5.3. SWOT Analysis
- 11.2.5.4. Recent Developments
- 11.2.5.5. Financials (Based on Availability)
- 11.2.6 TAIKISHA LIMITED
- 11.2.6.1. Overview
- 11.2.6.2. Products
- 11.2.6.3. SWOT Analysis
- 11.2.6.4. Recent Developments
- 11.2.6.5. Financials (Based on Availability)
- 11.2.7 Environmental C & C Inc.
- 11.2.7.1. Overview
- 11.2.7.2. Products
- 11.2.7.3. SWOT Analysis
- 11.2.7.4. Recent Developments
- 11.2.7.5. Financials (Based on Availability)
- 11.2.8 Gulf Coast Environmental Systems
- 11.2.8.1. Overview
- 11.2.8.2. Products
- 11.2.8.3. SWOT Analysis
- 11.2.8.4. Recent Developments
- 11.2.8.5. Financials (Based on Availability)
- 11.2.9 Monroe Environmental
- 11.2.9.1. Overview
- 11.2.9.2. Products
- 11.2.9.3. SWOT Analysis
- 11.2.9.4. Recent Developments
- 11.2.9.5. Financials (Based on Availability)
- 11.2.1 Durr Aktiengesellschaft
List of Figures
- Figure 1: Global Adsorption Devices Revenue Breakdown (million, %) by Region 2024 & 2032
- Figure 2: North America Adsorption Devices Revenue (million), by Application 2024 & 2032
- Figure 3: North America Adsorption Devices Revenue Share (%), by Application 2024 & 2032
- Figure 4: North America Adsorption Devices Revenue (million), by Type 2024 & 2032
- Figure 5: North America Adsorption Devices Revenue Share (%), by Type 2024 & 2032
- Figure 6: North America Adsorption Devices Revenue (million), by Country 2024 & 2032
- Figure 7: North America Adsorption Devices Revenue Share (%), by Country 2024 & 2032
- Figure 8: South America Adsorption Devices Revenue (million), by Application 2024 & 2032
- Figure 9: South America Adsorption Devices Revenue Share (%), by Application 2024 & 2032
- Figure 10: South America Adsorption Devices Revenue (million), by Type 2024 & 2032
- Figure 11: South America Adsorption Devices Revenue Share (%), by Type 2024 & 2032
- Figure 12: South America Adsorption Devices Revenue (million), by Country 2024 & 2032
- Figure 13: South America Adsorption Devices Revenue Share (%), by Country 2024 & 2032
- Figure 14: Europe Adsorption Devices Revenue (million), by Application 2024 & 2032
- Figure 15: Europe Adsorption Devices Revenue Share (%), by Application 2024 & 2032
- Figure 16: Europe Adsorption Devices Revenue (million), by Type 2024 & 2032
- Figure 17: Europe Adsorption Devices Revenue Share (%), by Type 2024 & 2032
- Figure 18: Europe Adsorption Devices Revenue (million), by Country 2024 & 2032
- Figure 19: Europe Adsorption Devices Revenue Share (%), by Country 2024 & 2032
- Figure 20: Middle East & Africa Adsorption Devices Revenue (million), by Application 2024 & 2032
- Figure 21: Middle East & Africa Adsorption Devices Revenue Share (%), by Application 2024 & 2032
- Figure 22: Middle East & Africa Adsorption Devices Revenue (million), by Type 2024 & 2032
- Figure 23: Middle East & Africa Adsorption Devices Revenue Share (%), by Type 2024 & 2032
- Figure 24: Middle East & Africa Adsorption Devices Revenue (million), by Country 2024 & 2032
- Figure 25: Middle East & Africa Adsorption Devices Revenue Share (%), by Country 2024 & 2032
- Figure 26: Asia Pacific Adsorption Devices Revenue (million), by Application 2024 & 2032
- Figure 27: Asia Pacific Adsorption Devices Revenue Share (%), by Application 2024 & 2032
- Figure 28: Asia Pacific Adsorption Devices Revenue (million), by Type 2024 & 2032
- Figure 29: Asia Pacific Adsorption Devices Revenue Share (%), by Type 2024 & 2032
- Figure 30: Asia Pacific Adsorption Devices Revenue (million), by Country 2024 & 2032
- Figure 31: Asia Pacific Adsorption Devices Revenue Share (%), by Country 2024 & 2032
List of Tables
- Table 1: Global Adsorption Devices Revenue million Forecast, by Region 2019 & 2032
- Table 2: Global Adsorption Devices Revenue million Forecast, by Application 2019 & 2032
- Table 3: Global Adsorption Devices Revenue million Forecast, by Type 2019 & 2032
- Table 4: Global Adsorption Devices Revenue million Forecast, by Region 2019 & 2032
- Table 5: Global Adsorption Devices Revenue million Forecast, by Application 2019 & 2032
- Table 6: Global Adsorption Devices Revenue million Forecast, by Type 2019 & 2032
- Table 7: Global Adsorption Devices Revenue million Forecast, by Country 2019 & 2032
- Table 8: United States Adsorption Devices Revenue (million) Forecast, by Application 2019 & 2032
- Table 9: Canada Adsorption Devices Revenue (million) Forecast, by Application 2019 & 2032
- Table 10: Mexico Adsorption Devices Revenue (million) Forecast, by Application 2019 & 2032
- Table 11: Global Adsorption Devices Revenue million Forecast, by Application 2019 & 2032
- Table 12: Global Adsorption Devices Revenue million Forecast, by Type 2019 & 2032
- Table 13: Global Adsorption Devices Revenue million Forecast, by Country 2019 & 2032
- Table 14: Brazil Adsorption Devices Revenue (million) Forecast, by Application 2019 & 2032
- Table 15: Argentina Adsorption Devices Revenue (million) Forecast, by Application 2019 & 2032
- Table 16: Rest of South America Adsorption Devices Revenue (million) Forecast, by Application 2019 & 2032
- Table 17: Global Adsorption Devices Revenue million Forecast, by Application 2019 & 2032
- Table 18: Global Adsorption Devices Revenue million Forecast, by Type 2019 & 2032
- Table 19: Global Adsorption Devices Revenue million Forecast, by Country 2019 & 2032
- Table 20: United Kingdom Adsorption Devices Revenue (million) Forecast, by Application 2019 & 2032
- Table 21: Germany Adsorption Devices Revenue (million) Forecast, by Application 2019 & 2032
- Table 22: France Adsorption Devices Revenue (million) Forecast, by Application 2019 & 2032
- Table 23: Italy Adsorption Devices Revenue (million) Forecast, by Application 2019 & 2032
- Table 24: Spain Adsorption Devices Revenue (million) Forecast, by Application 2019 & 2032
- Table 25: Russia Adsorption Devices Revenue (million) Forecast, by Application 2019 & 2032
- Table 26: Benelux Adsorption Devices Revenue (million) Forecast, by Application 2019 & 2032
- Table 27: Nordics Adsorption Devices Revenue (million) Forecast, by Application 2019 & 2032
- Table 28: Rest of Europe Adsorption Devices Revenue (million) Forecast, by Application 2019 & 2032
- Table 29: Global Adsorption Devices Revenue million Forecast, by Application 2019 & 2032
- Table 30: Global Adsorption Devices Revenue million Forecast, by Type 2019 & 2032
- Table 31: Global Adsorption Devices Revenue million Forecast, by Country 2019 & 2032
- Table 32: Turkey Adsorption Devices Revenue (million) Forecast, by Application 2019 & 2032
- Table 33: Israel Adsorption Devices Revenue (million) Forecast, by Application 2019 & 2032
- Table 34: GCC Adsorption Devices Revenue (million) Forecast, by Application 2019 & 2032
- Table 35: North Africa Adsorption Devices Revenue (million) Forecast, by Application 2019 & 2032
- Table 36: South Africa Adsorption Devices Revenue (million) Forecast, by Application 2019 & 2032
- Table 37: Rest of Middle East & Africa Adsorption Devices Revenue (million) Forecast, by Application 2019 & 2032
- Table 38: Global Adsorption Devices Revenue million Forecast, by Application 2019 & 2032
- Table 39: Global Adsorption Devices Revenue million Forecast, by Type 2019 & 2032
- Table 40: Global Adsorption Devices Revenue million Forecast, by Country 2019 & 2032
- Table 41: China Adsorption Devices Revenue (million) Forecast, by Application 2019 & 2032
- Table 42: India Adsorption Devices Revenue (million) Forecast, by Application 2019 & 2032
- Table 43: Japan Adsorption Devices Revenue (million) Forecast, by Application 2019 & 2032
- Table 44: South Korea Adsorption Devices Revenue (million) Forecast, by Application 2019 & 2032
- Table 45: ASEAN Adsorption Devices Revenue (million) Forecast, by Application 2019 & 2032
- Table 46: Oceania Adsorption Devices Revenue (million) Forecast, by Application 2019 & 2032
- Table 47: Rest of Asia Pacific Adsorption Devices Revenue (million) Forecast, by Application 2019 & 2032
Frequently Asked Questions
1. What is the projected Compound Annual Growth Rate (CAGR) of the Adsorption Devices?
The projected CAGR is approximately 5%.
2. Which companies are prominent players in the Adsorption Devices?
Key companies in the market include Durr Aktiengesellschaft, CECO Environmental, Evoqua Water Technologies, TIGG, Chemisch Thermische Prozesstechnik, TAIKISHA LIMITED, Environmental C & C Inc., Gulf Coast Environmental Systems, Monroe Environmental.
3. What are the main segments of the Adsorption Devices?
The market segments include Application, Type.
4. Can you provide details about the market size?
The market size is estimated to be USD 645 million as of 2022.
5. What are some drivers contributing to market growth?
N/A
6. What are the notable trends driving market growth?
N/A
7. Are there any restraints impacting market growth?
N/A
8. Can you provide examples of recent developments in the market?
N/A
9. What pricing options are available for accessing the report?
Pricing options include single-user, multi-user, and enterprise licenses priced at USD 2900.00, USD 4350.00, and USD 5800.00 respectively.
10. Is the market size provided in terms of value or volume?
The market size is provided in terms of value, measured in million.
11. Are there any specific market keywords associated with the report?
Yes, the market keyword associated with the report is "Adsorption Devices," which aids in identifying and referencing the specific market segment covered.
12. How do I determine which pricing option suits my needs best?
The pricing options vary based on user requirements and access needs. Individual users may opt for single-user licenses, while businesses requiring broader access may choose multi-user or enterprise licenses for cost-effective access to the report.
13. Are there any additional resources or data provided in the Adsorption Devices report?
While the report offers comprehensive insights, it's advisable to review the specific contents or supplementary materials provided to ascertain if additional resources or data are available.
14. How can I stay updated on further developments or reports in the Adsorption Devices?
To stay informed about further developments, trends, and reports in the Adsorption Devices, consider subscribing to industry newsletters, following relevant companies and organizations, or regularly checking reputable industry news sources and publications.
Methodology
Step 1 - Identification of Relevant Samples Size from Population Database


Step 2 - Approaches for Defining Global Market Size (Value, Volume* & Price*)

Note*: In applicable scenarios
Step 3 - Data Sources
Primary Research
- Web Analytics
- Survey Reports
- Research Institute
- Latest Research Reports
- Opinion Leaders
Secondary Research
- Annual Reports
- White Paper
- Latest Press Release
- Industry Association
- Paid Database
- Investor Presentations

Step 4 - Data Triangulation
Involves using different sources of information in order to increase the validity of a study
These sources are likely to be stakeholders in a program - participants, other researchers, program staff, other community members, and so on.
Then we put all data in single framework & apply various statistical tools to find out the dynamic on the market.
During the analysis stage, feedback from the stakeholder groups would be compared to determine areas of agreement as well as areas of divergence
