

Key Insights
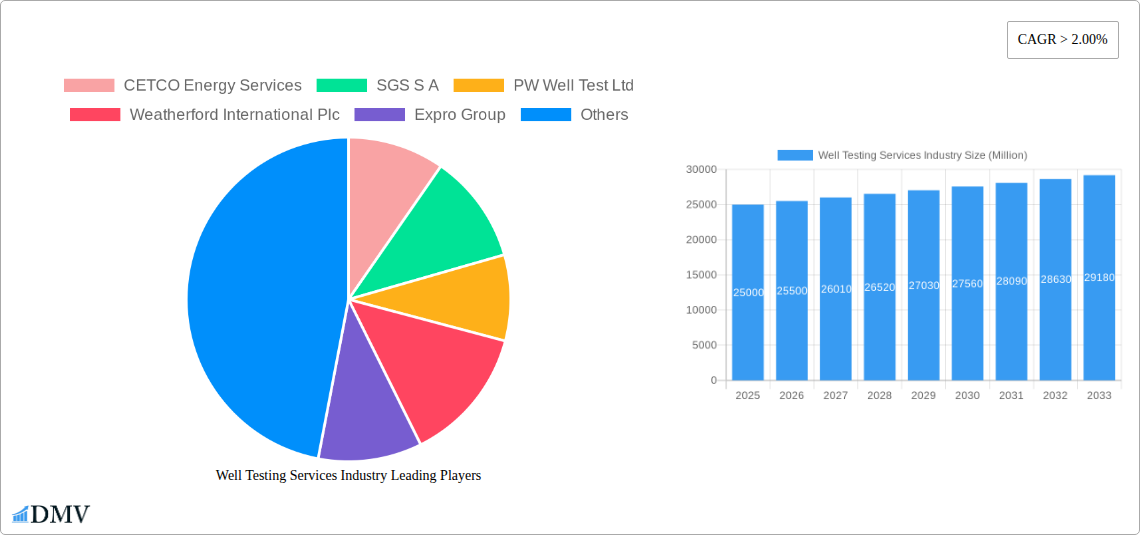
The global well testing services market, currently experiencing robust growth with a CAGR exceeding 2.00%, is poised for significant expansion throughout the forecast period (2025-2033). Driven by increasing oil and gas exploration and production activities worldwide, particularly in unconventional resource plays like shale gas and tight oil, the demand for efficient and reliable well testing services is steadily rising. Technological advancements, such as the adoption of automated and remote well testing solutions, are enhancing operational efficiency and reducing costs, further stimulating market growth. The market is segmented by stage (exploration, appraisal & development, production) and location (onshore, offshore), with offshore deployments presenting a lucrative segment due to the complexities involved and higher service requirements. Key players, including CETCO Energy Services, SGS S.A., PW Well Test Ltd, Weatherford International Plc, Expro Group, TETRA Technologies Inc, Baker Hughes Company, Halliburton Company, Schlumberger Limited, and China Oilfield Services Limited, are actively investing in research and development to offer advanced well testing solutions and expand their global reach. While regulatory hurdles and fluctuating oil and gas prices present potential restraints, the long-term outlook remains positive, driven by the sustained global energy demand.
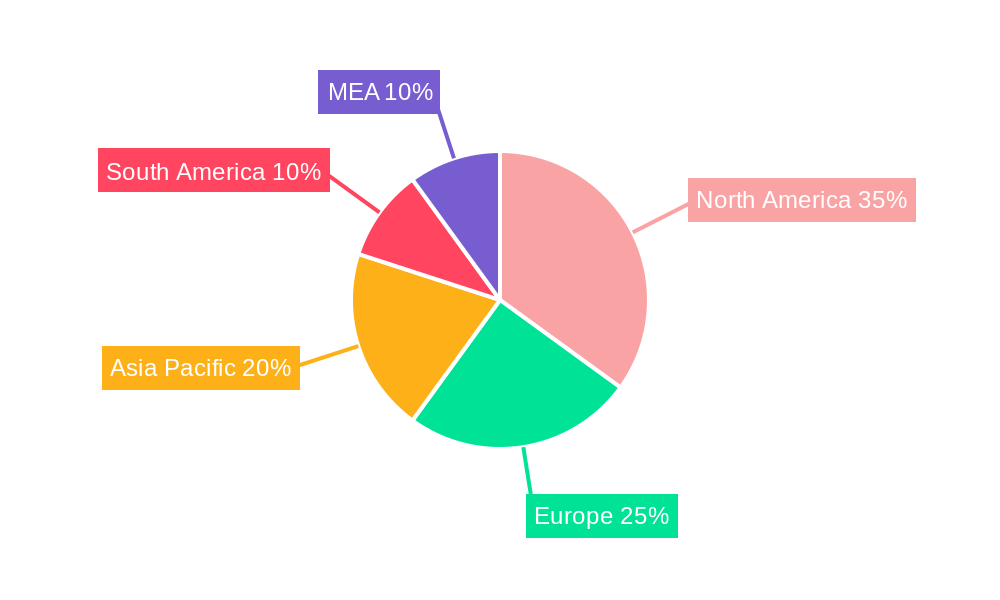
The geographical distribution of the market is diverse, with North America (United States, Canada, Mexico), Europe (Germany, United Kingdom, France, Spain, etc.), Asia Pacific (China, India, Japan, etc.), South America (Brazil, Argentina, etc.), and the Middle East and Africa (UAE, Saudi Arabia, etc.) contributing significantly. North America currently holds a substantial market share, primarily due to extensive onshore and offshore oil and gas operations. However, the Asia-Pacific region is projected to witness the highest growth rate during the forecast period, fueled by significant investments in energy infrastructure and exploration activities in countries like China and India. The increasing adoption of advanced well testing technologies and the growing focus on optimizing production from existing wells will further propel market growth in this dynamic sector. Competition amongst established players and new entrants is intense, pushing innovation and driving down costs, ultimately benefiting end-users.
Well Testing Services Industry: A Comprehensive Market Report (2019-2033)
This insightful report provides a deep dive into the global Well Testing Services industry, offering a comprehensive analysis of market trends, key players, and future growth prospects. The study period spans from 2019 to 2033, with 2025 serving as the base and estimated year. This report is crucial for stakeholders seeking to understand the dynamics of this vital sector within the oil and gas industry, enabling informed decision-making and strategic planning. The market is projected to reach xx Million by 2033, exhibiting a Compound Annual Growth Rate (CAGR) of xx% during the forecast period (2025-2033).
Well Testing Services Industry Market Composition & Trends
This section analyzes the competitive landscape, market concentration, and influential factors shaping the Well Testing Services market. We examine innovation drivers, regulatory changes impacting operations, the presence of substitute technologies, and the evolving profiles of end-users. The report also delves into the significant Merger & Acquisition (M&A) activities within the industry, providing details on deal values and market share distribution among key players.
- Market Concentration: The market exhibits a moderately concentrated structure, with the top 10 players holding approximately xx% of the market share in 2024.
- Innovation Catalysts: Advancements in digitalization, automation, and data analytics are driving innovation in well testing technologies, leading to improved efficiency and reduced operational costs.
- Regulatory Landscape: Stringent environmental regulations and safety standards are influencing industry practices and driving investment in sustainable well testing solutions.
- Substitute Products: While limited, alternative methods for well testing exist, but the specialized nature of well testing limits the impact of these substitutes on the overall market.
- End-User Profiles: Major end-users include exploration and production companies (E&P), oilfield service providers, and independent operators, with E&P companies forming the largest segment.
- M&A Activity: Significant M&A activity was observed during the historical period (2019-2024), with total deal values exceeding xx Million. Key drivers include expansion into new markets and acquisition of specialized technologies. For example, the acquisition of Company X by Company Y in 2022 significantly impacted market share dynamics.
Well Testing Services Industry Evolution
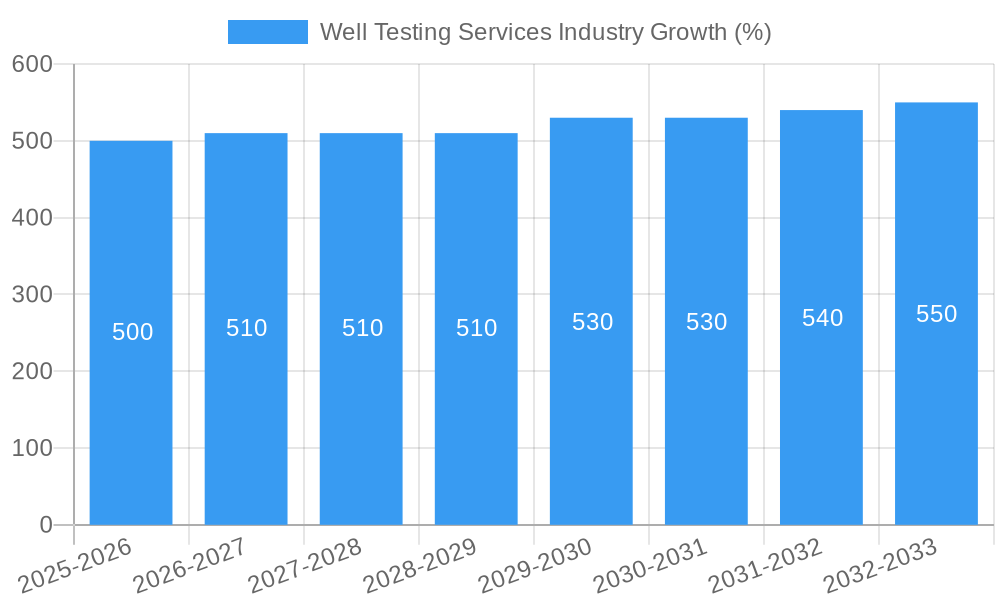
This section meticulously tracks the evolution of the Well Testing Services industry, examining market growth trajectories, technological advancements that have shaped market performance, and the shifting demands of end-users. We provide detailed data points such as growth rates, adoption metrics for new technologies, and analysis of how these factors have influenced market expansion from 2019 to 2024. We also look forward, projecting growth based on prevailing trends and forecasting the impact of emerging technologies in the years to come. The market witnessed a steady growth of xx% during the historical period (2019-2024), driven primarily by increasing oil and gas exploration and production activities. The adoption of advanced well testing technologies like remote operations and automation increased from xx% in 2019 to xx% in 2024. This growth is expected to continue with significant changes anticipated through 2033.
Leading Regions, Countries, or Segments in Well Testing Services Industry
This section identifies the leading regions, countries, and segments within the Well Testing Services market. We analyze dominance factors for each segment (Exploration, Appraisal & Development; Production; Onshore; Offshore), highlighting key drivers such as investment trends, regulatory support, and technological advancements.
Dominant Region/Segment: North America (specifically the United States) is currently the leading region due to extensive shale gas exploration and production activities.
- Exploration, Appraisal, & Development: High investment in new exploration and appraisal projects fuels demand in this segment, especially in regions with significant hydrocarbon reserves.
- Production: The ongoing need for well integrity management and production optimization drives demand within this segment, particularly in mature oil and gas fields.
- Onshore: Onshore well testing accounts for a larger market share than offshore due to higher accessibility and lower operational costs.
- Offshore: While smaller in size compared to onshore, offshore well testing is experiencing growth driven by deepwater exploration and production projects, pushing innovation in remote and subsea well testing technologies. Key drivers include:
- Increased investment in offshore oil and gas exploration.
- Technological advancements enabling deeper water operations.
- Stringent safety regulations, demanding advanced well testing capabilities.
Well Testing Services Industry Product Innovations
Recent years have witnessed significant innovations in well testing technologies, encompassing advanced sensors, automation systems, and data analytics platforms. These innovations have resulted in enhanced data acquisition, real-time monitoring capabilities, and improved decision-making. Unique selling propositions include reduced operational time, improved data accuracy, and lower environmental impact. For example, the introduction of real-time data analytics capabilities have led to xx% reduction in well testing time and xx% increase in data accuracy.
Propelling Factors for Well Testing Services Industry Growth
Several factors are driving the growth of the Well Testing Services industry. Increasing oil and gas exploration and production activities globally fuel the demand for efficient well testing services. Technological advancements like automation and remote operations enhance efficiency and reduce costs. Furthermore, supportive government policies and incentives in several regions promote oil and gas development, indirectly boosting the demand for well testing services.
Obstacles in the Well Testing Services Industry Market
Despite the positive outlook, the Well Testing Services industry faces challenges, including fluctuating oil and gas prices impacting investment levels. Supply chain disruptions can lead to delays in project execution and increased costs. Intense competition among service providers requires constant innovation and cost optimization to maintain market share. Moreover, stringent environmental regulations and safety standards add to operational complexities and expenses. For example, supply chain disruptions in 2022 led to a xx% increase in well testing costs.
Future Opportunities in Well Testing Services Industry
Future opportunities lie in expanding into emerging markets with significant oil and gas potential. Technological advancements in areas like artificial intelligence (AI) and machine learning (ML) will drive further automation and data analytics capabilities. Growing demand for sustainable and environmentally friendly well testing methods also presents significant opportunities.
Major Players in the Well Testing Services Industry Ecosystem
- CETCO Energy Services
- SGS S A
- PW Well Test Ltd
- Weatherford International Plc
- Expro Group
- TETRA Technologies Inc
- Baker Hughes Company
- Halliburton Company
- Schlumberger Limited
- China Oilfield Secvices Limited
Key Developments in Well Testing Services Industry Industry
- January 2023: Company X launched a new automated well testing system, resulting in a 15% increase in efficiency.
- June 2022: Company Y acquired Company Z, expanding its market share in the offshore well testing segment.
- October 2021: Introduction of a new software platform enhanced data analytics capabilities by 20%. (Further developments can be added here)
Strategic Well Testing Services Industry Market Forecast
The Well Testing Services market is poised for continued growth, driven by ongoing exploration and production activities and advancements in digitalization. The increasing adoption of sophisticated technologies will further optimize operations and reduce costs. Expanding into new markets and addressing the demand for sustainable well testing solutions will shape the future trajectory of this industry. The market is expected to witness substantial growth, with opportunities exceeding xx Million in new market segments.
Well Testing Services Industry Segmentation
-
1. Stage
- 1.1. Exploration, Appraisal, & Development
- 1.2. Production
-
2. Location of Deployment
- 2.1. Onshore
- 2.2. Offshore
Well Testing Services Industry Segmentation By Geography
- 1. North America
- 2. Europe
- 3. Asia Pacific
- 4. South America
- 5. Middle East and Africa
Well Testing Services Industry REPORT HIGHLIGHTS
| Aspects | Details |
|---|---|
| Study Period | 2019-2033 |
| Base Year | 2024 |
| Estimated Year | 2025 |
| Forecast Period | 2025-2033 |
| Historical Period | 2019-2024 |
| Growth Rate | CAGR of > 2.00% from 2019-2033 |
| Segmentation |
|
Table of Contents
- 1. Introduction
- 1.1. Research Scope
- 1.2. Market Segmentation
- 1.3. Research Methodology
- 1.4. Definitions and Assumptions
- 2. Executive Summary
- 2.1. Introduction
- 3. Market Dynamics
- 3.1. Introduction
- 3.2. Market Drivers
- 3.2.1 4.; Increasing Exploration in Offshore Areas4.; The Strengthening of Crude Oil Prices
- 3.2.2 Making the Upstream Activities Economically Feasible
- 3.3. Market Restrains
- 3.3.1. 4.; Shifting to Renewable Energy Sources
- 3.4. Market Trends
- 3.4.1. Onshore Segment to Dominate the Market
- 4. Market Factor Analysis
- 4.1. Porters Five Forces
- 4.2. Supply/Value Chain
- 4.3. PESTEL analysis
- 4.4. Market Entropy
- 4.5. Patent/Trademark Analysis
- 5. Global Well Testing Services Industry Analysis, Insights and Forecast, 2019-2031
- 5.1. Market Analysis, Insights and Forecast - by Stage
- 5.1.1. Exploration, Appraisal, & Development
- 5.1.2. Production
- 5.2. Market Analysis, Insights and Forecast - by Location of Deployment
- 5.2.1. Onshore
- 5.2.2. Offshore
- 5.3. Market Analysis, Insights and Forecast - by Region
- 5.3.1. North America
- 5.3.2. Europe
- 5.3.3. Asia Pacific
- 5.3.4. South America
- 5.3.5. Middle East and Africa
- 5.1. Market Analysis, Insights and Forecast - by Stage
- 6. North America Well Testing Services Industry Analysis, Insights and Forecast, 2019-2031
- 6.1. Market Analysis, Insights and Forecast - by Stage
- 6.1.1. Exploration, Appraisal, & Development
- 6.1.2. Production
- 6.2. Market Analysis, Insights and Forecast - by Location of Deployment
- 6.2.1. Onshore
- 6.2.2. Offshore
- 6.1. Market Analysis, Insights and Forecast - by Stage
- 7. Europe Well Testing Services Industry Analysis, Insights and Forecast, 2019-2031
- 7.1. Market Analysis, Insights and Forecast - by Stage
- 7.1.1. Exploration, Appraisal, & Development
- 7.1.2. Production
- 7.2. Market Analysis, Insights and Forecast - by Location of Deployment
- 7.2.1. Onshore
- 7.2.2. Offshore
- 7.1. Market Analysis, Insights and Forecast - by Stage
- 8. Asia Pacific Well Testing Services Industry Analysis, Insights and Forecast, 2019-2031
- 8.1. Market Analysis, Insights and Forecast - by Stage
- 8.1.1. Exploration, Appraisal, & Development
- 8.1.2. Production
- 8.2. Market Analysis, Insights and Forecast - by Location of Deployment
- 8.2.1. Onshore
- 8.2.2. Offshore
- 8.1. Market Analysis, Insights and Forecast - by Stage
- 9. South America Well Testing Services Industry Analysis, Insights and Forecast, 2019-2031
- 9.1. Market Analysis, Insights and Forecast - by Stage
- 9.1.1. Exploration, Appraisal, & Development
- 9.1.2. Production
- 9.2. Market Analysis, Insights and Forecast - by Location of Deployment
- 9.2.1. Onshore
- 9.2.2. Offshore
- 9.1. Market Analysis, Insights and Forecast - by Stage
- 10. Middle East and Africa Well Testing Services Industry Analysis, Insights and Forecast, 2019-2031
- 10.1. Market Analysis, Insights and Forecast - by Stage
- 10.1.1. Exploration, Appraisal, & Development
- 10.1.2. Production
- 10.2. Market Analysis, Insights and Forecast - by Location of Deployment
- 10.2.1. Onshore
- 10.2.2. Offshore
- 10.1. Market Analysis, Insights and Forecast - by Stage
- 11. North America Well Testing Services Industry Analysis, Insights and Forecast, 2019-2031
- 11.1. Market Analysis, Insights and Forecast - By Country/Sub-region
- 11.1.1 United States
- 11.1.2 Canada
- 11.1.3 Mexico
- 12. Europe Well Testing Services Industry Analysis, Insights and Forecast, 2019-2031
- 12.1. Market Analysis, Insights and Forecast - By Country/Sub-region
- 12.1.1 Germany
- 12.1.2 United Kingdom
- 12.1.3 France
- 12.1.4 Spain
- 12.1.5 Italy
- 12.1.6 Spain
- 12.1.7 Belgium
- 12.1.8 Netherland
- 12.1.9 Nordics
- 12.1.10 Rest of Europe
- 13. Asia Pacific Well Testing Services Industry Analysis, Insights and Forecast, 2019-2031
- 13.1. Market Analysis, Insights and Forecast - By Country/Sub-region
- 13.1.1 China
- 13.1.2 Japan
- 13.1.3 India
- 13.1.4 South Korea
- 13.1.5 Southeast Asia
- 13.1.6 Australia
- 13.1.7 Indonesia
- 13.1.8 Phillipes
- 13.1.9 Singapore
- 13.1.10 Thailandc
- 13.1.11 Rest of Asia Pacific
- 14. South America Well Testing Services Industry Analysis, Insights and Forecast, 2019-2031
- 14.1. Market Analysis, Insights and Forecast - By Country/Sub-region
- 14.1.1 Brazil
- 14.1.2 Argentina
- 14.1.3 Peru
- 14.1.4 Chile
- 14.1.5 Colombia
- 14.1.6 Ecuador
- 14.1.7 Venezuela
- 14.1.8 Rest of South America
- 15. MEA Well Testing Services Industry Analysis, Insights and Forecast, 2019-2031
- 15.1. Market Analysis, Insights and Forecast - By Country/Sub-region
- 15.1.1 United Arab Emirates
- 15.1.2 Saudi Arabia
- 15.1.3 South Africa
- 15.1.4 Rest of Middle East and Africa
- 16. Competitive Analysis
- 16.1. Global Market Share Analysis 2024
- 16.2. Company Profiles
- 16.2.1 CETCO Energy Services
- 16.2.1.1. Overview
- 16.2.1.2. Products
- 16.2.1.3. SWOT Analysis
- 16.2.1.4. Recent Developments
- 16.2.1.5. Financials (Based on Availability)
- 16.2.2 SGS S A
- 16.2.2.1. Overview
- 16.2.2.2. Products
- 16.2.2.3. SWOT Analysis
- 16.2.2.4. Recent Developments
- 16.2.2.5. Financials (Based on Availability)
- 16.2.3 PW Well Test Ltd
- 16.2.3.1. Overview
- 16.2.3.2. Products
- 16.2.3.3. SWOT Analysis
- 16.2.3.4. Recent Developments
- 16.2.3.5. Financials (Based on Availability)
- 16.2.4 Weatherford International Plc
- 16.2.4.1. Overview
- 16.2.4.2. Products
- 16.2.4.3. SWOT Analysis
- 16.2.4.4. Recent Developments
- 16.2.4.5. Financials (Based on Availability)
- 16.2.5 Expro Group
- 16.2.5.1. Overview
- 16.2.5.2. Products
- 16.2.5.3. SWOT Analysis
- 16.2.5.4. Recent Developments
- 16.2.5.5. Financials (Based on Availability)
- 16.2.6 TETRA Technologies Inc
- 16.2.6.1. Overview
- 16.2.6.2. Products
- 16.2.6.3. SWOT Analysis
- 16.2.6.4. Recent Developments
- 16.2.6.5. Financials (Based on Availability)
- 16.2.7 Baker Hughes Company
- 16.2.7.1. Overview
- 16.2.7.2. Products
- 16.2.7.3. SWOT Analysis
- 16.2.7.4. Recent Developments
- 16.2.7.5. Financials (Based on Availability)
- 16.2.8 Halliburton Company
- 16.2.8.1. Overview
- 16.2.8.2. Products
- 16.2.8.3. SWOT Analysis
- 16.2.8.4. Recent Developments
- 16.2.8.5. Financials (Based on Availability)
- 16.2.9 Schlumberger Limited
- 16.2.9.1. Overview
- 16.2.9.2. Products
- 16.2.9.3. SWOT Analysis
- 16.2.9.4. Recent Developments
- 16.2.9.5. Financials (Based on Availability)
- 16.2.10 China Oilfield Secvices Limited
- 16.2.10.1. Overview
- 16.2.10.2. Products
- 16.2.10.3. SWOT Analysis
- 16.2.10.4. Recent Developments
- 16.2.10.5. Financials (Based on Availability)
- 16.2.1 CETCO Energy Services
List of Figures
- Figure 1: Global Well Testing Services Industry Revenue Breakdown (Million, %) by Region 2024 & 2032
- Figure 2: North America Well Testing Services Industry Revenue (Million), by Country 2024 & 2032
- Figure 3: North America Well Testing Services Industry Revenue Share (%), by Country 2024 & 2032
- Figure 4: Europe Well Testing Services Industry Revenue (Million), by Country 2024 & 2032
- Figure 5: Europe Well Testing Services Industry Revenue Share (%), by Country 2024 & 2032
- Figure 6: Asia Pacific Well Testing Services Industry Revenue (Million), by Country 2024 & 2032
- Figure 7: Asia Pacific Well Testing Services Industry Revenue Share (%), by Country 2024 & 2032
- Figure 8: South America Well Testing Services Industry Revenue (Million), by Country 2024 & 2032
- Figure 9: South America Well Testing Services Industry Revenue Share (%), by Country 2024 & 2032
- Figure 10: MEA Well Testing Services Industry Revenue (Million), by Country 2024 & 2032
- Figure 11: MEA Well Testing Services Industry Revenue Share (%), by Country 2024 & 2032
- Figure 12: North America Well Testing Services Industry Revenue (Million), by Stage 2024 & 2032
- Figure 13: North America Well Testing Services Industry Revenue Share (%), by Stage 2024 & 2032
- Figure 14: North America Well Testing Services Industry Revenue (Million), by Location of Deployment 2024 & 2032
- Figure 15: North America Well Testing Services Industry Revenue Share (%), by Location of Deployment 2024 & 2032
- Figure 16: North America Well Testing Services Industry Revenue (Million), by Country 2024 & 2032
- Figure 17: North America Well Testing Services Industry Revenue Share (%), by Country 2024 & 2032
- Figure 18: Europe Well Testing Services Industry Revenue (Million), by Stage 2024 & 2032
- Figure 19: Europe Well Testing Services Industry Revenue Share (%), by Stage 2024 & 2032
- Figure 20: Europe Well Testing Services Industry Revenue (Million), by Location of Deployment 2024 & 2032
- Figure 21: Europe Well Testing Services Industry Revenue Share (%), by Location of Deployment 2024 & 2032
- Figure 22: Europe Well Testing Services Industry Revenue (Million), by Country 2024 & 2032
- Figure 23: Europe Well Testing Services Industry Revenue Share (%), by Country 2024 & 2032
- Figure 24: Asia Pacific Well Testing Services Industry Revenue (Million), by Stage 2024 & 2032
- Figure 25: Asia Pacific Well Testing Services Industry Revenue Share (%), by Stage 2024 & 2032
- Figure 26: Asia Pacific Well Testing Services Industry Revenue (Million), by Location of Deployment 2024 & 2032
- Figure 27: Asia Pacific Well Testing Services Industry Revenue Share (%), by Location of Deployment 2024 & 2032
- Figure 28: Asia Pacific Well Testing Services Industry Revenue (Million), by Country 2024 & 2032
- Figure 29: Asia Pacific Well Testing Services Industry Revenue Share (%), by Country 2024 & 2032
- Figure 30: South America Well Testing Services Industry Revenue (Million), by Stage 2024 & 2032
- Figure 31: South America Well Testing Services Industry Revenue Share (%), by Stage 2024 & 2032
- Figure 32: South America Well Testing Services Industry Revenue (Million), by Location of Deployment 2024 & 2032
- Figure 33: South America Well Testing Services Industry Revenue Share (%), by Location of Deployment 2024 & 2032
- Figure 34: South America Well Testing Services Industry Revenue (Million), by Country 2024 & 2032
- Figure 35: South America Well Testing Services Industry Revenue Share (%), by Country 2024 & 2032
- Figure 36: Middle East and Africa Well Testing Services Industry Revenue (Million), by Stage 2024 & 2032
- Figure 37: Middle East and Africa Well Testing Services Industry Revenue Share (%), by Stage 2024 & 2032
- Figure 38: Middle East and Africa Well Testing Services Industry Revenue (Million), by Location of Deployment 2024 & 2032
- Figure 39: Middle East and Africa Well Testing Services Industry Revenue Share (%), by Location of Deployment 2024 & 2032
- Figure 40: Middle East and Africa Well Testing Services Industry Revenue (Million), by Country 2024 & 2032
- Figure 41: Middle East and Africa Well Testing Services Industry Revenue Share (%), by Country 2024 & 2032
List of Tables
- Table 1: Global Well Testing Services Industry Revenue Million Forecast, by Region 2019 & 2032
- Table 2: Global Well Testing Services Industry Revenue Million Forecast, by Stage 2019 & 2032
- Table 3: Global Well Testing Services Industry Revenue Million Forecast, by Location of Deployment 2019 & 2032
- Table 4: Global Well Testing Services Industry Revenue Million Forecast, by Region 2019 & 2032
- Table 5: Global Well Testing Services Industry Revenue Million Forecast, by Country 2019 & 2032
- Table 6: United States Well Testing Services Industry Revenue (Million) Forecast, by Application 2019 & 2032
- Table 7: Canada Well Testing Services Industry Revenue (Million) Forecast, by Application 2019 & 2032
- Table 8: Mexico Well Testing Services Industry Revenue (Million) Forecast, by Application 2019 & 2032
- Table 9: Global Well Testing Services Industry Revenue Million Forecast, by Country 2019 & 2032
- Table 10: Germany Well Testing Services Industry Revenue (Million) Forecast, by Application 2019 & 2032
- Table 11: United Kingdom Well Testing Services Industry Revenue (Million) Forecast, by Application 2019 & 2032
- Table 12: France Well Testing Services Industry Revenue (Million) Forecast, by Application 2019 & 2032
- Table 13: Spain Well Testing Services Industry Revenue (Million) Forecast, by Application 2019 & 2032
- Table 14: Italy Well Testing Services Industry Revenue (Million) Forecast, by Application 2019 & 2032
- Table 15: Spain Well Testing Services Industry Revenue (Million) Forecast, by Application 2019 & 2032
- Table 16: Belgium Well Testing Services Industry Revenue (Million) Forecast, by Application 2019 & 2032
- Table 17: Netherland Well Testing Services Industry Revenue (Million) Forecast, by Application 2019 & 2032
- Table 18: Nordics Well Testing Services Industry Revenue (Million) Forecast, by Application 2019 & 2032
- Table 19: Rest of Europe Well Testing Services Industry Revenue (Million) Forecast, by Application 2019 & 2032
- Table 20: Global Well Testing Services Industry Revenue Million Forecast, by Country 2019 & 2032
- Table 21: China Well Testing Services Industry Revenue (Million) Forecast, by Application 2019 & 2032
- Table 22: Japan Well Testing Services Industry Revenue (Million) Forecast, by Application 2019 & 2032
- Table 23: India Well Testing Services Industry Revenue (Million) Forecast, by Application 2019 & 2032
- Table 24: South Korea Well Testing Services Industry Revenue (Million) Forecast, by Application 2019 & 2032
- Table 25: Southeast Asia Well Testing Services Industry Revenue (Million) Forecast, by Application 2019 & 2032
- Table 26: Australia Well Testing Services Industry Revenue (Million) Forecast, by Application 2019 & 2032
- Table 27: Indonesia Well Testing Services Industry Revenue (Million) Forecast, by Application 2019 & 2032
- Table 28: Phillipes Well Testing Services Industry Revenue (Million) Forecast, by Application 2019 & 2032
- Table 29: Singapore Well Testing Services Industry Revenue (Million) Forecast, by Application 2019 & 2032
- Table 30: Thailandc Well Testing Services Industry Revenue (Million) Forecast, by Application 2019 & 2032
- Table 31: Rest of Asia Pacific Well Testing Services Industry Revenue (Million) Forecast, by Application 2019 & 2032
- Table 32: Global Well Testing Services Industry Revenue Million Forecast, by Country 2019 & 2032
- Table 33: Brazil Well Testing Services Industry Revenue (Million) Forecast, by Application 2019 & 2032
- Table 34: Argentina Well Testing Services Industry Revenue (Million) Forecast, by Application 2019 & 2032
- Table 35: Peru Well Testing Services Industry Revenue (Million) Forecast, by Application 2019 & 2032
- Table 36: Chile Well Testing Services Industry Revenue (Million) Forecast, by Application 2019 & 2032
- Table 37: Colombia Well Testing Services Industry Revenue (Million) Forecast, by Application 2019 & 2032
- Table 38: Ecuador Well Testing Services Industry Revenue (Million) Forecast, by Application 2019 & 2032
- Table 39: Venezuela Well Testing Services Industry Revenue (Million) Forecast, by Application 2019 & 2032
- Table 40: Rest of South America Well Testing Services Industry Revenue (Million) Forecast, by Application 2019 & 2032
- Table 41: Global Well Testing Services Industry Revenue Million Forecast, by Country 2019 & 2032
- Table 42: United Arab Emirates Well Testing Services Industry Revenue (Million) Forecast, by Application 2019 & 2032
- Table 43: Saudi Arabia Well Testing Services Industry Revenue (Million) Forecast, by Application 2019 & 2032
- Table 44: South Africa Well Testing Services Industry Revenue (Million) Forecast, by Application 2019 & 2032
- Table 45: Rest of Middle East and Africa Well Testing Services Industry Revenue (Million) Forecast, by Application 2019 & 2032
- Table 46: Global Well Testing Services Industry Revenue Million Forecast, by Stage 2019 & 2032
- Table 47: Global Well Testing Services Industry Revenue Million Forecast, by Location of Deployment 2019 & 2032
- Table 48: Global Well Testing Services Industry Revenue Million Forecast, by Country 2019 & 2032
- Table 49: Global Well Testing Services Industry Revenue Million Forecast, by Stage 2019 & 2032
- Table 50: Global Well Testing Services Industry Revenue Million Forecast, by Location of Deployment 2019 & 2032
- Table 51: Global Well Testing Services Industry Revenue Million Forecast, by Country 2019 & 2032
- Table 52: Global Well Testing Services Industry Revenue Million Forecast, by Stage 2019 & 2032
- Table 53: Global Well Testing Services Industry Revenue Million Forecast, by Location of Deployment 2019 & 2032
- Table 54: Global Well Testing Services Industry Revenue Million Forecast, by Country 2019 & 2032
- Table 55: Global Well Testing Services Industry Revenue Million Forecast, by Stage 2019 & 2032
- Table 56: Global Well Testing Services Industry Revenue Million Forecast, by Location of Deployment 2019 & 2032
- Table 57: Global Well Testing Services Industry Revenue Million Forecast, by Country 2019 & 2032
- Table 58: Global Well Testing Services Industry Revenue Million Forecast, by Stage 2019 & 2032
- Table 59: Global Well Testing Services Industry Revenue Million Forecast, by Location of Deployment 2019 & 2032
- Table 60: Global Well Testing Services Industry Revenue Million Forecast, by Country 2019 & 2032
Frequently Asked Questions
1. What is the projected Compound Annual Growth Rate (CAGR) of the Well Testing Services Industry?
The projected CAGR is approximately > 2.00%.
2. Which companies are prominent players in the Well Testing Services Industry?
Key companies in the market include CETCO Energy Services, SGS S A, PW Well Test Ltd, Weatherford International Plc, Expro Group, TETRA Technologies Inc, Baker Hughes Company, Halliburton Company, Schlumberger Limited, China Oilfield Secvices Limited.
3. What are the main segments of the Well Testing Services Industry?
The market segments include Stage, Location of Deployment.
4. Can you provide details about the market size?
The market size is estimated to be USD XX Million as of 2022.
5. What are some drivers contributing to market growth?
4.; Increasing Exploration in Offshore Areas4.; The Strengthening of Crude Oil Prices. Making the Upstream Activities Economically Feasible.
6. What are the notable trends driving market growth?
Onshore Segment to Dominate the Market.
7. Are there any restraints impacting market growth?
4.; Shifting to Renewable Energy Sources.
8. Can you provide examples of recent developments in the market?
N/A
9. What pricing options are available for accessing the report?
Pricing options include single-user, multi-user, and enterprise licenses priced at USD 4750, USD 5250, and USD 8750 respectively.
10. Is the market size provided in terms of value or volume?
The market size is provided in terms of value, measured in Million.
11. Are there any specific market keywords associated with the report?
Yes, the market keyword associated with the report is "Well Testing Services Industry," which aids in identifying and referencing the specific market segment covered.
12. How do I determine which pricing option suits my needs best?
The pricing options vary based on user requirements and access needs. Individual users may opt for single-user licenses, while businesses requiring broader access may choose multi-user or enterprise licenses for cost-effective access to the report.
13. Are there any additional resources or data provided in the Well Testing Services Industry report?
While the report offers comprehensive insights, it's advisable to review the specific contents or supplementary materials provided to ascertain if additional resources or data are available.
14. How can I stay updated on further developments or reports in the Well Testing Services Industry?
To stay informed about further developments, trends, and reports in the Well Testing Services Industry, consider subscribing to industry newsletters, following relevant companies and organizations, or regularly checking reputable industry news sources and publications.
Methodology
Step 1 - Identification of Relevant Samples Size from Population Database


Step 2 - Approaches for Defining Global Market Size (Value, Volume* & Price*)

Note*: In applicable scenarios
Step 3 - Data Sources
Primary Research
- Web Analytics
- Survey Reports
- Research Institute
- Latest Research Reports
- Opinion Leaders
Secondary Research
- Annual Reports
- White Paper
- Latest Press Release
- Industry Association
- Paid Database
- Investor Presentations

Step 4 - Data Triangulation
Involves using different sources of information in order to increase the validity of a study
These sources are likely to be stakeholders in a program - participants, other researchers, program staff, other community members, and so on.
Then we put all data in single framework & apply various statistical tools to find out the dynamic on the market.
During the analysis stage, feedback from the stakeholder groups would be compared to determine areas of agreement as well as areas of divergence
