

Key Insights
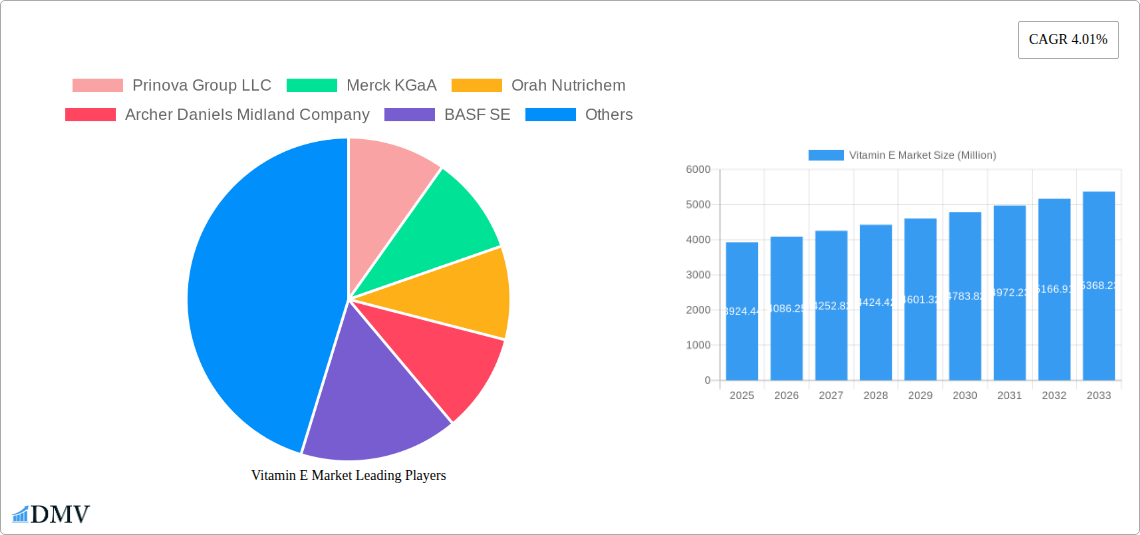
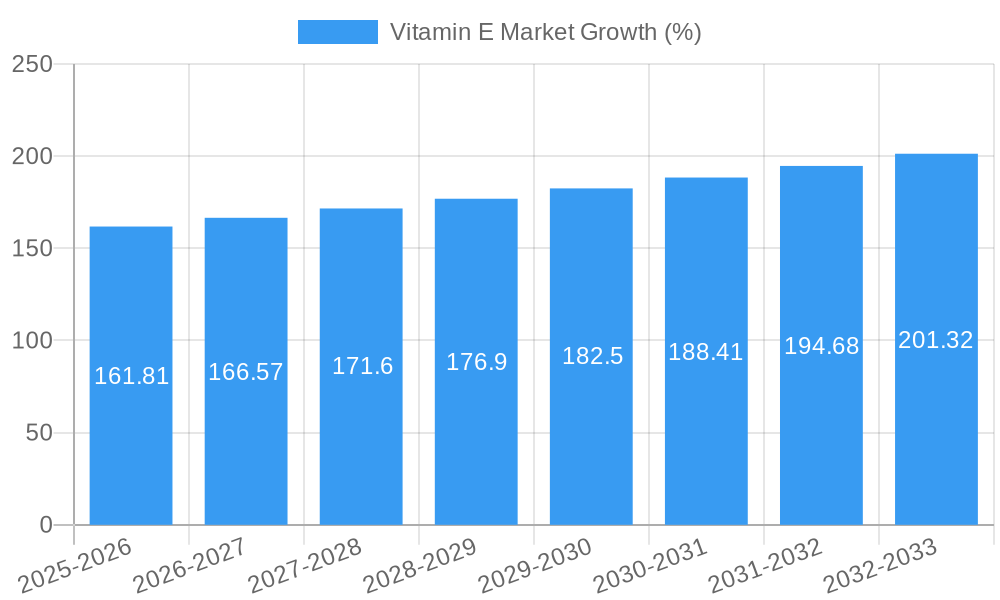
The global Vitamin E market, valued at $3924.44 million in 2025, is projected to experience steady growth, driven by increasing consumer awareness of its health benefits and expanding applications across diverse sectors. The Compound Annual Growth Rate (CAGR) of 4.01% from 2025 to 2033 indicates a consistent market expansion, fueled primarily by the rising demand for functional foods and beverages fortified with Vitamin E. The natural Vitamin E segment is expected to maintain a significant market share due to growing consumer preference for natural ingredients and a perception of greater efficacy and safety. The pharmaceutical and dietary supplement sector remains a key application area, with Vitamin E playing a crucial role in supporting cardiovascular health and immune function. Furthermore, the increasing incorporation of Vitamin E into infant nutrition products and pet food reflects the growing recognition of its importance in overall well-being across different life stages. Geographical expansion, particularly in developing economies with rising disposable incomes and health consciousness, will also contribute to market growth. However, price fluctuations in raw materials and the emergence of competitive alternatives may pose challenges to market expansion. Competitive intensity is expected to remain high, with both large multinational companies and specialized players vying for market share through product innovation and strategic partnerships.
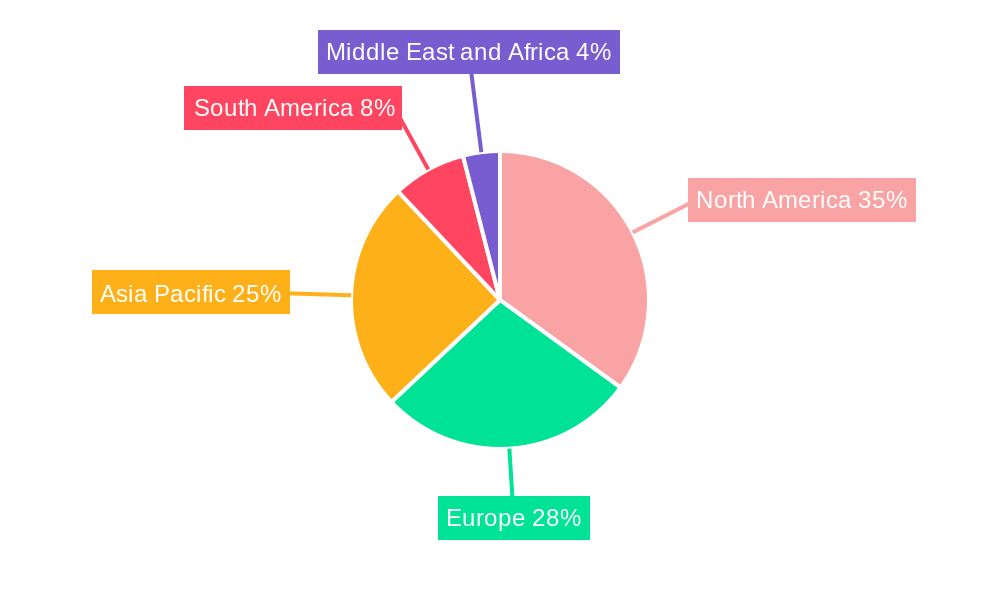
The market segmentation highlights significant opportunities. The functional food and beverage segment is poised for considerable growth, driven by the increasing demand for healthier and fortified food and beverage options. The pharmaceutical and dietary supplement segment remains a strong driver, underpinned by the widespread use of Vitamin E in various formulations to address specific health concerns. The infant nutrition and pet food sectors are emerging as promising segments, reflecting the expanding awareness of Vitamin E's benefits for young children and animals. North America and Europe currently hold substantial market share, but Asia-Pacific is anticipated to witness robust growth, driven by factors like increasing disposable incomes, changing lifestyles, and rising health awareness. This presents significant opportunities for companies focusing on expansion in these regions. The market's future growth trajectory will depend on successfully navigating challenges related to supply chain stability, regulatory changes, and consumer preferences.
Vitamin E Market Report: 2019-2033
This comprehensive report provides an in-depth analysis of the global Vitamin E market, offering valuable insights for stakeholders across the value chain. From market size and segmentation to key players and future trends, this report is your go-to resource for understanding this dynamic industry. The study period covers 2019-2033, with 2025 as the base and estimated year, and a forecast period spanning 2025-2033. The historical period analyzed is 2019-2024. The global Vitamin E market is projected to reach xx Million by 2033.
Vitamin E Market Composition & Trends
The Vitamin E market exhibits a moderately consolidated structure, with key players such as Prinova Group LLC, Merck KGaA, and BASF SE holding significant market share. Innovation in delivery systems (e.g., liposomal Vitamin E) and sustainable sourcing are key catalysts. Stringent regulatory frameworks concerning purity and labeling influence market dynamics. Substitute products, such as other antioxidants, present competitive pressure. End-users span diverse sectors, including functional foods & beverages, pharmaceuticals, cosmetics, and animal feed. Mergers and acquisitions (M&A) activity has been moderate, with deal values averaging xx Million in recent years.
- Market Concentration: Moderately Consolidated
- Top 3 Players Market Share: xx%
- Average M&A Deal Value (2019-2024): xx Million
- Key Innovation Drivers: Sustainable sourcing, novel delivery systems
- Regulatory Landscape: Stringent purity and labeling standards
Vitamin E Market Industry Evolution
The Vitamin E market has witnessed robust growth over the past five years, driven by increasing health consciousness and rising demand for natural and functional ingredients. Technological advancements, such as improved extraction and encapsulation techniques, have enhanced product quality and efficacy. Consumer preferences are shifting towards natural and organic Vitamin E, impacting the product mix. The market has seen a Compound Annual Growth Rate (CAGR) of xx% during 2019-2024, with the natural Vitamin E segment exhibiting faster growth compared to synthetic Vitamin E. Adoption of sustainable sourcing practices is gaining traction, influenced by increasing consumer awareness of environmental concerns.
Leading Regions, Countries, or Segments in Vitamin E Market
The North American region currently dominates the Vitamin E market, driven by high consumer demand for dietary supplements and functional foods. Within this region, the United States holds the largest market share. The European market is also significant, with strong growth in the functional foods and beverages segment.
- Dominant Region: North America (United States)
- Key Drivers (North America): High consumer spending on health & wellness, strong regulatory framework supporting supplements.
- Key Drivers (Europe): Increasing adoption of functional foods and beverages, focus on natural and organic products.
- Fastest Growing Segment: Functional food & beverages.
- Factors driving dominance in North America: High per capita income, robust dietary supplement market, strong distribution networks.
Vitamin E Market Product Innovations
Recent innovations include the development of liposomal Vitamin E, offering enhanced bioavailability and improved stability. New applications are emerging in cosmetics, particularly in anti-aging and skincare formulations. The focus is on delivering superior performance, such as increased absorption and extended shelf-life.
Propelling Factors for Vitamin E Market Growth
Technological advancements in extraction and encapsulation techniques, alongside rising health consciousness and increased demand for natural ingredients, fuel market expansion. Favorable regulatory environments in key markets and growth in the functional food and beverage industry further contribute to market growth.
Obstacles in the Vitamin E Market
Fluctuations in raw material prices and supply chain disruptions pose challenges. Stringent regulations regarding purity and labeling increase manufacturing costs and hinder market entry for some players. Intense competition among established players and the emergence of new entrants can impact profitability.
Future Opportunities in Vitamin E Market
Expanding applications in novel product categories like pet food and infant nutrition present significant opportunities. Developing innovative delivery systems and exploring new geographical markets can create additional avenues for growth. Leveraging sustainable sourcing practices and promoting the health benefits of Vitamin E can create further market expansion.
Major Players in the Vitamin E Market Ecosystem
- Prinova Group LLC
- Merck KGaA
- Orah Nutrichem
- Archer Daniels Midland Company
- BASF SE
- Aryan International
- Koninklijke DSM NV
- The Bountiful Company
- Jilin Beisha Pharmaceutical Co Ltd
- BTSA Biotecnologías Aplicadas SL
Key Developments in Vitamin E Market Industry
- June 2021: Prinova launched an e-commerce website for B2B vitamin distribution.
- June 2021: One Rock Capital acquired BASF's specialty chemical facility, including natural Vitamin E production.
- December 2021: Kensing partnered with Azelis for European and Middle Eastern/African distribution of Vitamin E products.
Strategic Vitamin E Market Forecast
The Vitamin E market is poised for continued growth, driven by increasing health awareness and innovation in product development. Emerging applications in new market segments and technological advancements will further contribute to market expansion, creating opportunities for established and new players alike.
Vitamin E Market Segmentation
-
1. Product Type
- 1.1. Natural
- 1.2. Synthetic
-
2. Application
- 2.1. Functional Food and Beverages
- 2.2. Pharmaceuticals and Dietary Supplements
- 2.3. Infant Nutrition
- 2.4. Pet Food and Animal Feed
- 2.5. Cosmetics
Vitamin E Market Segmentation By Geography
-
1. North America
- 1.1. United States
- 1.2. Canada
- 1.3. Mexico
- 1.4. Rest of North America
-
2. Europe
- 2.1. Germany
- 2.2. United Kingdom
- 2.3. France
- 2.4. Russia
- 2.5. Spain
- 2.6. Italy
- 2.7. Rest of Europe
-
3. Asia Pacific
- 3.1. India
- 3.2. China
- 3.3. Japan
- 3.4. Australia
- 3.5. Rest of Asia Pacific
-
4. South America
- 4.1. Brazil
- 4.2. Argentina
- 4.3. Rest of South America
-
5. Middle East and Africa
- 5.1. South Africa
- 5.2. Saudi Arabia
- 5.3. Rest of Middle East and Africa
Vitamin E Market REPORT HIGHLIGHTS
| Aspects | Details |
|---|---|
| Study Period | 2019-2033 |
| Base Year | 2024 |
| Estimated Year | 2025 |
| Forecast Period | 2025-2033 |
| Historical Period | 2019-2024 |
| Growth Rate | CAGR of 4.01% from 2019-2033 |
| Segmentation |
|
Table of Contents
- 1. Introduction
- 1.1. Research Scope
- 1.2. Market Segmentation
- 1.3. Research Methodology
- 1.4. Definitions and Assumptions
- 2. Executive Summary
- 2.1. Introduction
- 3. Market Dynamics
- 3.1. Introduction
- 3.2. Market Drivers
- 3.2.1. Awareness of Health Benefits Associated with Tocotrienol; Escalating Demand for Anti-Aging Products Containing Tocotrienol
- 3.3. Market Restrains
- 3.3.1. Availability of Substitutes
- 3.4. Market Trends
- 3.4.1. Increasing Demand for Vitamin E in Various Applications
- 4. Market Factor Analysis
- 4.1. Porters Five Forces
- 4.2. Supply/Value Chain
- 4.3. PESTEL analysis
- 4.4. Market Entropy
- 4.5. Patent/Trademark Analysis
- 5. Global Vitamin E Market Analysis, Insights and Forecast, 2019-2031
- 5.1. Market Analysis, Insights and Forecast - by Product Type
- 5.1.1. Natural
- 5.1.2. Synthetic
- 5.2. Market Analysis, Insights and Forecast - by Application
- 5.2.1. Functional Food and Beverages
- 5.2.2. Pharmaceuticals and Dietary Supplements
- 5.2.3. Infant Nutrition
- 5.2.4. Pet Food and Animal Feed
- 5.2.5. Cosmetics
- 5.3. Market Analysis, Insights and Forecast - by Region
- 5.3.1. North America
- 5.3.2. Europe
- 5.3.3. Asia Pacific
- 5.3.4. South America
- 5.3.5. Middle East and Africa
- 5.1. Market Analysis, Insights and Forecast - by Product Type
- 6. North America Vitamin E Market Analysis, Insights and Forecast, 2019-2031
- 6.1. Market Analysis, Insights and Forecast - by Product Type
- 6.1.1. Natural
- 6.1.2. Synthetic
- 6.2. Market Analysis, Insights and Forecast - by Application
- 6.2.1. Functional Food and Beverages
- 6.2.2. Pharmaceuticals and Dietary Supplements
- 6.2.3. Infant Nutrition
- 6.2.4. Pet Food and Animal Feed
- 6.2.5. Cosmetics
- 6.1. Market Analysis, Insights and Forecast - by Product Type
- 7. Europe Vitamin E Market Analysis, Insights and Forecast, 2019-2031
- 7.1. Market Analysis, Insights and Forecast - by Product Type
- 7.1.1. Natural
- 7.1.2. Synthetic
- 7.2. Market Analysis, Insights and Forecast - by Application
- 7.2.1. Functional Food and Beverages
- 7.2.2. Pharmaceuticals and Dietary Supplements
- 7.2.3. Infant Nutrition
- 7.2.4. Pet Food and Animal Feed
- 7.2.5. Cosmetics
- 7.1. Market Analysis, Insights and Forecast - by Product Type
- 8. Asia Pacific Vitamin E Market Analysis, Insights and Forecast, 2019-2031
- 8.1. Market Analysis, Insights and Forecast - by Product Type
- 8.1.1. Natural
- 8.1.2. Synthetic
- 8.2. Market Analysis, Insights and Forecast - by Application
- 8.2.1. Functional Food and Beverages
- 8.2.2. Pharmaceuticals and Dietary Supplements
- 8.2.3. Infant Nutrition
- 8.2.4. Pet Food and Animal Feed
- 8.2.5. Cosmetics
- 8.1. Market Analysis, Insights and Forecast - by Product Type
- 9. South America Vitamin E Market Analysis, Insights and Forecast, 2019-2031
- 9.1. Market Analysis, Insights and Forecast - by Product Type
- 9.1.1. Natural
- 9.1.2. Synthetic
- 9.2. Market Analysis, Insights and Forecast - by Application
- 9.2.1. Functional Food and Beverages
- 9.2.2. Pharmaceuticals and Dietary Supplements
- 9.2.3. Infant Nutrition
- 9.2.4. Pet Food and Animal Feed
- 9.2.5. Cosmetics
- 9.1. Market Analysis, Insights and Forecast - by Product Type
- 10. Middle East and Africa Vitamin E Market Analysis, Insights and Forecast, 2019-2031
- 10.1. Market Analysis, Insights and Forecast - by Product Type
- 10.1.1. Natural
- 10.1.2. Synthetic
- 10.2. Market Analysis, Insights and Forecast - by Application
- 10.2.1. Functional Food and Beverages
- 10.2.2. Pharmaceuticals and Dietary Supplements
- 10.2.3. Infant Nutrition
- 10.2.4. Pet Food and Animal Feed
- 10.2.5. Cosmetics
- 10.1. Market Analysis, Insights and Forecast - by Product Type
- 11. North America Vitamin E Market Analysis, Insights and Forecast, 2019-2031
- 11.1. Market Analysis, Insights and Forecast - By Country/Sub-region
- 11.1.1 United States
- 11.1.2 Canada
- 11.1.3 Mexico
- 11.1.4 Rest of North America
- 12. Europe Vitamin E Market Analysis, Insights and Forecast, 2019-2031
- 12.1. Market Analysis, Insights and Forecast - By Country/Sub-region
- 12.1.1 Germany
- 12.1.2 United Kingdom
- 12.1.3 France
- 12.1.4 Russia
- 12.1.5 Spain
- 12.1.6 Italy
- 12.1.7 Rest of Europe
- 13. Asia Pacific Vitamin E Market Analysis, Insights and Forecast, 2019-2031
- 13.1. Market Analysis, Insights and Forecast - By Country/Sub-region
- 13.1.1 India
- 13.1.2 China
- 13.1.3 Japan
- 13.1.4 Australia
- 13.1.5 Rest of Asia Pacific
- 14. South America Vitamin E Market Analysis, Insights and Forecast, 2019-2031
- 14.1. Market Analysis, Insights and Forecast - By Country/Sub-region
- 14.1.1 Brazil
- 14.1.2 Argentina
- 14.1.3 Rest of South America
- 15. Middle East and Africa Vitamin E Market Analysis, Insights and Forecast, 2019-2031
- 15.1. Market Analysis, Insights and Forecast - By Country/Sub-region
- 15.1.1 South Africa
- 15.1.2 Saudi Arabia
- 15.1.3 Rest of Middle East and Africa
- 16. Competitive Analysis
- 16.1. Global Market Share Analysis 2024
- 16.2. Company Profiles
- 16.2.1 Prinova Group LLC
- 16.2.1.1. Overview
- 16.2.1.2. Products
- 16.2.1.3. SWOT Analysis
- 16.2.1.4. Recent Developments
- 16.2.1.5. Financials (Based on Availability)
- 16.2.2 Merck KGaA
- 16.2.2.1. Overview
- 16.2.2.2. Products
- 16.2.2.3. SWOT Analysis
- 16.2.2.4. Recent Developments
- 16.2.2.5. Financials (Based on Availability)
- 16.2.3 Orah Nutrichem
- 16.2.3.1. Overview
- 16.2.3.2. Products
- 16.2.3.3. SWOT Analysis
- 16.2.3.4. Recent Developments
- 16.2.3.5. Financials (Based on Availability)
- 16.2.4 Archer Daniels Midland Company
- 16.2.4.1. Overview
- 16.2.4.2. Products
- 16.2.4.3. SWOT Analysis
- 16.2.4.4. Recent Developments
- 16.2.4.5. Financials (Based on Availability)
- 16.2.5 BASF SE
- 16.2.5.1. Overview
- 16.2.5.2. Products
- 16.2.5.3. SWOT Analysis
- 16.2.5.4. Recent Developments
- 16.2.5.5. Financials (Based on Availability)
- 16.2.6 Aryan International
- 16.2.6.1. Overview
- 16.2.6.2. Products
- 16.2.6.3. SWOT Analysis
- 16.2.6.4. Recent Developments
- 16.2.6.5. Financials (Based on Availability)
- 16.2.7 Koninklijke DSM NV
- 16.2.7.1. Overview
- 16.2.7.2. Products
- 16.2.7.3. SWOT Analysis
- 16.2.7.4. Recent Developments
- 16.2.7.5. Financials (Based on Availability)
- 16.2.8 The Bountiful Company*List Not Exhaustive
- 16.2.8.1. Overview
- 16.2.8.2. Products
- 16.2.8.3. SWOT Analysis
- 16.2.8.4. Recent Developments
- 16.2.8.5. Financials (Based on Availability)
- 16.2.9 Jilin Beisha Pharmaceutical Co Ltd
- 16.2.9.1. Overview
- 16.2.9.2. Products
- 16.2.9.3. SWOT Analysis
- 16.2.9.4. Recent Developments
- 16.2.9.5. Financials (Based on Availability)
- 16.2.10 BTSA Biotecnologías Aplicadas SL
- 16.2.10.1. Overview
- 16.2.10.2. Products
- 16.2.10.3. SWOT Analysis
- 16.2.10.4. Recent Developments
- 16.2.10.5. Financials (Based on Availability)
- 16.2.1 Prinova Group LLC
List of Figures
- Figure 1: Global Vitamin E Market Revenue Breakdown (Million, %) by Region 2024 & 2032
- Figure 2: Global Vitamin E Market Volume Breakdown (K Tons, %) by Region 2024 & 2032
- Figure 3: North America Vitamin E Market Revenue (Million), by Country 2024 & 2032
- Figure 4: North America Vitamin E Market Volume (K Tons), by Country 2024 & 2032
- Figure 5: North America Vitamin E Market Revenue Share (%), by Country 2024 & 2032
- Figure 6: North America Vitamin E Market Volume Share (%), by Country 2024 & 2032
- Figure 7: Europe Vitamin E Market Revenue (Million), by Country 2024 & 2032
- Figure 8: Europe Vitamin E Market Volume (K Tons), by Country 2024 & 2032
- Figure 9: Europe Vitamin E Market Revenue Share (%), by Country 2024 & 2032
- Figure 10: Europe Vitamin E Market Volume Share (%), by Country 2024 & 2032
- Figure 11: Asia Pacific Vitamin E Market Revenue (Million), by Country 2024 & 2032
- Figure 12: Asia Pacific Vitamin E Market Volume (K Tons), by Country 2024 & 2032
- Figure 13: Asia Pacific Vitamin E Market Revenue Share (%), by Country 2024 & 2032
- Figure 14: Asia Pacific Vitamin E Market Volume Share (%), by Country 2024 & 2032
- Figure 15: South America Vitamin E Market Revenue (Million), by Country 2024 & 2032
- Figure 16: South America Vitamin E Market Volume (K Tons), by Country 2024 & 2032
- Figure 17: South America Vitamin E Market Revenue Share (%), by Country 2024 & 2032
- Figure 18: South America Vitamin E Market Volume Share (%), by Country 2024 & 2032
- Figure 19: Middle East and Africa Vitamin E Market Revenue (Million), by Country 2024 & 2032
- Figure 20: Middle East and Africa Vitamin E Market Volume (K Tons), by Country 2024 & 2032
- Figure 21: Middle East and Africa Vitamin E Market Revenue Share (%), by Country 2024 & 2032
- Figure 22: Middle East and Africa Vitamin E Market Volume Share (%), by Country 2024 & 2032
- Figure 23: North America Vitamin E Market Revenue (Million), by Product Type 2024 & 2032
- Figure 24: North America Vitamin E Market Volume (K Tons), by Product Type 2024 & 2032
- Figure 25: North America Vitamin E Market Revenue Share (%), by Product Type 2024 & 2032
- Figure 26: North America Vitamin E Market Volume Share (%), by Product Type 2024 & 2032
- Figure 27: North America Vitamin E Market Revenue (Million), by Application 2024 & 2032
- Figure 28: North America Vitamin E Market Volume (K Tons), by Application 2024 & 2032
- Figure 29: North America Vitamin E Market Revenue Share (%), by Application 2024 & 2032
- Figure 30: North America Vitamin E Market Volume Share (%), by Application 2024 & 2032
- Figure 31: North America Vitamin E Market Revenue (Million), by Country 2024 & 2032
- Figure 32: North America Vitamin E Market Volume (K Tons), by Country 2024 & 2032
- Figure 33: North America Vitamin E Market Revenue Share (%), by Country 2024 & 2032
- Figure 34: North America Vitamin E Market Volume Share (%), by Country 2024 & 2032
- Figure 35: Europe Vitamin E Market Revenue (Million), by Product Type 2024 & 2032
- Figure 36: Europe Vitamin E Market Volume (K Tons), by Product Type 2024 & 2032
- Figure 37: Europe Vitamin E Market Revenue Share (%), by Product Type 2024 & 2032
- Figure 38: Europe Vitamin E Market Volume Share (%), by Product Type 2024 & 2032
- Figure 39: Europe Vitamin E Market Revenue (Million), by Application 2024 & 2032
- Figure 40: Europe Vitamin E Market Volume (K Tons), by Application 2024 & 2032
- Figure 41: Europe Vitamin E Market Revenue Share (%), by Application 2024 & 2032
- Figure 42: Europe Vitamin E Market Volume Share (%), by Application 2024 & 2032
- Figure 43: Europe Vitamin E Market Revenue (Million), by Country 2024 & 2032
- Figure 44: Europe Vitamin E Market Volume (K Tons), by Country 2024 & 2032
- Figure 45: Europe Vitamin E Market Revenue Share (%), by Country 2024 & 2032
- Figure 46: Europe Vitamin E Market Volume Share (%), by Country 2024 & 2032
- Figure 47: Asia Pacific Vitamin E Market Revenue (Million), by Product Type 2024 & 2032
- Figure 48: Asia Pacific Vitamin E Market Volume (K Tons), by Product Type 2024 & 2032
- Figure 49: Asia Pacific Vitamin E Market Revenue Share (%), by Product Type 2024 & 2032
- Figure 50: Asia Pacific Vitamin E Market Volume Share (%), by Product Type 2024 & 2032
- Figure 51: Asia Pacific Vitamin E Market Revenue (Million), by Application 2024 & 2032
- Figure 52: Asia Pacific Vitamin E Market Volume (K Tons), by Application 2024 & 2032
- Figure 53: Asia Pacific Vitamin E Market Revenue Share (%), by Application 2024 & 2032
- Figure 54: Asia Pacific Vitamin E Market Volume Share (%), by Application 2024 & 2032
- Figure 55: Asia Pacific Vitamin E Market Revenue (Million), by Country 2024 & 2032
- Figure 56: Asia Pacific Vitamin E Market Volume (K Tons), by Country 2024 & 2032
- Figure 57: Asia Pacific Vitamin E Market Revenue Share (%), by Country 2024 & 2032
- Figure 58: Asia Pacific Vitamin E Market Volume Share (%), by Country 2024 & 2032
- Figure 59: South America Vitamin E Market Revenue (Million), by Product Type 2024 & 2032
- Figure 60: South America Vitamin E Market Volume (K Tons), by Product Type 2024 & 2032
- Figure 61: South America Vitamin E Market Revenue Share (%), by Product Type 2024 & 2032
- Figure 62: South America Vitamin E Market Volume Share (%), by Product Type 2024 & 2032
- Figure 63: South America Vitamin E Market Revenue (Million), by Application 2024 & 2032
- Figure 64: South America Vitamin E Market Volume (K Tons), by Application 2024 & 2032
- Figure 65: South America Vitamin E Market Revenue Share (%), by Application 2024 & 2032
- Figure 66: South America Vitamin E Market Volume Share (%), by Application 2024 & 2032
- Figure 67: South America Vitamin E Market Revenue (Million), by Country 2024 & 2032
- Figure 68: South America Vitamin E Market Volume (K Tons), by Country 2024 & 2032
- Figure 69: South America Vitamin E Market Revenue Share (%), by Country 2024 & 2032
- Figure 70: South America Vitamin E Market Volume Share (%), by Country 2024 & 2032
- Figure 71: Middle East and Africa Vitamin E Market Revenue (Million), by Product Type 2024 & 2032
- Figure 72: Middle East and Africa Vitamin E Market Volume (K Tons), by Product Type 2024 & 2032
- Figure 73: Middle East and Africa Vitamin E Market Revenue Share (%), by Product Type 2024 & 2032
- Figure 74: Middle East and Africa Vitamin E Market Volume Share (%), by Product Type 2024 & 2032
- Figure 75: Middle East and Africa Vitamin E Market Revenue (Million), by Application 2024 & 2032
- Figure 76: Middle East and Africa Vitamin E Market Volume (K Tons), by Application 2024 & 2032
- Figure 77: Middle East and Africa Vitamin E Market Revenue Share (%), by Application 2024 & 2032
- Figure 78: Middle East and Africa Vitamin E Market Volume Share (%), by Application 2024 & 2032
- Figure 79: Middle East and Africa Vitamin E Market Revenue (Million), by Country 2024 & 2032
- Figure 80: Middle East and Africa Vitamin E Market Volume (K Tons), by Country 2024 & 2032
- Figure 81: Middle East and Africa Vitamin E Market Revenue Share (%), by Country 2024 & 2032
- Figure 82: Middle East and Africa Vitamin E Market Volume Share (%), by Country 2024 & 2032
List of Tables
- Table 1: Global Vitamin E Market Revenue Million Forecast, by Region 2019 & 2032
- Table 2: Global Vitamin E Market Volume K Tons Forecast, by Region 2019 & 2032
- Table 3: Global Vitamin E Market Revenue Million Forecast, by Product Type 2019 & 2032
- Table 4: Global Vitamin E Market Volume K Tons Forecast, by Product Type 2019 & 2032
- Table 5: Global Vitamin E Market Revenue Million Forecast, by Application 2019 & 2032
- Table 6: Global Vitamin E Market Volume K Tons Forecast, by Application 2019 & 2032
- Table 7: Global Vitamin E Market Revenue Million Forecast, by Region 2019 & 2032
- Table 8: Global Vitamin E Market Volume K Tons Forecast, by Region 2019 & 2032
- Table 9: Global Vitamin E Market Revenue Million Forecast, by Country 2019 & 2032
- Table 10: Global Vitamin E Market Volume K Tons Forecast, by Country 2019 & 2032
- Table 11: United States Vitamin E Market Revenue (Million) Forecast, by Application 2019 & 2032
- Table 12: United States Vitamin E Market Volume (K Tons) Forecast, by Application 2019 & 2032
- Table 13: Canada Vitamin E Market Revenue (Million) Forecast, by Application 2019 & 2032
- Table 14: Canada Vitamin E Market Volume (K Tons) Forecast, by Application 2019 & 2032
- Table 15: Mexico Vitamin E Market Revenue (Million) Forecast, by Application 2019 & 2032
- Table 16: Mexico Vitamin E Market Volume (K Tons) Forecast, by Application 2019 & 2032
- Table 17: Rest of North America Vitamin E Market Revenue (Million) Forecast, by Application 2019 & 2032
- Table 18: Rest of North America Vitamin E Market Volume (K Tons) Forecast, by Application 2019 & 2032
- Table 19: Global Vitamin E Market Revenue Million Forecast, by Country 2019 & 2032
- Table 20: Global Vitamin E Market Volume K Tons Forecast, by Country 2019 & 2032
- Table 21: Germany Vitamin E Market Revenue (Million) Forecast, by Application 2019 & 2032
- Table 22: Germany Vitamin E Market Volume (K Tons) Forecast, by Application 2019 & 2032
- Table 23: United Kingdom Vitamin E Market Revenue (Million) Forecast, by Application 2019 & 2032
- Table 24: United Kingdom Vitamin E Market Volume (K Tons) Forecast, by Application 2019 & 2032
- Table 25: France Vitamin E Market Revenue (Million) Forecast, by Application 2019 & 2032
- Table 26: France Vitamin E Market Volume (K Tons) Forecast, by Application 2019 & 2032
- Table 27: Russia Vitamin E Market Revenue (Million) Forecast, by Application 2019 & 2032
- Table 28: Russia Vitamin E Market Volume (K Tons) Forecast, by Application 2019 & 2032
- Table 29: Spain Vitamin E Market Revenue (Million) Forecast, by Application 2019 & 2032
- Table 30: Spain Vitamin E Market Volume (K Tons) Forecast, by Application 2019 & 2032
- Table 31: Italy Vitamin E Market Revenue (Million) Forecast, by Application 2019 & 2032
- Table 32: Italy Vitamin E Market Volume (K Tons) Forecast, by Application 2019 & 2032
- Table 33: Rest of Europe Vitamin E Market Revenue (Million) Forecast, by Application 2019 & 2032
- Table 34: Rest of Europe Vitamin E Market Volume (K Tons) Forecast, by Application 2019 & 2032
- Table 35: Global Vitamin E Market Revenue Million Forecast, by Country 2019 & 2032
- Table 36: Global Vitamin E Market Volume K Tons Forecast, by Country 2019 & 2032
- Table 37: India Vitamin E Market Revenue (Million) Forecast, by Application 2019 & 2032
- Table 38: India Vitamin E Market Volume (K Tons) Forecast, by Application 2019 & 2032
- Table 39: China Vitamin E Market Revenue (Million) Forecast, by Application 2019 & 2032
- Table 40: China Vitamin E Market Volume (K Tons) Forecast, by Application 2019 & 2032
- Table 41: Japan Vitamin E Market Revenue (Million) Forecast, by Application 2019 & 2032
- Table 42: Japan Vitamin E Market Volume (K Tons) Forecast, by Application 2019 & 2032
- Table 43: Australia Vitamin E Market Revenue (Million) Forecast, by Application 2019 & 2032
- Table 44: Australia Vitamin E Market Volume (K Tons) Forecast, by Application 2019 & 2032
- Table 45: Rest of Asia Pacific Vitamin E Market Revenue (Million) Forecast, by Application 2019 & 2032
- Table 46: Rest of Asia Pacific Vitamin E Market Volume (K Tons) Forecast, by Application 2019 & 2032
- Table 47: Global Vitamin E Market Revenue Million Forecast, by Country 2019 & 2032
- Table 48: Global Vitamin E Market Volume K Tons Forecast, by Country 2019 & 2032
- Table 49: Brazil Vitamin E Market Revenue (Million) Forecast, by Application 2019 & 2032
- Table 50: Brazil Vitamin E Market Volume (K Tons) Forecast, by Application 2019 & 2032
- Table 51: Argentina Vitamin E Market Revenue (Million) Forecast, by Application 2019 & 2032
- Table 52: Argentina Vitamin E Market Volume (K Tons) Forecast, by Application 2019 & 2032
- Table 53: Rest of South America Vitamin E Market Revenue (Million) Forecast, by Application 2019 & 2032
- Table 54: Rest of South America Vitamin E Market Volume (K Tons) Forecast, by Application 2019 & 2032
- Table 55: Global Vitamin E Market Revenue Million Forecast, by Country 2019 & 2032
- Table 56: Global Vitamin E Market Volume K Tons Forecast, by Country 2019 & 2032
- Table 57: South Africa Vitamin E Market Revenue (Million) Forecast, by Application 2019 & 2032
- Table 58: South Africa Vitamin E Market Volume (K Tons) Forecast, by Application 2019 & 2032
- Table 59: Saudi Arabia Vitamin E Market Revenue (Million) Forecast, by Application 2019 & 2032
- Table 60: Saudi Arabia Vitamin E Market Volume (K Tons) Forecast, by Application 2019 & 2032
- Table 61: Rest of Middle East and Africa Vitamin E Market Revenue (Million) Forecast, by Application 2019 & 2032
- Table 62: Rest of Middle East and Africa Vitamin E Market Volume (K Tons) Forecast, by Application 2019 & 2032
- Table 63: Global Vitamin E Market Revenue Million Forecast, by Product Type 2019 & 2032
- Table 64: Global Vitamin E Market Volume K Tons Forecast, by Product Type 2019 & 2032
- Table 65: Global Vitamin E Market Revenue Million Forecast, by Application 2019 & 2032
- Table 66: Global Vitamin E Market Volume K Tons Forecast, by Application 2019 & 2032
- Table 67: Global Vitamin E Market Revenue Million Forecast, by Country 2019 & 2032
- Table 68: Global Vitamin E Market Volume K Tons Forecast, by Country 2019 & 2032
- Table 69: United States Vitamin E Market Revenue (Million) Forecast, by Application 2019 & 2032
- Table 70: United States Vitamin E Market Volume (K Tons) Forecast, by Application 2019 & 2032
- Table 71: Canada Vitamin E Market Revenue (Million) Forecast, by Application 2019 & 2032
- Table 72: Canada Vitamin E Market Volume (K Tons) Forecast, by Application 2019 & 2032
- Table 73: Mexico Vitamin E Market Revenue (Million) Forecast, by Application 2019 & 2032
- Table 74: Mexico Vitamin E Market Volume (K Tons) Forecast, by Application 2019 & 2032
- Table 75: Rest of North America Vitamin E Market Revenue (Million) Forecast, by Application 2019 & 2032
- Table 76: Rest of North America Vitamin E Market Volume (K Tons) Forecast, by Application 2019 & 2032
- Table 77: Global Vitamin E Market Revenue Million Forecast, by Product Type 2019 & 2032
- Table 78: Global Vitamin E Market Volume K Tons Forecast, by Product Type 2019 & 2032
- Table 79: Global Vitamin E Market Revenue Million Forecast, by Application 2019 & 2032
- Table 80: Global Vitamin E Market Volume K Tons Forecast, by Application 2019 & 2032
- Table 81: Global Vitamin E Market Revenue Million Forecast, by Country 2019 & 2032
- Table 82: Global Vitamin E Market Volume K Tons Forecast, by Country 2019 & 2032
- Table 83: Germany Vitamin E Market Revenue (Million) Forecast, by Application 2019 & 2032
- Table 84: Germany Vitamin E Market Volume (K Tons) Forecast, by Application 2019 & 2032
- Table 85: United Kingdom Vitamin E Market Revenue (Million) Forecast, by Application 2019 & 2032
- Table 86: United Kingdom Vitamin E Market Volume (K Tons) Forecast, by Application 2019 & 2032
- Table 87: France Vitamin E Market Revenue (Million) Forecast, by Application 2019 & 2032
- Table 88: France Vitamin E Market Volume (K Tons) Forecast, by Application 2019 & 2032
- Table 89: Russia Vitamin E Market Revenue (Million) Forecast, by Application 2019 & 2032
- Table 90: Russia Vitamin E Market Volume (K Tons) Forecast, by Application 2019 & 2032
- Table 91: Spain Vitamin E Market Revenue (Million) Forecast, by Application 2019 & 2032
- Table 92: Spain Vitamin E Market Volume (K Tons) Forecast, by Application 2019 & 2032
- Table 93: Italy Vitamin E Market Revenue (Million) Forecast, by Application 2019 & 2032
- Table 94: Italy Vitamin E Market Volume (K Tons) Forecast, by Application 2019 & 2032
- Table 95: Rest of Europe Vitamin E Market Revenue (Million) Forecast, by Application 2019 & 2032
- Table 96: Rest of Europe Vitamin E Market Volume (K Tons) Forecast, by Application 2019 & 2032
- Table 97: Global Vitamin E Market Revenue Million Forecast, by Product Type 2019 & 2032
- Table 98: Global Vitamin E Market Volume K Tons Forecast, by Product Type 2019 & 2032
- Table 99: Global Vitamin E Market Revenue Million Forecast, by Application 2019 & 2032
- Table 100: Global Vitamin E Market Volume K Tons Forecast, by Application 2019 & 2032
- Table 101: Global Vitamin E Market Revenue Million Forecast, by Country 2019 & 2032
- Table 102: Global Vitamin E Market Volume K Tons Forecast, by Country 2019 & 2032
- Table 103: India Vitamin E Market Revenue (Million) Forecast, by Application 2019 & 2032
- Table 104: India Vitamin E Market Volume (K Tons) Forecast, by Application 2019 & 2032
- Table 105: China Vitamin E Market Revenue (Million) Forecast, by Application 2019 & 2032
- Table 106: China Vitamin E Market Volume (K Tons) Forecast, by Application 2019 & 2032
- Table 107: Japan Vitamin E Market Revenue (Million) Forecast, by Application 2019 & 2032
- Table 108: Japan Vitamin E Market Volume (K Tons) Forecast, by Application 2019 & 2032
- Table 109: Australia Vitamin E Market Revenue (Million) Forecast, by Application 2019 & 2032
- Table 110: Australia Vitamin E Market Volume (K Tons) Forecast, by Application 2019 & 2032
- Table 111: Rest of Asia Pacific Vitamin E Market Revenue (Million) Forecast, by Application 2019 & 2032
- Table 112: Rest of Asia Pacific Vitamin E Market Volume (K Tons) Forecast, by Application 2019 & 2032
- Table 113: Global Vitamin E Market Revenue Million Forecast, by Product Type 2019 & 2032
- Table 114: Global Vitamin E Market Volume K Tons Forecast, by Product Type 2019 & 2032
- Table 115: Global Vitamin E Market Revenue Million Forecast, by Application 2019 & 2032
- Table 116: Global Vitamin E Market Volume K Tons Forecast, by Application 2019 & 2032
- Table 117: Global Vitamin E Market Revenue Million Forecast, by Country 2019 & 2032
- Table 118: Global Vitamin E Market Volume K Tons Forecast, by Country 2019 & 2032
- Table 119: Brazil Vitamin E Market Revenue (Million) Forecast, by Application 2019 & 2032
- Table 120: Brazil Vitamin E Market Volume (K Tons) Forecast, by Application 2019 & 2032
- Table 121: Argentina Vitamin E Market Revenue (Million) Forecast, by Application 2019 & 2032
- Table 122: Argentina Vitamin E Market Volume (K Tons) Forecast, by Application 2019 & 2032
- Table 123: Rest of South America Vitamin E Market Revenue (Million) Forecast, by Application 2019 & 2032
- Table 124: Rest of South America Vitamin E Market Volume (K Tons) Forecast, by Application 2019 & 2032
- Table 125: Global Vitamin E Market Revenue Million Forecast, by Product Type 2019 & 2032
- Table 126: Global Vitamin E Market Volume K Tons Forecast, by Product Type 2019 & 2032
- Table 127: Global Vitamin E Market Revenue Million Forecast, by Application 2019 & 2032
- Table 128: Global Vitamin E Market Volume K Tons Forecast, by Application 2019 & 2032
- Table 129: Global Vitamin E Market Revenue Million Forecast, by Country 2019 & 2032
- Table 130: Global Vitamin E Market Volume K Tons Forecast, by Country 2019 & 2032
- Table 131: South Africa Vitamin E Market Revenue (Million) Forecast, by Application 2019 & 2032
- Table 132: South Africa Vitamin E Market Volume (K Tons) Forecast, by Application 2019 & 2032
- Table 133: Saudi Arabia Vitamin E Market Revenue (Million) Forecast, by Application 2019 & 2032
- Table 134: Saudi Arabia Vitamin E Market Volume (K Tons) Forecast, by Application 2019 & 2032
- Table 135: Rest of Middle East and Africa Vitamin E Market Revenue (Million) Forecast, by Application 2019 & 2032
- Table 136: Rest of Middle East and Africa Vitamin E Market Volume (K Tons) Forecast, by Application 2019 & 2032
Frequently Asked Questions
1. What is the projected Compound Annual Growth Rate (CAGR) of the Vitamin E Market?
The projected CAGR is approximately 4.01%.
2. Which companies are prominent players in the Vitamin E Market?
Key companies in the market include Prinova Group LLC, Merck KGaA, Orah Nutrichem, Archer Daniels Midland Company, BASF SE, Aryan International, Koninklijke DSM NV, The Bountiful Company*List Not Exhaustive, Jilin Beisha Pharmaceutical Co Ltd, BTSA Biotecnologías Aplicadas SL.
3. What are the main segments of the Vitamin E Market?
The market segments include Product Type, Application.
4. Can you provide details about the market size?
The market size is estimated to be USD 3924.44 Million as of 2022.
5. What are some drivers contributing to market growth?
Awareness of Health Benefits Associated with Tocotrienol; Escalating Demand for Anti-Aging Products Containing Tocotrienol.
6. What are the notable trends driving market growth?
Increasing Demand for Vitamin E in Various Applications.
7. Are there any restraints impacting market growth?
Availability of Substitutes.
8. Can you provide examples of recent developments in the market?
December 2021: The Kensing company announced its partnership with Azelis for a better and more feasible distribution of vegetable oils, vitamins, and personal care products in Europe and the Middle East and Africa. Azelis has a strong distribution network across these regions in the B2B segment. The company mainly aims to distribute its mainstream products Covi-ox, Covitol, Copherol, and Generol.
9. What pricing options are available for accessing the report?
Pricing options include single-user, multi-user, and enterprise licenses priced at USD 4750, USD 5250, and USD 8750 respectively.
10. Is the market size provided in terms of value or volume?
The market size is provided in terms of value, measured in Million and volume, measured in K Tons.
11. Are there any specific market keywords associated with the report?
Yes, the market keyword associated with the report is "Vitamin E Market," which aids in identifying and referencing the specific market segment covered.
12. How do I determine which pricing option suits my needs best?
The pricing options vary based on user requirements and access needs. Individual users may opt for single-user licenses, while businesses requiring broader access may choose multi-user or enterprise licenses for cost-effective access to the report.
13. Are there any additional resources or data provided in the Vitamin E Market report?
While the report offers comprehensive insights, it's advisable to review the specific contents or supplementary materials provided to ascertain if additional resources or data are available.
14. How can I stay updated on further developments or reports in the Vitamin E Market?
To stay informed about further developments, trends, and reports in the Vitamin E Market, consider subscribing to industry newsletters, following relevant companies and organizations, or regularly checking reputable industry news sources and publications.
Methodology
Step 1 - Identification of Relevant Samples Size from Population Database


Step 2 - Approaches for Defining Global Market Size (Value, Volume* & Price*)

Note*: In applicable scenarios
Step 3 - Data Sources
Primary Research
- Web Analytics
- Survey Reports
- Research Institute
- Latest Research Reports
- Opinion Leaders
Secondary Research
- Annual Reports
- White Paper
- Latest Press Release
- Industry Association
- Paid Database
- Investor Presentations

Step 4 - Data Triangulation
Involves using different sources of information in order to increase the validity of a study
These sources are likely to be stakeholders in a program - participants, other researchers, program staff, other community members, and so on.
Then we put all data in single framework & apply various statistical tools to find out the dynamic on the market.
During the analysis stage, feedback from the stakeholder groups would be compared to determine areas of agreement as well as areas of divergence
