

Key Insights
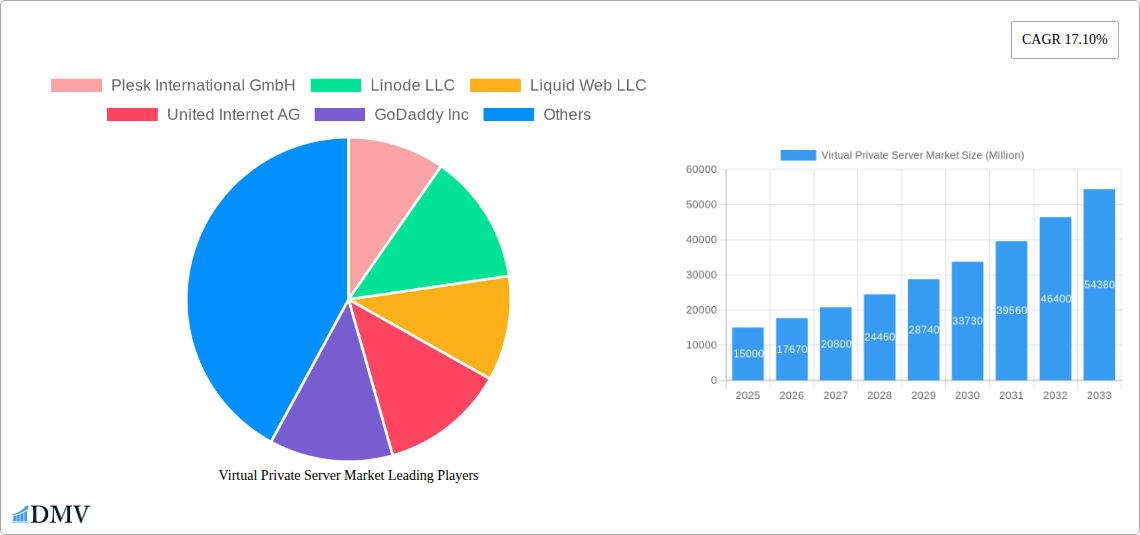
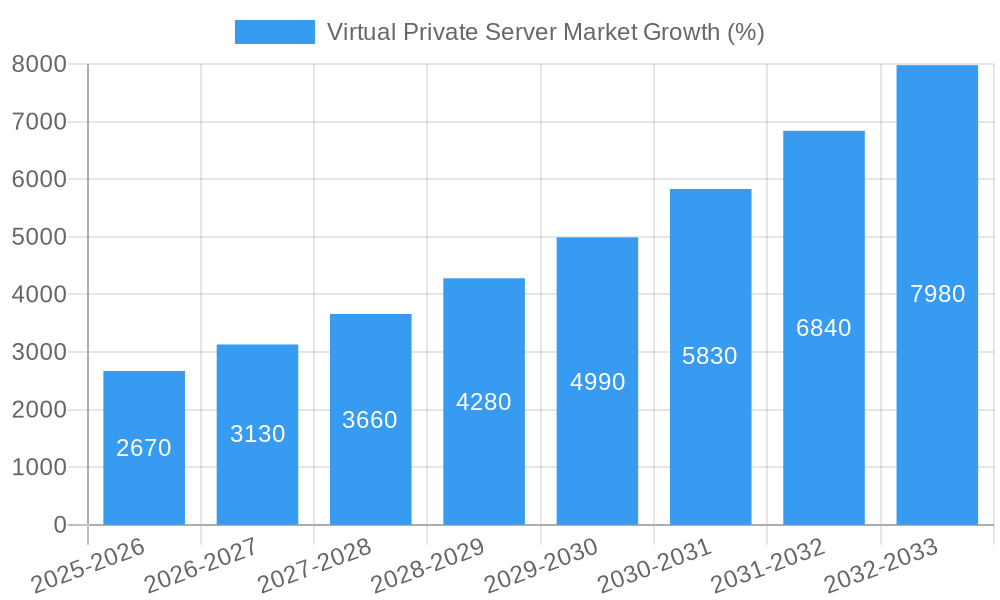
The Virtual Private Server (VPS) market is experiencing robust growth, driven by the increasing demand for scalable and cost-effective cloud computing solutions. The market's 17.10% CAGR from 2019 to 2024 indicates a significant upward trajectory, projected to continue throughout the forecast period (2025-2033). Key drivers include the rising adoption of cloud-native applications, the expanding need for enhanced security and control over IT infrastructure, and the growing preference for flexible and easily manageable hosting solutions among Small and Medium-Sized Enterprises (SMEs) and large enterprises alike. The IT & Communication sector currently dominates the end-user verticals, followed by BFSI and Retail, reflecting the significant reliance on robust and secure online infrastructure across these sectors. However, growth is anticipated across all segments, with healthcare and other emerging verticals showing considerable promise. The market is segmented by operating system (Windows, Linux, others), organization size (SMEs, large enterprises), and end-user vertical, offering various options to cater to diverse business needs. Competition is fierce, with established players like Plesk, Linode, Liquid Web, and Amazon Web Services competing with newer entrants. Geographic expansion, particularly in rapidly developing economies within Asia-Pacific and South America, presents lucrative opportunities for market players. Challenges include managing security risks associated with VPS environments and ensuring consistent service quality across geographically diverse locations.
The projected market size for 2025, based on the provided CAGR and historical data (assuming a 2024 market size for estimation purposes), suggests a substantial value. Continued growth will be influenced by technological advancements, including improved virtualization technologies and enhanced security features. Furthermore, the increasing adoption of hybrid cloud models and the integration of edge computing are expected to further fuel market expansion. The consolidation of smaller hosting providers and strategic partnerships will also play a crucial role in shaping the competitive landscape in the coming years. Strategic initiatives focusing on managed services and specialized solutions will be vital for players seeking sustained growth and market leadership in this dynamic environment.
Virtual Private Server (VPS) Market: A Comprehensive Report (2019-2033)
This insightful report provides a comprehensive analysis of the Virtual Private Server (VPS) market, offering crucial insights for stakeholders seeking to navigate this dynamic landscape. The study covers the period 2019-2033, with a focus on the 2025-2033 forecast period, and includes detailed analysis of market size, segmentation, leading players, and future trends. The global VPS market is projected to reach xx Million by 2033, exhibiting a robust Compound Annual Growth Rate (CAGR).
Virtual Private Server Market Composition & Trends
This section delves into the competitive dynamics of the VPS market, examining market concentration, innovation drivers, regulatory influences, substitute products, end-user profiles, and merger & acquisition (M&A) activities. The market exhibits a moderately consolidated structure, with key players holding significant market share. However, the emergence of niche players and innovative solutions continues to reshape the competitive landscape.
Market Share Distribution (2024):
- Amazon Web Services Inc: 20%
- OVH Group: 15%
- DigitalOcean Inc: 12%
- Other Players: 53%
Innovation Catalysts: Continuous advancements in virtualization technologies, containerization, and serverless computing are driving innovation. The increasing adoption of cloud-native applications and microservices architectures further fuels market growth.
Regulatory Landscape: Varying data privacy regulations across different geographies present both challenges and opportunities. Compliance requirements influence service offerings and deployment strategies.
Substitute Products: Cloud-based services and dedicated servers represent potential substitutes, though the cost-effectiveness and flexibility of VPS solutions maintain their appeal.
End-User Profiles: The report provides detailed analysis of end-user preferences, adoption rates, and spending patterns across different segments.
M&A Activities: The VPS market has witnessed significant M&A activity in recent years, with deal values exceeding xx Million in the period 2019-2024. This consolidation reflects the industry’s maturation and the pursuit of scale and technological capabilities.
Virtual Private Server Market Industry Evolution
This section analyzes the evolution of the VPS market, tracing its growth trajectory from 2019 to 2024 and projecting its future path to 2033. The market has witnessed substantial growth, driven by the increasing adoption of cloud computing, the rising demand for scalable and cost-effective IT infrastructure, and the proliferation of digital businesses.
Technological advancements, including advancements in virtualization, serverless computing, and edge computing, have played a pivotal role in shaping the market. Shifting consumer demands toward greater agility, scalability, and cost optimization have further accelerated growth. The market experienced a CAGR of xx% during the historical period (2019-2024) and is projected to maintain a strong CAGR of xx% during the forecast period (2025-2033), reaching xx Million by 2033. Adoption metrics reveal a significant increase in VPS deployments across various industries.
Leading Regions, Countries, or Segments in Virtual Private Server Market
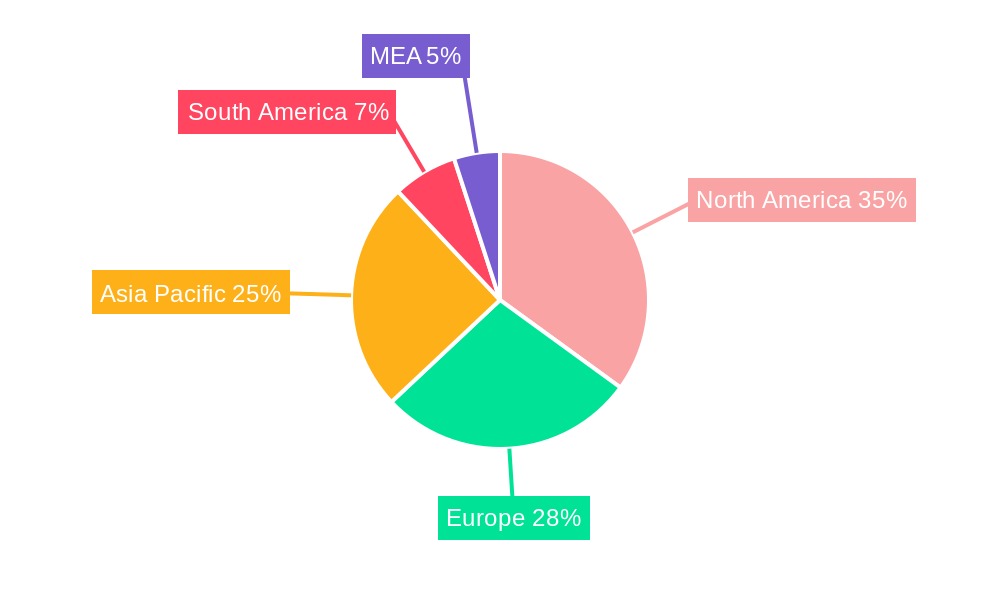
This section identifies the leading regions, countries, and segments within the VPS market. The North American market currently holds the largest share due to strong adoption by large enterprises and SMEs. However, the Asia-Pacific region is projected to experience the fastest growth rate due to increasing digitalization and infrastructural development.
By Operating System:
- Linux: Remains the dominant OS due to its open-source nature, cost-effectiveness, and wide community support.
- Windows: Holds a significant share, particularly among enterprises requiring specific software compatibility.
- Other Operating Systems: This segment is smaller but growing with the increasing adoption of specialized operating systems for specific applications.
By Organization Size:
- SMEs: This segment represents a large portion of the market, driven by cost-effectiveness and scalability.
- Large Enterprises: This segment drives higher spending, fueled by mission-critical applications and complex infrastructure needs.
By End-user Vertical:
- IT & Communication: This sector is a major driver of VPS adoption, using it for various applications including hosting, development, and testing.
- BFSI: The financial sector requires high security and reliability, making VPS a crucial infrastructure component.
- Retail: The retail industry increasingly relies on VPS for e-commerce platforms and related applications.
- Healthcare: The healthcare industry's rising digitalization is driving the adoption of VPS for secure data storage and processing.
- Other End-user Verticals: This segment encompasses various sectors showing increasing adoption of VPS solutions.
Virtual Private Server Market Product Innovations
Recent innovations in the VPS market include advancements in serverless computing, enhanced security features, improved scalability options, and integration with other cloud services. These innovations offer improved performance, flexibility, and cost-effectiveness, driving further market growth. Unique selling propositions (USPs) include optimized resource allocation, customizable configurations, and enhanced security measures.
Propelling Factors for Virtual Private Server Market Growth
Several factors contribute to the VPS market's growth. Technological advancements, such as improved virtualization technologies and containerization, enable greater efficiency and scalability. Economic factors, such as the increasing cost-effectiveness of cloud computing, make VPS solutions more accessible to businesses. Finally, supportive regulatory frameworks in certain regions stimulate market expansion.
Obstacles in the Virtual Private Server Market
The VPS market faces challenges such as security concerns, potential data breaches, and the complexity of managing VPS infrastructure. Supply chain disruptions can impact availability and pricing. Intense competition from established cloud providers and emerging players also creates pressure. These factors can potentially limit market growth if not effectively addressed.
Future Opportunities in Virtual Private Server Market
Future opportunities lie in expanding into emerging markets, integrating artificial intelligence and machine learning for optimized resource management, and developing specialized VPS solutions for specific industries. Emerging technologies, such as edge computing, also present significant potential. The increasing adoption of 5G networks is expected to further drive market growth.
Major Players in the Virtual Private Server Market Ecosystem
- Plesk International GmbH
- Linode LLC
- Liquid Web LLC
- United Internet AG
- GoDaddy Inc
- OVH Group
- InMotion Hosting
- A2 Hosting Inc
- Amazon Web Services Inc
- Tektonic Inc
- DreamHost LLC
- Endurance International Group
- Vultr Holdings Corporation
- Rackspace Inc
- DigitalOcean Inc
Key Developments in Virtual Private Server Market Industry
- February 2023: Dell announced new PowerEdge servers (XR8000, XR7620, XR5610) powered by 4th Generation Xeon scalable processors, enhancing VPS infrastructure capabilities. New partnerships for private 5G networks further expand possibilities.
- October 2022: Serverspace launched a new range of virtual servers powered by the vStack hyper-converged platform, offering users Linux and Windows server options across multiple data centers.
Strategic Virtual Private Server Market Forecast
The VPS market is poised for continued growth, driven by technological advancements, increasing demand for scalable and cost-effective IT solutions, and the expansion of cloud computing adoption across various industries. Future opportunities include the integration of emerging technologies such as AI and the expansion into new markets, promising significant market potential in the years to come.
Virtual Private Server Market Segmentation
-
1. Operating System
- 1.1. Windows
- 1.2. Linux
- 1.3. Other Operating Systems
-
2. Organization Size
- 2.1. Small and Medium-Sized Enterprises (SMEs)
- 2.2. Large Enterprises
-
3. End-user Vertical
- 3.1. IT & Communication
- 3.2. BFSI
- 3.3. Retail
- 3.4. Healthcare
- 3.5. Other End-user Verticals
Virtual Private Server Market Segmentation By Geography
- 1. North America
- 2. Europe
- 3. Asia Pacific
- 4. Latin America
- 5. Middle East and Africa
Virtual Private Server Market REPORT HIGHLIGHTS
| Aspects | Details |
|---|---|
| Study Period | 2019-2033 |
| Base Year | 2024 |
| Estimated Year | 2025 |
| Forecast Period | 2025-2033 |
| Historical Period | 2019-2024 |
| Growth Rate | CAGR of 17.10% from 2019-2033 |
| Segmentation |
|
Table of Contents
- 1. Introduction
- 1.1. Research Scope
- 1.2. Market Segmentation
- 1.3. Research Methodology
- 1.4. Definitions and Assumptions
- 2. Executive Summary
- 2.1. Introduction
- 3. Market Dynamics
- 3.1. Introduction
- 3.2. Market Drivers
- 3.2.1 Rising Security Concerns Among Enterprises; Increased Customization
- 3.2.2 Scalability
- 3.2.3 and Downtime; Greater Control with VPS than Shared Hosting
- 3.3. Market Restrains
- 3.3.1 Limited Efficiency Compared to Shared Hosting
- 3.3.2 Dedicated Hosting
- 3.3.3 and Cloud Servers
- 3.4. Market Trends
- 3.4.1. Surge in the count of Small and Medium-sized enterprises (SMEs) and rise in the trend of BYOD is expected to drive the market.
- 4. Market Factor Analysis
- 4.1. Porters Five Forces
- 4.2. Supply/Value Chain
- 4.3. PESTEL analysis
- 4.4. Market Entropy
- 4.5. Patent/Trademark Analysis
- 5. Global Virtual Private Server Market Analysis, Insights and Forecast, 2019-2031
- 5.1. Market Analysis, Insights and Forecast - by Operating System
- 5.1.1. Windows
- 5.1.2. Linux
- 5.1.3. Other Operating Systems
- 5.2. Market Analysis, Insights and Forecast - by Organization Size
- 5.2.1. Small and Medium-Sized Enterprises (SMEs)
- 5.2.2. Large Enterprises
- 5.3. Market Analysis, Insights and Forecast - by End-user Vertical
- 5.3.1. IT & Communication
- 5.3.2. BFSI
- 5.3.3. Retail
- 5.3.4. Healthcare
- 5.3.5. Other End-user Verticals
- 5.4. Market Analysis, Insights and Forecast - by Region
- 5.4.1. North America
- 5.4.2. Europe
- 5.4.3. Asia Pacific
- 5.4.4. Latin America
- 5.4.5. Middle East and Africa
- 5.1. Market Analysis, Insights and Forecast - by Operating System
- 6. North America Virtual Private Server Market Analysis, Insights and Forecast, 2019-2031
- 6.1. Market Analysis, Insights and Forecast - by Operating System
- 6.1.1. Windows
- 6.1.2. Linux
- 6.1.3. Other Operating Systems
- 6.2. Market Analysis, Insights and Forecast - by Organization Size
- 6.2.1. Small and Medium-Sized Enterprises (SMEs)
- 6.2.2. Large Enterprises
- 6.3. Market Analysis, Insights and Forecast - by End-user Vertical
- 6.3.1. IT & Communication
- 6.3.2. BFSI
- 6.3.3. Retail
- 6.3.4. Healthcare
- 6.3.5. Other End-user Verticals
- 6.1. Market Analysis, Insights and Forecast - by Operating System
- 7. Europe Virtual Private Server Market Analysis, Insights and Forecast, 2019-2031
- 7.1. Market Analysis, Insights and Forecast - by Operating System
- 7.1.1. Windows
- 7.1.2. Linux
- 7.1.3. Other Operating Systems
- 7.2. Market Analysis, Insights and Forecast - by Organization Size
- 7.2.1. Small and Medium-Sized Enterprises (SMEs)
- 7.2.2. Large Enterprises
- 7.3. Market Analysis, Insights and Forecast - by End-user Vertical
- 7.3.1. IT & Communication
- 7.3.2. BFSI
- 7.3.3. Retail
- 7.3.4. Healthcare
- 7.3.5. Other End-user Verticals
- 7.1. Market Analysis, Insights and Forecast - by Operating System
- 8. Asia Pacific Virtual Private Server Market Analysis, Insights and Forecast, 2019-2031
- 8.1. Market Analysis, Insights and Forecast - by Operating System
- 8.1.1. Windows
- 8.1.2. Linux
- 8.1.3. Other Operating Systems
- 8.2. Market Analysis, Insights and Forecast - by Organization Size
- 8.2.1. Small and Medium-Sized Enterprises (SMEs)
- 8.2.2. Large Enterprises
- 8.3. Market Analysis, Insights and Forecast - by End-user Vertical
- 8.3.1. IT & Communication
- 8.3.2. BFSI
- 8.3.3. Retail
- 8.3.4. Healthcare
- 8.3.5. Other End-user Verticals
- 8.1. Market Analysis, Insights and Forecast - by Operating System
- 9. Latin America Virtual Private Server Market Analysis, Insights and Forecast, 2019-2031
- 9.1. Market Analysis, Insights and Forecast - by Operating System
- 9.1.1. Windows
- 9.1.2. Linux
- 9.1.3. Other Operating Systems
- 9.2. Market Analysis, Insights and Forecast - by Organization Size
- 9.2.1. Small and Medium-Sized Enterprises (SMEs)
- 9.2.2. Large Enterprises
- 9.3. Market Analysis, Insights and Forecast - by End-user Vertical
- 9.3.1. IT & Communication
- 9.3.2. BFSI
- 9.3.3. Retail
- 9.3.4. Healthcare
- 9.3.5. Other End-user Verticals
- 9.1. Market Analysis, Insights and Forecast - by Operating System
- 10. Middle East and Africa Virtual Private Server Market Analysis, Insights and Forecast, 2019-2031
- 10.1. Market Analysis, Insights and Forecast - by Operating System
- 10.1.1. Windows
- 10.1.2. Linux
- 10.1.3. Other Operating Systems
- 10.2. Market Analysis, Insights and Forecast - by Organization Size
- 10.2.1. Small and Medium-Sized Enterprises (SMEs)
- 10.2.2. Large Enterprises
- 10.3. Market Analysis, Insights and Forecast - by End-user Vertical
- 10.3.1. IT & Communication
- 10.3.2. BFSI
- 10.3.3. Retail
- 10.3.4. Healthcare
- 10.3.5. Other End-user Verticals
- 10.1. Market Analysis, Insights and Forecast - by Operating System
- 11. North America Virtual Private Server Market Analysis, Insights and Forecast, 2019-2031
- 11.1. Market Analysis, Insights and Forecast - By Country/Sub-region
- 11.1.1 United States
- 11.1.2 Canada
- 11.1.3 Mexico
- 12. Europe Virtual Private Server Market Analysis, Insights and Forecast, 2019-2031
- 12.1. Market Analysis, Insights and Forecast - By Country/Sub-region
- 12.1.1 Germany
- 12.1.2 United Kingdom
- 12.1.3 France
- 12.1.4 Spain
- 12.1.5 Italy
- 12.1.6 Spain
- 12.1.7 Belgium
- 12.1.8 Netherland
- 12.1.9 Nordics
- 12.1.10 Rest of Europe
- 13. Asia Pacific Virtual Private Server Market Analysis, Insights and Forecast, 2019-2031
- 13.1. Market Analysis, Insights and Forecast - By Country/Sub-region
- 13.1.1 China
- 13.1.2 Japan
- 13.1.3 India
- 13.1.4 South Korea
- 13.1.5 Southeast Asia
- 13.1.6 Australia
- 13.1.7 Indonesia
- 13.1.8 Phillipes
- 13.1.9 Singapore
- 13.1.10 Thailandc
- 13.1.11 Rest of Asia Pacific
- 14. South America Virtual Private Server Market Analysis, Insights and Forecast, 2019-2031
- 14.1. Market Analysis, Insights and Forecast - By Country/Sub-region
- 14.1.1 Brazil
- 14.1.2 Argentina
- 14.1.3 Peru
- 14.1.4 Chile
- 14.1.5 Colombia
- 14.1.6 Ecuador
- 14.1.7 Venezuela
- 14.1.8 Rest of South America
- 15. North America Virtual Private Server Market Analysis, Insights and Forecast, 2019-2031
- 15.1. Market Analysis, Insights and Forecast - By Country/Sub-region
- 15.1.1 United States
- 15.1.2 Canada
- 15.1.3 Mexico
- 16. MEA Virtual Private Server Market Analysis, Insights and Forecast, 2019-2031
- 16.1. Market Analysis, Insights and Forecast - By Country/Sub-region
- 16.1.1 United Arab Emirates
- 16.1.2 Saudi Arabia
- 16.1.3 South Africa
- 16.1.4 Rest of Middle East and Africa
- 17. Competitive Analysis
- 17.1. Global Market Share Analysis 2024
- 17.2. Company Profiles
- 17.2.1 Plesk International GmbH
- 17.2.1.1. Overview
- 17.2.1.2. Products
- 17.2.1.3. SWOT Analysis
- 17.2.1.4. Recent Developments
- 17.2.1.5. Financials (Based on Availability)
- 17.2.2 Linode LLC
- 17.2.2.1. Overview
- 17.2.2.2. Products
- 17.2.2.3. SWOT Analysis
- 17.2.2.4. Recent Developments
- 17.2.2.5. Financials (Based on Availability)
- 17.2.3 Liquid Web LLC
- 17.2.3.1. Overview
- 17.2.3.2. Products
- 17.2.3.3. SWOT Analysis
- 17.2.3.4. Recent Developments
- 17.2.3.5. Financials (Based on Availability)
- 17.2.4 United Internet AG
- 17.2.4.1. Overview
- 17.2.4.2. Products
- 17.2.4.3. SWOT Analysis
- 17.2.4.4. Recent Developments
- 17.2.4.5. Financials (Based on Availability)
- 17.2.5 GoDaddy Inc
- 17.2.5.1. Overview
- 17.2.5.2. Products
- 17.2.5.3. SWOT Analysis
- 17.2.5.4. Recent Developments
- 17.2.5.5. Financials (Based on Availability)
- 17.2.6 OVH Group
- 17.2.6.1. Overview
- 17.2.6.2. Products
- 17.2.6.3. SWOT Analysis
- 17.2.6.4. Recent Developments
- 17.2.6.5. Financials (Based on Availability)
- 17.2.7 InMotion Hosting
- 17.2.7.1. Overview
- 17.2.7.2. Products
- 17.2.7.3. SWOT Analysis
- 17.2.7.4. Recent Developments
- 17.2.7.5. Financials (Based on Availability)
- 17.2.8 A2 Hosting Inc
- 17.2.8.1. Overview
- 17.2.8.2. Products
- 17.2.8.3. SWOT Analysis
- 17.2.8.4. Recent Developments
- 17.2.8.5. Financials (Based on Availability)
- 17.2.9 Amazon Web Services Inc
- 17.2.9.1. Overview
- 17.2.9.2. Products
- 17.2.9.3. SWOT Analysis
- 17.2.9.4. Recent Developments
- 17.2.9.5. Financials (Based on Availability)
- 17.2.10 Tektonic Inc
- 17.2.10.1. Overview
- 17.2.10.2. Products
- 17.2.10.3. SWOT Analysis
- 17.2.10.4. Recent Developments
- 17.2.10.5. Financials (Based on Availability)
- 17.2.11 DreamHost LLC
- 17.2.11.1. Overview
- 17.2.11.2. Products
- 17.2.11.3. SWOT Analysis
- 17.2.11.4. Recent Developments
- 17.2.11.5. Financials (Based on Availability)
- 17.2.12 Endurance International Group
- 17.2.12.1. Overview
- 17.2.12.2. Products
- 17.2.12.3. SWOT Analysis
- 17.2.12.4. Recent Developments
- 17.2.12.5. Financials (Based on Availability)
- 17.2.13 Vultr Holdings Corporation
- 17.2.13.1. Overview
- 17.2.13.2. Products
- 17.2.13.3. SWOT Analysis
- 17.2.13.4. Recent Developments
- 17.2.13.5. Financials (Based on Availability)
- 17.2.14 Rackspace Inc
- 17.2.14.1. Overview
- 17.2.14.2. Products
- 17.2.14.3. SWOT Analysis
- 17.2.14.4. Recent Developments
- 17.2.14.5. Financials (Based on Availability)
- 17.2.15 DigitalOcean Inc
- 17.2.15.1. Overview
- 17.2.15.2. Products
- 17.2.15.3. SWOT Analysis
- 17.2.15.4. Recent Developments
- 17.2.15.5. Financials (Based on Availability)
- 17.2.1 Plesk International GmbH
List of Figures
- Figure 1: Global Virtual Private Server Market Revenue Breakdown (Million, %) by Region 2024 & 2032
- Figure 2: Global Virtual Private Server Market Volume Breakdown (K Unit, %) by Region 2024 & 2032
- Figure 3: North America Virtual Private Server Market Revenue (Million), by Country 2024 & 2032
- Figure 4: North America Virtual Private Server Market Volume (K Unit), by Country 2024 & 2032
- Figure 5: North America Virtual Private Server Market Revenue Share (%), by Country 2024 & 2032
- Figure 6: North America Virtual Private Server Market Volume Share (%), by Country 2024 & 2032
- Figure 7: Europe Virtual Private Server Market Revenue (Million), by Country 2024 & 2032
- Figure 8: Europe Virtual Private Server Market Volume (K Unit), by Country 2024 & 2032
- Figure 9: Europe Virtual Private Server Market Revenue Share (%), by Country 2024 & 2032
- Figure 10: Europe Virtual Private Server Market Volume Share (%), by Country 2024 & 2032
- Figure 11: Asia Pacific Virtual Private Server Market Revenue (Million), by Country 2024 & 2032
- Figure 12: Asia Pacific Virtual Private Server Market Volume (K Unit), by Country 2024 & 2032
- Figure 13: Asia Pacific Virtual Private Server Market Revenue Share (%), by Country 2024 & 2032
- Figure 14: Asia Pacific Virtual Private Server Market Volume Share (%), by Country 2024 & 2032
- Figure 15: South America Virtual Private Server Market Revenue (Million), by Country 2024 & 2032
- Figure 16: South America Virtual Private Server Market Volume (K Unit), by Country 2024 & 2032
- Figure 17: South America Virtual Private Server Market Revenue Share (%), by Country 2024 & 2032
- Figure 18: South America Virtual Private Server Market Volume Share (%), by Country 2024 & 2032
- Figure 19: North America Virtual Private Server Market Revenue (Million), by Country 2024 & 2032
- Figure 20: North America Virtual Private Server Market Volume (K Unit), by Country 2024 & 2032
- Figure 21: North America Virtual Private Server Market Revenue Share (%), by Country 2024 & 2032
- Figure 22: North America Virtual Private Server Market Volume Share (%), by Country 2024 & 2032
- Figure 23: MEA Virtual Private Server Market Revenue (Million), by Country 2024 & 2032
- Figure 24: MEA Virtual Private Server Market Volume (K Unit), by Country 2024 & 2032
- Figure 25: MEA Virtual Private Server Market Revenue Share (%), by Country 2024 & 2032
- Figure 26: MEA Virtual Private Server Market Volume Share (%), by Country 2024 & 2032
- Figure 27: North America Virtual Private Server Market Revenue (Million), by Operating System 2024 & 2032
- Figure 28: North America Virtual Private Server Market Volume (K Unit), by Operating System 2024 & 2032
- Figure 29: North America Virtual Private Server Market Revenue Share (%), by Operating System 2024 & 2032
- Figure 30: North America Virtual Private Server Market Volume Share (%), by Operating System 2024 & 2032
- Figure 31: North America Virtual Private Server Market Revenue (Million), by Organization Size 2024 & 2032
- Figure 32: North America Virtual Private Server Market Volume (K Unit), by Organization Size 2024 & 2032
- Figure 33: North America Virtual Private Server Market Revenue Share (%), by Organization Size 2024 & 2032
- Figure 34: North America Virtual Private Server Market Volume Share (%), by Organization Size 2024 & 2032
- Figure 35: North America Virtual Private Server Market Revenue (Million), by End-user Vertical 2024 & 2032
- Figure 36: North America Virtual Private Server Market Volume (K Unit), by End-user Vertical 2024 & 2032
- Figure 37: North America Virtual Private Server Market Revenue Share (%), by End-user Vertical 2024 & 2032
- Figure 38: North America Virtual Private Server Market Volume Share (%), by End-user Vertical 2024 & 2032
- Figure 39: North America Virtual Private Server Market Revenue (Million), by Country 2024 & 2032
- Figure 40: North America Virtual Private Server Market Volume (K Unit), by Country 2024 & 2032
- Figure 41: North America Virtual Private Server Market Revenue Share (%), by Country 2024 & 2032
- Figure 42: North America Virtual Private Server Market Volume Share (%), by Country 2024 & 2032
- Figure 43: Europe Virtual Private Server Market Revenue (Million), by Operating System 2024 & 2032
- Figure 44: Europe Virtual Private Server Market Volume (K Unit), by Operating System 2024 & 2032
- Figure 45: Europe Virtual Private Server Market Revenue Share (%), by Operating System 2024 & 2032
- Figure 46: Europe Virtual Private Server Market Volume Share (%), by Operating System 2024 & 2032
- Figure 47: Europe Virtual Private Server Market Revenue (Million), by Organization Size 2024 & 2032
- Figure 48: Europe Virtual Private Server Market Volume (K Unit), by Organization Size 2024 & 2032
- Figure 49: Europe Virtual Private Server Market Revenue Share (%), by Organization Size 2024 & 2032
- Figure 50: Europe Virtual Private Server Market Volume Share (%), by Organization Size 2024 & 2032
- Figure 51: Europe Virtual Private Server Market Revenue (Million), by End-user Vertical 2024 & 2032
- Figure 52: Europe Virtual Private Server Market Volume (K Unit), by End-user Vertical 2024 & 2032
- Figure 53: Europe Virtual Private Server Market Revenue Share (%), by End-user Vertical 2024 & 2032
- Figure 54: Europe Virtual Private Server Market Volume Share (%), by End-user Vertical 2024 & 2032
- Figure 55: Europe Virtual Private Server Market Revenue (Million), by Country 2024 & 2032
- Figure 56: Europe Virtual Private Server Market Volume (K Unit), by Country 2024 & 2032
- Figure 57: Europe Virtual Private Server Market Revenue Share (%), by Country 2024 & 2032
- Figure 58: Europe Virtual Private Server Market Volume Share (%), by Country 2024 & 2032
- Figure 59: Asia Pacific Virtual Private Server Market Revenue (Million), by Operating System 2024 & 2032
- Figure 60: Asia Pacific Virtual Private Server Market Volume (K Unit), by Operating System 2024 & 2032
- Figure 61: Asia Pacific Virtual Private Server Market Revenue Share (%), by Operating System 2024 & 2032
- Figure 62: Asia Pacific Virtual Private Server Market Volume Share (%), by Operating System 2024 & 2032
- Figure 63: Asia Pacific Virtual Private Server Market Revenue (Million), by Organization Size 2024 & 2032
- Figure 64: Asia Pacific Virtual Private Server Market Volume (K Unit), by Organization Size 2024 & 2032
- Figure 65: Asia Pacific Virtual Private Server Market Revenue Share (%), by Organization Size 2024 & 2032
- Figure 66: Asia Pacific Virtual Private Server Market Volume Share (%), by Organization Size 2024 & 2032
- Figure 67: Asia Pacific Virtual Private Server Market Revenue (Million), by End-user Vertical 2024 & 2032
- Figure 68: Asia Pacific Virtual Private Server Market Volume (K Unit), by End-user Vertical 2024 & 2032
- Figure 69: Asia Pacific Virtual Private Server Market Revenue Share (%), by End-user Vertical 2024 & 2032
- Figure 70: Asia Pacific Virtual Private Server Market Volume Share (%), by End-user Vertical 2024 & 2032
- Figure 71: Asia Pacific Virtual Private Server Market Revenue (Million), by Country 2024 & 2032
- Figure 72: Asia Pacific Virtual Private Server Market Volume (K Unit), by Country 2024 & 2032
- Figure 73: Asia Pacific Virtual Private Server Market Revenue Share (%), by Country 2024 & 2032
- Figure 74: Asia Pacific Virtual Private Server Market Volume Share (%), by Country 2024 & 2032
- Figure 75: Latin America Virtual Private Server Market Revenue (Million), by Operating System 2024 & 2032
- Figure 76: Latin America Virtual Private Server Market Volume (K Unit), by Operating System 2024 & 2032
- Figure 77: Latin America Virtual Private Server Market Revenue Share (%), by Operating System 2024 & 2032
- Figure 78: Latin America Virtual Private Server Market Volume Share (%), by Operating System 2024 & 2032
- Figure 79: Latin America Virtual Private Server Market Revenue (Million), by Organization Size 2024 & 2032
- Figure 80: Latin America Virtual Private Server Market Volume (K Unit), by Organization Size 2024 & 2032
- Figure 81: Latin America Virtual Private Server Market Revenue Share (%), by Organization Size 2024 & 2032
- Figure 82: Latin America Virtual Private Server Market Volume Share (%), by Organization Size 2024 & 2032
- Figure 83: Latin America Virtual Private Server Market Revenue (Million), by End-user Vertical 2024 & 2032
- Figure 84: Latin America Virtual Private Server Market Volume (K Unit), by End-user Vertical 2024 & 2032
- Figure 85: Latin America Virtual Private Server Market Revenue Share (%), by End-user Vertical 2024 & 2032
- Figure 86: Latin America Virtual Private Server Market Volume Share (%), by End-user Vertical 2024 & 2032
- Figure 87: Latin America Virtual Private Server Market Revenue (Million), by Country 2024 & 2032
- Figure 88: Latin America Virtual Private Server Market Volume (K Unit), by Country 2024 & 2032
- Figure 89: Latin America Virtual Private Server Market Revenue Share (%), by Country 2024 & 2032
- Figure 90: Latin America Virtual Private Server Market Volume Share (%), by Country 2024 & 2032
- Figure 91: Middle East and Africa Virtual Private Server Market Revenue (Million), by Operating System 2024 & 2032
- Figure 92: Middle East and Africa Virtual Private Server Market Volume (K Unit), by Operating System 2024 & 2032
- Figure 93: Middle East and Africa Virtual Private Server Market Revenue Share (%), by Operating System 2024 & 2032
- Figure 94: Middle East and Africa Virtual Private Server Market Volume Share (%), by Operating System 2024 & 2032
- Figure 95: Middle East and Africa Virtual Private Server Market Revenue (Million), by Organization Size 2024 & 2032
- Figure 96: Middle East and Africa Virtual Private Server Market Volume (K Unit), by Organization Size 2024 & 2032
- Figure 97: Middle East and Africa Virtual Private Server Market Revenue Share (%), by Organization Size 2024 & 2032
- Figure 98: Middle East and Africa Virtual Private Server Market Volume Share (%), by Organization Size 2024 & 2032
- Figure 99: Middle East and Africa Virtual Private Server Market Revenue (Million), by End-user Vertical 2024 & 2032
- Figure 100: Middle East and Africa Virtual Private Server Market Volume (K Unit), by End-user Vertical 2024 & 2032
- Figure 101: Middle East and Africa Virtual Private Server Market Revenue Share (%), by End-user Vertical 2024 & 2032
- Figure 102: Middle East and Africa Virtual Private Server Market Volume Share (%), by End-user Vertical 2024 & 2032
- Figure 103: Middle East and Africa Virtual Private Server Market Revenue (Million), by Country 2024 & 2032
- Figure 104: Middle East and Africa Virtual Private Server Market Volume (K Unit), by Country 2024 & 2032
- Figure 105: Middle East and Africa Virtual Private Server Market Revenue Share (%), by Country 2024 & 2032
- Figure 106: Middle East and Africa Virtual Private Server Market Volume Share (%), by Country 2024 & 2032
List of Tables
- Table 1: Global Virtual Private Server Market Revenue Million Forecast, by Region 2019 & 2032
- Table 2: Global Virtual Private Server Market Volume K Unit Forecast, by Region 2019 & 2032
- Table 3: Global Virtual Private Server Market Revenue Million Forecast, by Operating System 2019 & 2032
- Table 4: Global Virtual Private Server Market Volume K Unit Forecast, by Operating System 2019 & 2032
- Table 5: Global Virtual Private Server Market Revenue Million Forecast, by Organization Size 2019 & 2032
- Table 6: Global Virtual Private Server Market Volume K Unit Forecast, by Organization Size 2019 & 2032
- Table 7: Global Virtual Private Server Market Revenue Million Forecast, by End-user Vertical 2019 & 2032
- Table 8: Global Virtual Private Server Market Volume K Unit Forecast, by End-user Vertical 2019 & 2032
- Table 9: Global Virtual Private Server Market Revenue Million Forecast, by Region 2019 & 2032
- Table 10: Global Virtual Private Server Market Volume K Unit Forecast, by Region 2019 & 2032
- Table 11: Global Virtual Private Server Market Revenue Million Forecast, by Country 2019 & 2032
- Table 12: Global Virtual Private Server Market Volume K Unit Forecast, by Country 2019 & 2032
- Table 13: United States Virtual Private Server Market Revenue (Million) Forecast, by Application 2019 & 2032
- Table 14: United States Virtual Private Server Market Volume (K Unit) Forecast, by Application 2019 & 2032
- Table 15: Canada Virtual Private Server Market Revenue (Million) Forecast, by Application 2019 & 2032
- Table 16: Canada Virtual Private Server Market Volume (K Unit) Forecast, by Application 2019 & 2032
- Table 17: Mexico Virtual Private Server Market Revenue (Million) Forecast, by Application 2019 & 2032
- Table 18: Mexico Virtual Private Server Market Volume (K Unit) Forecast, by Application 2019 & 2032
- Table 19: Global Virtual Private Server Market Revenue Million Forecast, by Country 2019 & 2032
- Table 20: Global Virtual Private Server Market Volume K Unit Forecast, by Country 2019 & 2032
- Table 21: Germany Virtual Private Server Market Revenue (Million) Forecast, by Application 2019 & 2032
- Table 22: Germany Virtual Private Server Market Volume (K Unit) Forecast, by Application 2019 & 2032
- Table 23: United Kingdom Virtual Private Server Market Revenue (Million) Forecast, by Application 2019 & 2032
- Table 24: United Kingdom Virtual Private Server Market Volume (K Unit) Forecast, by Application 2019 & 2032
- Table 25: France Virtual Private Server Market Revenue (Million) Forecast, by Application 2019 & 2032
- Table 26: France Virtual Private Server Market Volume (K Unit) Forecast, by Application 2019 & 2032
- Table 27: Spain Virtual Private Server Market Revenue (Million) Forecast, by Application 2019 & 2032
- Table 28: Spain Virtual Private Server Market Volume (K Unit) Forecast, by Application 2019 & 2032
- Table 29: Italy Virtual Private Server Market Revenue (Million) Forecast, by Application 2019 & 2032
- Table 30: Italy Virtual Private Server Market Volume (K Unit) Forecast, by Application 2019 & 2032
- Table 31: Spain Virtual Private Server Market Revenue (Million) Forecast, by Application 2019 & 2032
- Table 32: Spain Virtual Private Server Market Volume (K Unit) Forecast, by Application 2019 & 2032
- Table 33: Belgium Virtual Private Server Market Revenue (Million) Forecast, by Application 2019 & 2032
- Table 34: Belgium Virtual Private Server Market Volume (K Unit) Forecast, by Application 2019 & 2032
- Table 35: Netherland Virtual Private Server Market Revenue (Million) Forecast, by Application 2019 & 2032
- Table 36: Netherland Virtual Private Server Market Volume (K Unit) Forecast, by Application 2019 & 2032
- Table 37: Nordics Virtual Private Server Market Revenue (Million) Forecast, by Application 2019 & 2032
- Table 38: Nordics Virtual Private Server Market Volume (K Unit) Forecast, by Application 2019 & 2032
- Table 39: Rest of Europe Virtual Private Server Market Revenue (Million) Forecast, by Application 2019 & 2032
- Table 40: Rest of Europe Virtual Private Server Market Volume (K Unit) Forecast, by Application 2019 & 2032
- Table 41: Global Virtual Private Server Market Revenue Million Forecast, by Country 2019 & 2032
- Table 42: Global Virtual Private Server Market Volume K Unit Forecast, by Country 2019 & 2032
- Table 43: China Virtual Private Server Market Revenue (Million) Forecast, by Application 2019 & 2032
- Table 44: China Virtual Private Server Market Volume (K Unit) Forecast, by Application 2019 & 2032
- Table 45: Japan Virtual Private Server Market Revenue (Million) Forecast, by Application 2019 & 2032
- Table 46: Japan Virtual Private Server Market Volume (K Unit) Forecast, by Application 2019 & 2032
- Table 47: India Virtual Private Server Market Revenue (Million) Forecast, by Application 2019 & 2032
- Table 48: India Virtual Private Server Market Volume (K Unit) Forecast, by Application 2019 & 2032
- Table 49: South Korea Virtual Private Server Market Revenue (Million) Forecast, by Application 2019 & 2032
- Table 50: South Korea Virtual Private Server Market Volume (K Unit) Forecast, by Application 2019 & 2032
- Table 51: Southeast Asia Virtual Private Server Market Revenue (Million) Forecast, by Application 2019 & 2032
- Table 52: Southeast Asia Virtual Private Server Market Volume (K Unit) Forecast, by Application 2019 & 2032
- Table 53: Australia Virtual Private Server Market Revenue (Million) Forecast, by Application 2019 & 2032
- Table 54: Australia Virtual Private Server Market Volume (K Unit) Forecast, by Application 2019 & 2032
- Table 55: Indonesia Virtual Private Server Market Revenue (Million) Forecast, by Application 2019 & 2032
- Table 56: Indonesia Virtual Private Server Market Volume (K Unit) Forecast, by Application 2019 & 2032
- Table 57: Phillipes Virtual Private Server Market Revenue (Million) Forecast, by Application 2019 & 2032
- Table 58: Phillipes Virtual Private Server Market Volume (K Unit) Forecast, by Application 2019 & 2032
- Table 59: Singapore Virtual Private Server Market Revenue (Million) Forecast, by Application 2019 & 2032
- Table 60: Singapore Virtual Private Server Market Volume (K Unit) Forecast, by Application 2019 & 2032
- Table 61: Thailandc Virtual Private Server Market Revenue (Million) Forecast, by Application 2019 & 2032
- Table 62: Thailandc Virtual Private Server Market Volume (K Unit) Forecast, by Application 2019 & 2032
- Table 63: Rest of Asia Pacific Virtual Private Server Market Revenue (Million) Forecast, by Application 2019 & 2032
- Table 64: Rest of Asia Pacific Virtual Private Server Market Volume (K Unit) Forecast, by Application 2019 & 2032
- Table 65: Global Virtual Private Server Market Revenue Million Forecast, by Country 2019 & 2032
- Table 66: Global Virtual Private Server Market Volume K Unit Forecast, by Country 2019 & 2032
- Table 67: Brazil Virtual Private Server Market Revenue (Million) Forecast, by Application 2019 & 2032
- Table 68: Brazil Virtual Private Server Market Volume (K Unit) Forecast, by Application 2019 & 2032
- Table 69: Argentina Virtual Private Server Market Revenue (Million) Forecast, by Application 2019 & 2032
- Table 70: Argentina Virtual Private Server Market Volume (K Unit) Forecast, by Application 2019 & 2032
- Table 71: Peru Virtual Private Server Market Revenue (Million) Forecast, by Application 2019 & 2032
- Table 72: Peru Virtual Private Server Market Volume (K Unit) Forecast, by Application 2019 & 2032
- Table 73: Chile Virtual Private Server Market Revenue (Million) Forecast, by Application 2019 & 2032
- Table 74: Chile Virtual Private Server Market Volume (K Unit) Forecast, by Application 2019 & 2032
- Table 75: Colombia Virtual Private Server Market Revenue (Million) Forecast, by Application 2019 & 2032
- Table 76: Colombia Virtual Private Server Market Volume (K Unit) Forecast, by Application 2019 & 2032
- Table 77: Ecuador Virtual Private Server Market Revenue (Million) Forecast, by Application 2019 & 2032
- Table 78: Ecuador Virtual Private Server Market Volume (K Unit) Forecast, by Application 2019 & 2032
- Table 79: Venezuela Virtual Private Server Market Revenue (Million) Forecast, by Application 2019 & 2032
- Table 80: Venezuela Virtual Private Server Market Volume (K Unit) Forecast, by Application 2019 & 2032
- Table 81: Rest of South America Virtual Private Server Market Revenue (Million) Forecast, by Application 2019 & 2032
- Table 82: Rest of South America Virtual Private Server Market Volume (K Unit) Forecast, by Application 2019 & 2032
- Table 83: Global Virtual Private Server Market Revenue Million Forecast, by Country 2019 & 2032
- Table 84: Global Virtual Private Server Market Volume K Unit Forecast, by Country 2019 & 2032
- Table 85: United States Virtual Private Server Market Revenue (Million) Forecast, by Application 2019 & 2032
- Table 86: United States Virtual Private Server Market Volume (K Unit) Forecast, by Application 2019 & 2032
- Table 87: Canada Virtual Private Server Market Revenue (Million) Forecast, by Application 2019 & 2032
- Table 88: Canada Virtual Private Server Market Volume (K Unit) Forecast, by Application 2019 & 2032
- Table 89: Mexico Virtual Private Server Market Revenue (Million) Forecast, by Application 2019 & 2032
- Table 90: Mexico Virtual Private Server Market Volume (K Unit) Forecast, by Application 2019 & 2032
- Table 91: Global Virtual Private Server Market Revenue Million Forecast, by Country 2019 & 2032
- Table 92: Global Virtual Private Server Market Volume K Unit Forecast, by Country 2019 & 2032
- Table 93: United Arab Emirates Virtual Private Server Market Revenue (Million) Forecast, by Application 2019 & 2032
- Table 94: United Arab Emirates Virtual Private Server Market Volume (K Unit) Forecast, by Application 2019 & 2032
- Table 95: Saudi Arabia Virtual Private Server Market Revenue (Million) Forecast, by Application 2019 & 2032
- Table 96: Saudi Arabia Virtual Private Server Market Volume (K Unit) Forecast, by Application 2019 & 2032
- Table 97: South Africa Virtual Private Server Market Revenue (Million) Forecast, by Application 2019 & 2032
- Table 98: South Africa Virtual Private Server Market Volume (K Unit) Forecast, by Application 2019 & 2032
- Table 99: Rest of Middle East and Africa Virtual Private Server Market Revenue (Million) Forecast, by Application 2019 & 2032
- Table 100: Rest of Middle East and Africa Virtual Private Server Market Volume (K Unit) Forecast, by Application 2019 & 2032
- Table 101: Global Virtual Private Server Market Revenue Million Forecast, by Operating System 2019 & 2032
- Table 102: Global Virtual Private Server Market Volume K Unit Forecast, by Operating System 2019 & 2032
- Table 103: Global Virtual Private Server Market Revenue Million Forecast, by Organization Size 2019 & 2032
- Table 104: Global Virtual Private Server Market Volume K Unit Forecast, by Organization Size 2019 & 2032
- Table 105: Global Virtual Private Server Market Revenue Million Forecast, by End-user Vertical 2019 & 2032
- Table 106: Global Virtual Private Server Market Volume K Unit Forecast, by End-user Vertical 2019 & 2032
- Table 107: Global Virtual Private Server Market Revenue Million Forecast, by Country 2019 & 2032
- Table 108: Global Virtual Private Server Market Volume K Unit Forecast, by Country 2019 & 2032
- Table 109: Global Virtual Private Server Market Revenue Million Forecast, by Operating System 2019 & 2032
- Table 110: Global Virtual Private Server Market Volume K Unit Forecast, by Operating System 2019 & 2032
- Table 111: Global Virtual Private Server Market Revenue Million Forecast, by Organization Size 2019 & 2032
- Table 112: Global Virtual Private Server Market Volume K Unit Forecast, by Organization Size 2019 & 2032
- Table 113: Global Virtual Private Server Market Revenue Million Forecast, by End-user Vertical 2019 & 2032
- Table 114: Global Virtual Private Server Market Volume K Unit Forecast, by End-user Vertical 2019 & 2032
- Table 115: Global Virtual Private Server Market Revenue Million Forecast, by Country 2019 & 2032
- Table 116: Global Virtual Private Server Market Volume K Unit Forecast, by Country 2019 & 2032
- Table 117: Global Virtual Private Server Market Revenue Million Forecast, by Operating System 2019 & 2032
- Table 118: Global Virtual Private Server Market Volume K Unit Forecast, by Operating System 2019 & 2032
- Table 119: Global Virtual Private Server Market Revenue Million Forecast, by Organization Size 2019 & 2032
- Table 120: Global Virtual Private Server Market Volume K Unit Forecast, by Organization Size 2019 & 2032
- Table 121: Global Virtual Private Server Market Revenue Million Forecast, by End-user Vertical 2019 & 2032
- Table 122: Global Virtual Private Server Market Volume K Unit Forecast, by End-user Vertical 2019 & 2032
- Table 123: Global Virtual Private Server Market Revenue Million Forecast, by Country 2019 & 2032
- Table 124: Global Virtual Private Server Market Volume K Unit Forecast, by Country 2019 & 2032
- Table 125: Global Virtual Private Server Market Revenue Million Forecast, by Operating System 2019 & 2032
- Table 126: Global Virtual Private Server Market Volume K Unit Forecast, by Operating System 2019 & 2032
- Table 127: Global Virtual Private Server Market Revenue Million Forecast, by Organization Size 2019 & 2032
- Table 128: Global Virtual Private Server Market Volume K Unit Forecast, by Organization Size 2019 & 2032
- Table 129: Global Virtual Private Server Market Revenue Million Forecast, by End-user Vertical 2019 & 2032
- Table 130: Global Virtual Private Server Market Volume K Unit Forecast, by End-user Vertical 2019 & 2032
- Table 131: Global Virtual Private Server Market Revenue Million Forecast, by Country 2019 & 2032
- Table 132: Global Virtual Private Server Market Volume K Unit Forecast, by Country 2019 & 2032
- Table 133: Global Virtual Private Server Market Revenue Million Forecast, by Operating System 2019 & 2032
- Table 134: Global Virtual Private Server Market Volume K Unit Forecast, by Operating System 2019 & 2032
- Table 135: Global Virtual Private Server Market Revenue Million Forecast, by Organization Size 2019 & 2032
- Table 136: Global Virtual Private Server Market Volume K Unit Forecast, by Organization Size 2019 & 2032
- Table 137: Global Virtual Private Server Market Revenue Million Forecast, by End-user Vertical 2019 & 2032
- Table 138: Global Virtual Private Server Market Volume K Unit Forecast, by End-user Vertical 2019 & 2032
- Table 139: Global Virtual Private Server Market Revenue Million Forecast, by Country 2019 & 2032
- Table 140: Global Virtual Private Server Market Volume K Unit Forecast, by Country 2019 & 2032
Frequently Asked Questions
1. What is the projected Compound Annual Growth Rate (CAGR) of the Virtual Private Server Market?
The projected CAGR is approximately 17.10%.
2. Which companies are prominent players in the Virtual Private Server Market?
Key companies in the market include Plesk International GmbH, Linode LLC, Liquid Web LLC, United Internet AG, GoDaddy Inc, OVH Group, InMotion Hosting, A2 Hosting Inc, Amazon Web Services Inc, Tektonic Inc, DreamHost LLC, Endurance International Group, Vultr Holdings Corporation, Rackspace Inc, DigitalOcean Inc.
3. What are the main segments of the Virtual Private Server Market?
The market segments include Operating System, Organization Size, End-user Vertical .
4. Can you provide details about the market size?
The market size is estimated to be USD XX Million as of 2022.
5. What are some drivers contributing to market growth?
Rising Security Concerns Among Enterprises; Increased Customization. Scalability. and Downtime; Greater Control with VPS than Shared Hosting.
6. What are the notable trends driving market growth?
Surge in the count of Small and Medium-sized enterprises (SMEs) and rise in the trend of BYOD is expected to drive the market..
7. Are there any restraints impacting market growth?
Limited Efficiency Compared to Shared Hosting. Dedicated Hosting. and Cloud Servers.
8. Can you provide examples of recent developments in the market?
February 2023: Dell announced the forthcoming availability of a new line of PowerEdge servers powered by 4th Generation Xeon scalable processors and new partnerships with cloud networking providers and hardware makers for private 5G networks. The new PowerEdge server models are the XR8000, XR7620, and XR5610. They are mainly designed with modularity and scalability, making deploying and maintaining them easy, even under challenging conditions.
9. What pricing options are available for accessing the report?
Pricing options include single-user, multi-user, and enterprise licenses priced at USD 4750, USD 5250, and USD 8750 respectively.
10. Is the market size provided in terms of value or volume?
The market size is provided in terms of value, measured in Million and volume, measured in K Unit.
11. Are there any specific market keywords associated with the report?
Yes, the market keyword associated with the report is "Virtual Private Server Market," which aids in identifying and referencing the specific market segment covered.
12. How do I determine which pricing option suits my needs best?
The pricing options vary based on user requirements and access needs. Individual users may opt for single-user licenses, while businesses requiring broader access may choose multi-user or enterprise licenses for cost-effective access to the report.
13. Are there any additional resources or data provided in the Virtual Private Server Market report?
While the report offers comprehensive insights, it's advisable to review the specific contents or supplementary materials provided to ascertain if additional resources or data are available.
14. How can I stay updated on further developments or reports in the Virtual Private Server Market?
To stay informed about further developments, trends, and reports in the Virtual Private Server Market, consider subscribing to industry newsletters, following relevant companies and organizations, or regularly checking reputable industry news sources and publications.
Methodology
Step 1 - Identification of Relevant Samples Size from Population Database


Step 2 - Approaches for Defining Global Market Size (Value, Volume* & Price*)

Note*: In applicable scenarios
Step 3 - Data Sources
Primary Research
- Web Analytics
- Survey Reports
- Research Institute
- Latest Research Reports
- Opinion Leaders
Secondary Research
- Annual Reports
- White Paper
- Latest Press Release
- Industry Association
- Paid Database
- Investor Presentations

Step 4 - Data Triangulation
Involves using different sources of information in order to increase the validity of a study
These sources are likely to be stakeholders in a program - participants, other researchers, program staff, other community members, and so on.
Then we put all data in single framework & apply various statistical tools to find out the dynamic on the market.
During the analysis stage, feedback from the stakeholder groups would be compared to determine areas of agreement as well as areas of divergence
