

Key Insights
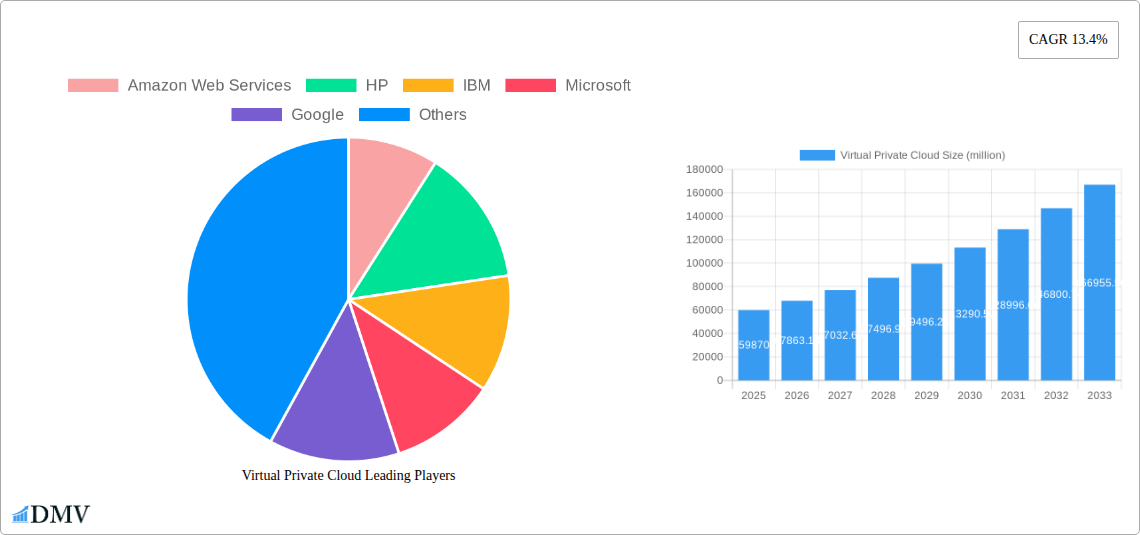
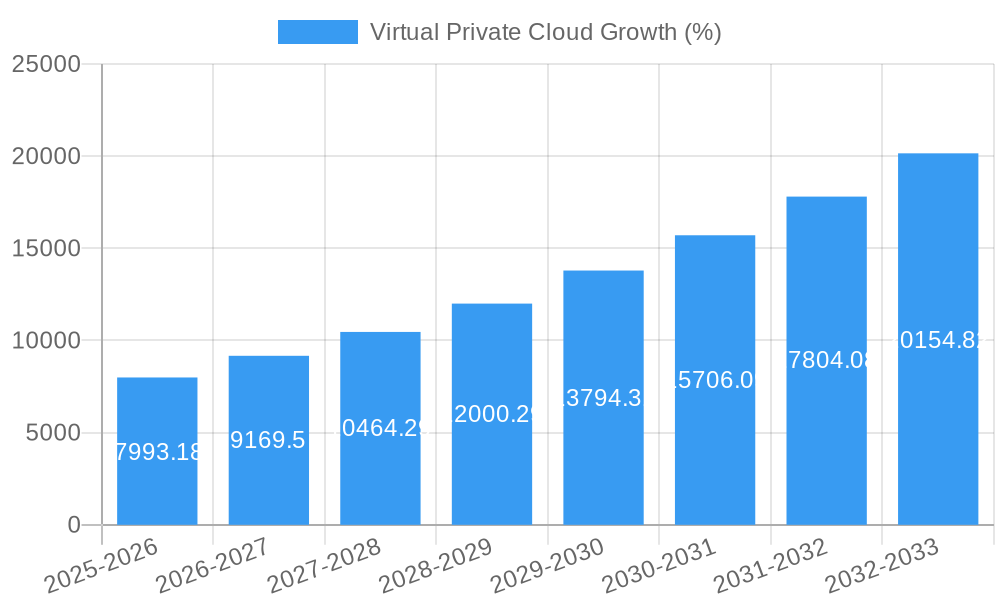
The Virtual Private Cloud (VPC) market, currently valued at approximately $59.87 billion in 2025, is experiencing robust growth, projected to maintain a Compound Annual Growth Rate (CAGR) of 13.4% from 2025 to 2033. This expansion is driven by several key factors. The increasing adoption of cloud computing across various industries, fueled by the need for enhanced scalability, flexibility, and cost-effectiveness, is a primary driver. Furthermore, stringent data security and compliance regulations are compelling organizations to migrate sensitive data to the secure and isolated environments offered by VPCs. Growing demand for hybrid and multi-cloud strategies, enabling businesses to leverage the benefits of multiple cloud providers, further contributes to the market's growth. The rise of sophisticated threat landscapes necessitates robust security solutions, and VPCs are increasingly recognized as a critical component in bolstering enterprise cybersecurity. Technological advancements, such as improved network virtualization and enhanced management tools, are also contributing to the market's expansion.
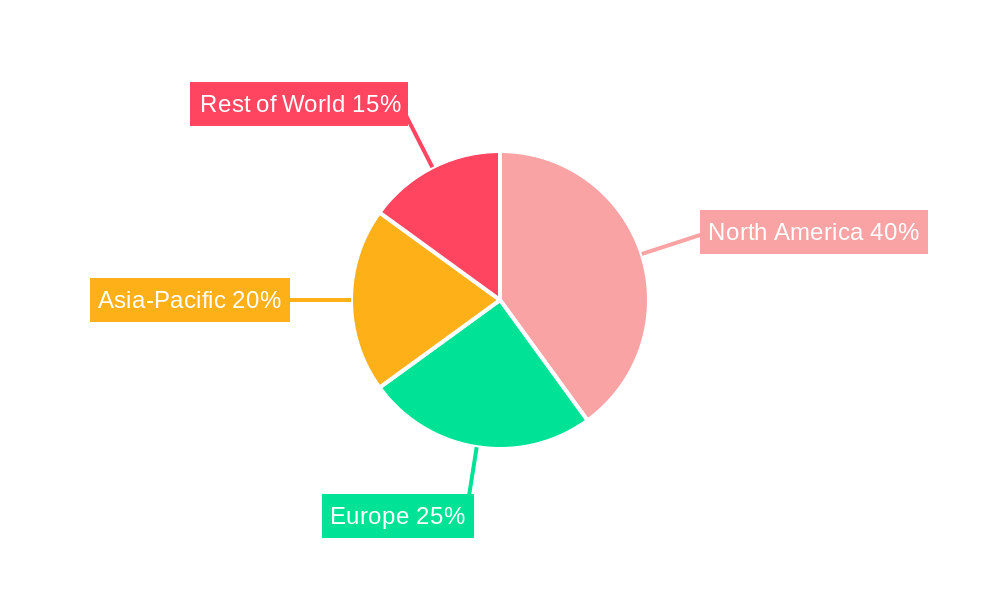
Major players like Amazon Web Services (AWS), Microsoft Azure, Google Cloud Platform (GCP), and others are actively driving innovation and competition within the VPC space, leading to continuous improvements in service offerings and pricing models. However, the market faces certain restraints, including the complexity of VPC configurations and management, potentially requiring specialized skills and expertise. Concerns regarding vendor lock-in and the need for robust integration with existing on-premises infrastructure can also pose challenges for adoption. Despite these challenges, the long-term outlook for the VPC market remains positive, propelled by the continued digitization of businesses and the growing demand for secure and scalable cloud solutions. The market is expected to witness significant expansion across various regions, particularly in North America and Asia-Pacific, driven by higher cloud adoption rates and robust digital transformation initiatives.
Virtual Private Cloud (VPC) Market Report: A Comprehensive Analysis (2019-2033)
This comprehensive report delivers an in-depth analysis of the Virtual Private Cloud (VPC) market, projecting a market value exceeding $XX million by 2033. The study period covers 2019-2033, with 2025 serving as both the base and estimated year, and the forecast period spanning 2025-2033. This report provides crucial insights for stakeholders, investors, and businesses navigating the dynamic landscape of cloud computing.
Virtual Private Cloud Market Composition & Trends
The global Virtual Private Cloud market is characterized by intense competition among major players like Amazon Web Services (Amazon Web Services), HP, IBM (IBM), Microsoft (Microsoft), Google (Google), VMware (VMware), Oracle (Oracle), Cisco Systems (Cisco Systems), Red Hat (Red Hat), and NetApp (NetApp). Market concentration is moderate, with the top five players holding an estimated 65% market share in 2025. Innovation is driven by advancements in containerization, serverless computing, and enhanced security features. The regulatory landscape varies across regions, influencing data sovereignty and compliance requirements. Substitute products include dedicated servers and on-premise solutions, but VPC's scalability and cost-effectiveness provide a significant advantage. End-user profiles span various industries, from finance and healthcare to retail and manufacturing. M&A activity has been significant, with over $XX million in deals recorded between 2019 and 2024, primarily focused on enhancing technology portfolios and expanding market reach.
- Market Share Distribution (2025): AWS (30%), Microsoft (15%), Google (10%), VMware (5%), Others (40%).
- M&A Deal Value (2019-2024): $XX million.
- Key Innovation Catalysts: Containerization, Serverless Computing, Enhanced Security.
Virtual Private Cloud Industry Evolution
The Virtual Private Cloud market has experienced phenomenal growth, exceeding XX million in 2024 and projected to reach XX million by 2033, representing a Compound Annual Growth Rate (CAGR) of XX%. This growth is fueled by several factors. Technological advancements, such as the rise of edge computing and AI-powered security solutions, have significantly improved VPC performance and reliability. Simultaneously, shifting consumer demands towards greater agility, scalability, and cost-efficiency have driven widespread adoption. Businesses increasingly leverage VPCs for disaster recovery, application development, and data analytics. The adoption rate among small and medium-sized enterprises (SMEs) has also been remarkable, surpassing XX% in 2024. This indicates a healthy and sustainable growth trajectory for the foreseeable future, with substantial opportunities across various market segments and geographic regions. The increasing integration of VPC with other cloud services and the emergence of hybrid cloud models further bolster market growth.
Leading Regions, Countries, or Segments in Virtual Private Cloud
North America currently dominates the VPC market, accounting for approximately 45% of global revenue in 2025. This leadership is driven by several key factors:
- High Technological Adoption: Early adoption of cloud technologies and robust digital infrastructure.
- Significant Investments: Substantial investments in R&D and cloud infrastructure by both public and private sectors.
- Strong Regulatory Support: Supportive regulatory environments encouraging cloud adoption across various industries.
Europe and Asia-Pacific follow closely, exhibiting strong growth potential due to increasing digitalization and government initiatives promoting cloud adoption.
Virtual Private Cloud Product Innovations
Recent product innovations focus on enhanced security features, including advanced encryption and access controls, improved scalability through dynamic resource allocation, and seamless integration with other cloud services. These advancements offer unique selling propositions, such as reduced latency, improved performance, and enhanced cost optimization. The adoption of serverless computing and containerization technologies further strengthens the appeal of VPC solutions, providing greater flexibility and efficiency to businesses.
Propelling Factors for Virtual Private Cloud Growth
Technological advancements like serverless computing and AI-powered security are key drivers. Economic factors, such as cost optimization and improved ROI for businesses, are also crucial. Regulatory changes promoting cloud adoption further accelerate market growth. For instance, the increasing adoption of data privacy regulations is driving the need for secure and compliant VPC solutions.
Obstacles in the Virtual Private Cloud Market
Regulatory compliance complexities across different regions pose a significant challenge. Supply chain disruptions impacting hardware availability can create bottlenecks. Intense competition among established players leads to price wars and margin pressures. These factors could collectively impact market growth by approximately XX% in the forecast period.
Future Opportunities in Virtual Private Cloud
Emerging markets in developing economies present significant untapped potential. The integration of VPC with emerging technologies like blockchain and IoT offers exciting new applications. Consumer demand for enhanced security and privacy will drive innovation in these areas.
Major Players in the Virtual Private Cloud Ecosystem
- Amazon Web Services
- HP
- IBM
- Microsoft
- VMware
- Oracle
- Cisco Systems
- Red Hat
- NetApp
Key Developments in Virtual Private Cloud Industry
- 2024 Q4: AWS announces enhanced security features for its VPC service.
- 2025 Q1: Microsoft integrates its VPC offering with its Azure AI platform.
- 2025 Q2: Google launches a new serverless VPC solution.
- 2024 Q3: VMware and a smaller competitor merge, increasing market share.
Strategic Virtual Private Cloud Market Forecast
The VPC market is poised for sustained growth, driven by technological innovation, increasing demand for scalable and secure cloud solutions, and supportive regulatory environments. Continued investment in R&D and strategic partnerships will further fuel market expansion, creating significant opportunities for both established players and new entrants. The market is projected to reach XX million by 2033, presenting a substantial investment opportunity.
Virtual Private Cloud Segmentation
-
1. Application
- 1.1. BFSI
- 1.2. Manufacturing
- 1.3. Healthcare
- 1.4. Media & Entertainment
- 1.5. IT & Telecommunication
- 1.6. Government
- 1.7. Others
-
2. Type
- 2.1. Software
- 2.2. Platform
- 2.3. Infrastructure
- 2.4. Others
Virtual Private Cloud Segmentation By Geography
-
1. North America
- 1.1. United States
- 1.2. Canada
- 1.3. Mexico
-
2. South America
- 2.1. Brazil
- 2.2. Argentina
- 2.3. Rest of South America
-
3. Europe
- 3.1. United Kingdom
- 3.2. Germany
- 3.3. France
- 3.4. Italy
- 3.5. Spain
- 3.6. Russia
- 3.7. Benelux
- 3.8. Nordics
- 3.9. Rest of Europe
-
4. Middle East & Africa
- 4.1. Turkey
- 4.2. Israel
- 4.3. GCC
- 4.4. North Africa
- 4.5. South Africa
- 4.6. Rest of Middle East & Africa
-
5. Asia Pacific
- 5.1. China
- 5.2. India
- 5.3. Japan
- 5.4. South Korea
- 5.5. ASEAN
- 5.6. Oceania
- 5.7. Rest of Asia Pacific
Virtual Private Cloud REPORT HIGHLIGHTS
| Aspects | Details |
|---|---|
| Study Period | 2019-2033 |
| Base Year | 2024 |
| Estimated Year | 2025 |
| Forecast Period | 2025-2033 |
| Historical Period | 2019-2024 |
| Growth Rate | CAGR of 13.4% from 2019-2033 |
| Segmentation |
|
Table of Contents
- 1. Introduction
- 1.1. Research Scope
- 1.2. Market Segmentation
- 1.3. Research Methodology
- 1.4. Definitions and Assumptions
- 2. Executive Summary
- 2.1. Introduction
- 3. Market Dynamics
- 3.1. Introduction
- 3.2. Market Drivers
- 3.3. Market Restrains
- 3.4. Market Trends
- 4. Market Factor Analysis
- 4.1. Porters Five Forces
- 4.2. Supply/Value Chain
- 4.3. PESTEL analysis
- 4.4. Market Entropy
- 4.5. Patent/Trademark Analysis
- 5. Global Virtual Private Cloud Analysis, Insights and Forecast, 2019-2031
- 5.1. Market Analysis, Insights and Forecast - by Application
- 5.1.1. BFSI
- 5.1.2. Manufacturing
- 5.1.3. Healthcare
- 5.1.4. Media & Entertainment
- 5.1.5. IT & Telecommunication
- 5.1.6. Government
- 5.1.7. Others
- 5.2. Market Analysis, Insights and Forecast - by Type
- 5.2.1. Software
- 5.2.2. Platform
- 5.2.3. Infrastructure
- 5.2.4. Others
- 5.3. Market Analysis, Insights and Forecast - by Region
- 5.3.1. North America
- 5.3.2. South America
- 5.3.3. Europe
- 5.3.4. Middle East & Africa
- 5.3.5. Asia Pacific
- 5.1. Market Analysis, Insights and Forecast - by Application
- 6. North America Virtual Private Cloud Analysis, Insights and Forecast, 2019-2031
- 6.1. Market Analysis, Insights and Forecast - by Application
- 6.1.1. BFSI
- 6.1.2. Manufacturing
- 6.1.3. Healthcare
- 6.1.4. Media & Entertainment
- 6.1.5. IT & Telecommunication
- 6.1.6. Government
- 6.1.7. Others
- 6.2. Market Analysis, Insights and Forecast - by Type
- 6.2.1. Software
- 6.2.2. Platform
- 6.2.3. Infrastructure
- 6.2.4. Others
- 6.1. Market Analysis, Insights and Forecast - by Application
- 7. South America Virtual Private Cloud Analysis, Insights and Forecast, 2019-2031
- 7.1. Market Analysis, Insights and Forecast - by Application
- 7.1.1. BFSI
- 7.1.2. Manufacturing
- 7.1.3. Healthcare
- 7.1.4. Media & Entertainment
- 7.1.5. IT & Telecommunication
- 7.1.6. Government
- 7.1.7. Others
- 7.2. Market Analysis, Insights and Forecast - by Type
- 7.2.1. Software
- 7.2.2. Platform
- 7.2.3. Infrastructure
- 7.2.4. Others
- 7.1. Market Analysis, Insights and Forecast - by Application
- 8. Europe Virtual Private Cloud Analysis, Insights and Forecast, 2019-2031
- 8.1. Market Analysis, Insights and Forecast - by Application
- 8.1.1. BFSI
- 8.1.2. Manufacturing
- 8.1.3. Healthcare
- 8.1.4. Media & Entertainment
- 8.1.5. IT & Telecommunication
- 8.1.6. Government
- 8.1.7. Others
- 8.2. Market Analysis, Insights and Forecast - by Type
- 8.2.1. Software
- 8.2.2. Platform
- 8.2.3. Infrastructure
- 8.2.4. Others
- 8.1. Market Analysis, Insights and Forecast - by Application
- 9. Middle East & Africa Virtual Private Cloud Analysis, Insights and Forecast, 2019-2031
- 9.1. Market Analysis, Insights and Forecast - by Application
- 9.1.1. BFSI
- 9.1.2. Manufacturing
- 9.1.3. Healthcare
- 9.1.4. Media & Entertainment
- 9.1.5. IT & Telecommunication
- 9.1.6. Government
- 9.1.7. Others
- 9.2. Market Analysis, Insights and Forecast - by Type
- 9.2.1. Software
- 9.2.2. Platform
- 9.2.3. Infrastructure
- 9.2.4. Others
- 9.1. Market Analysis, Insights and Forecast - by Application
- 10. Asia Pacific Virtual Private Cloud Analysis, Insights and Forecast, 2019-2031
- 10.1. Market Analysis, Insights and Forecast - by Application
- 10.1.1. BFSI
- 10.1.2. Manufacturing
- 10.1.3. Healthcare
- 10.1.4. Media & Entertainment
- 10.1.5. IT & Telecommunication
- 10.1.6. Government
- 10.1.7. Others
- 10.2. Market Analysis, Insights and Forecast - by Type
- 10.2.1. Software
- 10.2.2. Platform
- 10.2.3. Infrastructure
- 10.2.4. Others
- 10.1. Market Analysis, Insights and Forecast - by Application
- 11. Competitive Analysis
- 11.1. Global Market Share Analysis 2024
- 11.2. Company Profiles
- 11.2.1 Amazon Web Services
- 11.2.1.1. Overview
- 11.2.1.2. Products
- 11.2.1.3. SWOT Analysis
- 11.2.1.4. Recent Developments
- 11.2.1.5. Financials (Based on Availability)
- 11.2.2 HP
- 11.2.2.1. Overview
- 11.2.2.2. Products
- 11.2.2.3. SWOT Analysis
- 11.2.2.4. Recent Developments
- 11.2.2.5. Financials (Based on Availability)
- 11.2.3 IBM
- 11.2.3.1. Overview
- 11.2.3.2. Products
- 11.2.3.3. SWOT Analysis
- 11.2.3.4. Recent Developments
- 11.2.3.5. Financials (Based on Availability)
- 11.2.4 Microsoft
- 11.2.4.1. Overview
- 11.2.4.2. Products
- 11.2.4.3. SWOT Analysis
- 11.2.4.4. Recent Developments
- 11.2.4.5. Financials (Based on Availability)
- 11.2.5 Google
- 11.2.5.1. Overview
- 11.2.5.2. Products
- 11.2.5.3. SWOT Analysis
- 11.2.5.4. Recent Developments
- 11.2.5.5. Financials (Based on Availability)
- 11.2.6 VMware
- 11.2.6.1. Overview
- 11.2.6.2. Products
- 11.2.6.3. SWOT Analysis
- 11.2.6.4. Recent Developments
- 11.2.6.5. Financials (Based on Availability)
- 11.2.7 Oracle
- 11.2.7.1. Overview
- 11.2.7.2. Products
- 11.2.7.3. SWOT Analysis
- 11.2.7.4. Recent Developments
- 11.2.7.5. Financials (Based on Availability)
- 11.2.8 Cisco Systems
- 11.2.8.1. Overview
- 11.2.8.2. Products
- 11.2.8.3. SWOT Analysis
- 11.2.8.4. Recent Developments
- 11.2.8.5. Financials (Based on Availability)
- 11.2.9 Red Hat
- 11.2.9.1. Overview
- 11.2.9.2. Products
- 11.2.9.3. SWOT Analysis
- 11.2.9.4. Recent Developments
- 11.2.9.5. Financials (Based on Availability)
- 11.2.10 NetApp
- 11.2.10.1. Overview
- 11.2.10.2. Products
- 11.2.10.3. SWOT Analysis
- 11.2.10.4. Recent Developments
- 11.2.10.5. Financials (Based on Availability)
- 11.2.1 Amazon Web Services
List of Figures
- Figure 1: Global Virtual Private Cloud Revenue Breakdown (million, %) by Region 2024 & 2032
- Figure 2: North America Virtual Private Cloud Revenue (million), by Application 2024 & 2032
- Figure 3: North America Virtual Private Cloud Revenue Share (%), by Application 2024 & 2032
- Figure 4: North America Virtual Private Cloud Revenue (million), by Type 2024 & 2032
- Figure 5: North America Virtual Private Cloud Revenue Share (%), by Type 2024 & 2032
- Figure 6: North America Virtual Private Cloud Revenue (million), by Country 2024 & 2032
- Figure 7: North America Virtual Private Cloud Revenue Share (%), by Country 2024 & 2032
- Figure 8: South America Virtual Private Cloud Revenue (million), by Application 2024 & 2032
- Figure 9: South America Virtual Private Cloud Revenue Share (%), by Application 2024 & 2032
- Figure 10: South America Virtual Private Cloud Revenue (million), by Type 2024 & 2032
- Figure 11: South America Virtual Private Cloud Revenue Share (%), by Type 2024 & 2032
- Figure 12: South America Virtual Private Cloud Revenue (million), by Country 2024 & 2032
- Figure 13: South America Virtual Private Cloud Revenue Share (%), by Country 2024 & 2032
- Figure 14: Europe Virtual Private Cloud Revenue (million), by Application 2024 & 2032
- Figure 15: Europe Virtual Private Cloud Revenue Share (%), by Application 2024 & 2032
- Figure 16: Europe Virtual Private Cloud Revenue (million), by Type 2024 & 2032
- Figure 17: Europe Virtual Private Cloud Revenue Share (%), by Type 2024 & 2032
- Figure 18: Europe Virtual Private Cloud Revenue (million), by Country 2024 & 2032
- Figure 19: Europe Virtual Private Cloud Revenue Share (%), by Country 2024 & 2032
- Figure 20: Middle East & Africa Virtual Private Cloud Revenue (million), by Application 2024 & 2032
- Figure 21: Middle East & Africa Virtual Private Cloud Revenue Share (%), by Application 2024 & 2032
- Figure 22: Middle East & Africa Virtual Private Cloud Revenue (million), by Type 2024 & 2032
- Figure 23: Middle East & Africa Virtual Private Cloud Revenue Share (%), by Type 2024 & 2032
- Figure 24: Middle East & Africa Virtual Private Cloud Revenue (million), by Country 2024 & 2032
- Figure 25: Middle East & Africa Virtual Private Cloud Revenue Share (%), by Country 2024 & 2032
- Figure 26: Asia Pacific Virtual Private Cloud Revenue (million), by Application 2024 & 2032
- Figure 27: Asia Pacific Virtual Private Cloud Revenue Share (%), by Application 2024 & 2032
- Figure 28: Asia Pacific Virtual Private Cloud Revenue (million), by Type 2024 & 2032
- Figure 29: Asia Pacific Virtual Private Cloud Revenue Share (%), by Type 2024 & 2032
- Figure 30: Asia Pacific Virtual Private Cloud Revenue (million), by Country 2024 & 2032
- Figure 31: Asia Pacific Virtual Private Cloud Revenue Share (%), by Country 2024 & 2032
List of Tables
- Table 1: Global Virtual Private Cloud Revenue million Forecast, by Region 2019 & 2032
- Table 2: Global Virtual Private Cloud Revenue million Forecast, by Application 2019 & 2032
- Table 3: Global Virtual Private Cloud Revenue million Forecast, by Type 2019 & 2032
- Table 4: Global Virtual Private Cloud Revenue million Forecast, by Region 2019 & 2032
- Table 5: Global Virtual Private Cloud Revenue million Forecast, by Application 2019 & 2032
- Table 6: Global Virtual Private Cloud Revenue million Forecast, by Type 2019 & 2032
- Table 7: Global Virtual Private Cloud Revenue million Forecast, by Country 2019 & 2032
- Table 8: United States Virtual Private Cloud Revenue (million) Forecast, by Application 2019 & 2032
- Table 9: Canada Virtual Private Cloud Revenue (million) Forecast, by Application 2019 & 2032
- Table 10: Mexico Virtual Private Cloud Revenue (million) Forecast, by Application 2019 & 2032
- Table 11: Global Virtual Private Cloud Revenue million Forecast, by Application 2019 & 2032
- Table 12: Global Virtual Private Cloud Revenue million Forecast, by Type 2019 & 2032
- Table 13: Global Virtual Private Cloud Revenue million Forecast, by Country 2019 & 2032
- Table 14: Brazil Virtual Private Cloud Revenue (million) Forecast, by Application 2019 & 2032
- Table 15: Argentina Virtual Private Cloud Revenue (million) Forecast, by Application 2019 & 2032
- Table 16: Rest of South America Virtual Private Cloud Revenue (million) Forecast, by Application 2019 & 2032
- Table 17: Global Virtual Private Cloud Revenue million Forecast, by Application 2019 & 2032
- Table 18: Global Virtual Private Cloud Revenue million Forecast, by Type 2019 & 2032
- Table 19: Global Virtual Private Cloud Revenue million Forecast, by Country 2019 & 2032
- Table 20: United Kingdom Virtual Private Cloud Revenue (million) Forecast, by Application 2019 & 2032
- Table 21: Germany Virtual Private Cloud Revenue (million) Forecast, by Application 2019 & 2032
- Table 22: France Virtual Private Cloud Revenue (million) Forecast, by Application 2019 & 2032
- Table 23: Italy Virtual Private Cloud Revenue (million) Forecast, by Application 2019 & 2032
- Table 24: Spain Virtual Private Cloud Revenue (million) Forecast, by Application 2019 & 2032
- Table 25: Russia Virtual Private Cloud Revenue (million) Forecast, by Application 2019 & 2032
- Table 26: Benelux Virtual Private Cloud Revenue (million) Forecast, by Application 2019 & 2032
- Table 27: Nordics Virtual Private Cloud Revenue (million) Forecast, by Application 2019 & 2032
- Table 28: Rest of Europe Virtual Private Cloud Revenue (million) Forecast, by Application 2019 & 2032
- Table 29: Global Virtual Private Cloud Revenue million Forecast, by Application 2019 & 2032
- Table 30: Global Virtual Private Cloud Revenue million Forecast, by Type 2019 & 2032
- Table 31: Global Virtual Private Cloud Revenue million Forecast, by Country 2019 & 2032
- Table 32: Turkey Virtual Private Cloud Revenue (million) Forecast, by Application 2019 & 2032
- Table 33: Israel Virtual Private Cloud Revenue (million) Forecast, by Application 2019 & 2032
- Table 34: GCC Virtual Private Cloud Revenue (million) Forecast, by Application 2019 & 2032
- Table 35: North Africa Virtual Private Cloud Revenue (million) Forecast, by Application 2019 & 2032
- Table 36: South Africa Virtual Private Cloud Revenue (million) Forecast, by Application 2019 & 2032
- Table 37: Rest of Middle East & Africa Virtual Private Cloud Revenue (million) Forecast, by Application 2019 & 2032
- Table 38: Global Virtual Private Cloud Revenue million Forecast, by Application 2019 & 2032
- Table 39: Global Virtual Private Cloud Revenue million Forecast, by Type 2019 & 2032
- Table 40: Global Virtual Private Cloud Revenue million Forecast, by Country 2019 & 2032
- Table 41: China Virtual Private Cloud Revenue (million) Forecast, by Application 2019 & 2032
- Table 42: India Virtual Private Cloud Revenue (million) Forecast, by Application 2019 & 2032
- Table 43: Japan Virtual Private Cloud Revenue (million) Forecast, by Application 2019 & 2032
- Table 44: South Korea Virtual Private Cloud Revenue (million) Forecast, by Application 2019 & 2032
- Table 45: ASEAN Virtual Private Cloud Revenue (million) Forecast, by Application 2019 & 2032
- Table 46: Oceania Virtual Private Cloud Revenue (million) Forecast, by Application 2019 & 2032
- Table 47: Rest of Asia Pacific Virtual Private Cloud Revenue (million) Forecast, by Application 2019 & 2032
Frequently Asked Questions
1. What is the projected Compound Annual Growth Rate (CAGR) of the Virtual Private Cloud?
The projected CAGR is approximately 13.4%.
2. Which companies are prominent players in the Virtual Private Cloud?
Key companies in the market include Amazon Web Services, HP, IBM, Microsoft, Google, VMware, Oracle, Cisco Systems, Red Hat, NetApp.
3. What are the main segments of the Virtual Private Cloud?
The market segments include Application, Type.
4. Can you provide details about the market size?
The market size is estimated to be USD 59870 million as of 2022.
5. What are some drivers contributing to market growth?
N/A
6. What are the notable trends driving market growth?
N/A
7. Are there any restraints impacting market growth?
N/A
8. Can you provide examples of recent developments in the market?
N/A
9. What pricing options are available for accessing the report?
Pricing options include single-user, multi-user, and enterprise licenses priced at USD 3950.00, USD 5925.00, and USD 7900.00 respectively.
10. Is the market size provided in terms of value or volume?
The market size is provided in terms of value, measured in million.
11. Are there any specific market keywords associated with the report?
Yes, the market keyword associated with the report is "Virtual Private Cloud," which aids in identifying and referencing the specific market segment covered.
12. How do I determine which pricing option suits my needs best?
The pricing options vary based on user requirements and access needs. Individual users may opt for single-user licenses, while businesses requiring broader access may choose multi-user or enterprise licenses for cost-effective access to the report.
13. Are there any additional resources or data provided in the Virtual Private Cloud report?
While the report offers comprehensive insights, it's advisable to review the specific contents or supplementary materials provided to ascertain if additional resources or data are available.
14. How can I stay updated on further developments or reports in the Virtual Private Cloud?
To stay informed about further developments, trends, and reports in the Virtual Private Cloud, consider subscribing to industry newsletters, following relevant companies and organizations, or regularly checking reputable industry news sources and publications.
Methodology
Step 1 - Identification of Relevant Samples Size from Population Database


Step 2 - Approaches for Defining Global Market Size (Value, Volume* & Price*)

Note*: In applicable scenarios
Step 3 - Data Sources
Primary Research
- Web Analytics
- Survey Reports
- Research Institute
- Latest Research Reports
- Opinion Leaders
Secondary Research
- Annual Reports
- White Paper
- Latest Press Release
- Industry Association
- Paid Database
- Investor Presentations

Step 4 - Data Triangulation
Involves using different sources of information in order to increase the validity of a study
These sources are likely to be stakeholders in a program - participants, other researchers, program staff, other community members, and so on.
Then we put all data in single framework & apply various statistical tools to find out the dynamic on the market.
During the analysis stage, feedback from the stakeholder groups would be compared to determine areas of agreement as well as areas of divergence
