

Key Insights
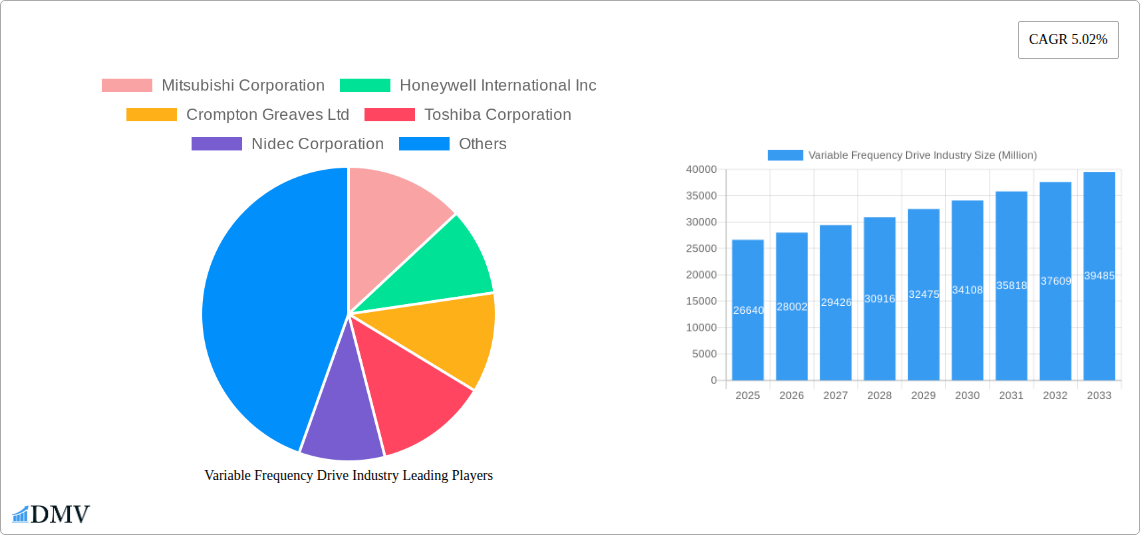
The Variable Frequency Drive (VFD) market, valued at $26.64 billion in 2025, is projected to experience robust growth, driven by increasing automation across diverse industries and a rising focus on energy efficiency. A Compound Annual Growth Rate (CAGR) of 5.02% from 2025 to 2033 indicates a significant market expansion. Key drivers include the escalating demand for precise motor speed control in industrial automation, the growing adoption of VFDs in renewable energy applications (particularly wind and solar power), and stringent government regulations aimed at reducing energy consumption. The market is segmented by voltage type (low, medium, and high voltage) and end-user industry (infrastructure, food processing, energy and power, mining and metals, pulp and paper, and others). The infrastructure sector, with its extensive use of motors in building management systems and HVAC applications, is expected to be a major growth contributor. Furthermore, the increasing adoption of smart grids and the modernization of existing power infrastructure will further fuel VFD market expansion. Technological advancements, such as the development of more efficient and compact VFDs, and the integration of advanced features like predictive maintenance capabilities, are also contributing to market growth. While the initial investment cost of VFDs can be a restraint, the long-term energy savings and improved operational efficiency often outweigh this factor, leading to strong adoption rates across diverse sectors. Competition is intense, with major players like Mitsubishi, Honeywell, Siemens, and ABB vying for market share through technological innovation, strategic partnerships, and geographical expansion.
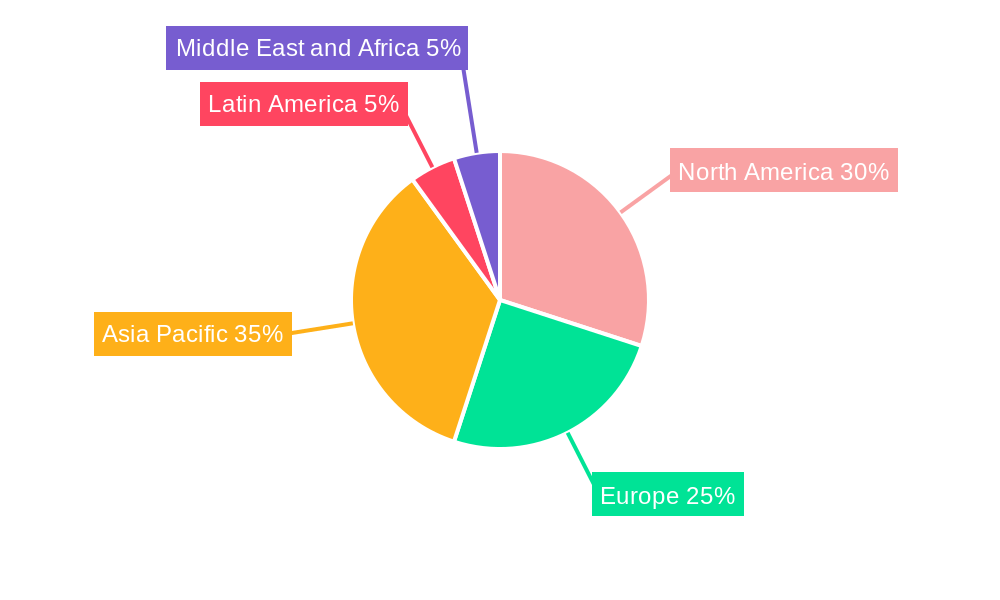
The Asia-Pacific region, particularly China and India, is anticipated to dominate the VFD market owing to rapid industrialization and infrastructural development. North America and Europe are also significant markets, characterized by high adoption rates in various sectors. However, these established markets are likely to witness a more moderate growth rate compared to the emerging economies in Asia-Pacific. The ongoing focus on sustainable development and the drive towards Industry 4.0 will further strengthen the demand for VFDs in the coming years. This sustained growth is expected to attract new entrants, leading to increased competition and potentially driving down prices, making VFD technology increasingly accessible across various market segments. The ongoing need for energy-efficient solutions and the continuous advancements in VFD technology will ensure the sustained growth of this crucial market segment.
Variable Frequency Drive (VFD) Industry Market Report: 2019-2033
This comprehensive report provides an in-depth analysis of the Variable Frequency Drive (VFD) industry, offering invaluable insights for stakeholders seeking to understand market dynamics, growth trajectories, and future opportunities. The report covers the period 2019-2033, with a focus on the 2025-2033 forecast period. The market is valued at xx Million in 2025 and is projected to reach xx Million by 2033, demonstrating significant growth potential.
Variable Frequency Drive Industry Market Composition & Trends
This section delves into the intricate landscape of the VFD market, examining market concentration, innovation drivers, regulatory frameworks, substitute products, and end-user profiles. The analysis includes a detailed assessment of mergers and acquisitions (M&A) activity, providing a comprehensive overview of market forces.
- Market Concentration: The VFD market is moderately concentrated, with key players like ABB Ltd, ABB Ltd (GE Industrial), Danfoss AS, Eaton Corporation, Honeywell International Inc, Hitachi Group, Mitsubishi Corporation, Nidec Corporation, Rockwell Automations Inc, Schneider Electric SE, Siemens AG, and Toshiba Corporation holding significant market share. The precise distribution is detailed in the full report. The market share for each company is estimated to be between xx% and xx% based on 2025 revenue.
- Innovation Catalysts: Ongoing advancements in power electronics, particularly the development of high-efficiency silicon carbide (SiC) and gallium nitride (GaN) semiconductors, drive innovation and improved energy efficiency in VFDs.
- Regulatory Landscape: Stringent energy efficiency regulations globally are pushing the adoption of VFDs across various industries.
- Substitute Products: While few direct substitutes exist, alternative motor control methods such as mechanical speed controls and other power electronic-based drives exist, but these face limitations in terms of efficiency and precision.
- End-User Profiles: Key end-user segments include infrastructure, food processing, energy and power, mining and metals, pulp and paper, and other industries. The full report provides a detailed breakdown of each segment's contribution.
- M&A Activity: The VFD market has witnessed significant M&A activity in recent years, with deal values totaling xx Million between 2019 and 2024. Specific examples of transactions and their impacts are included in the report.
Variable Frequency Drive Industry Industry Evolution
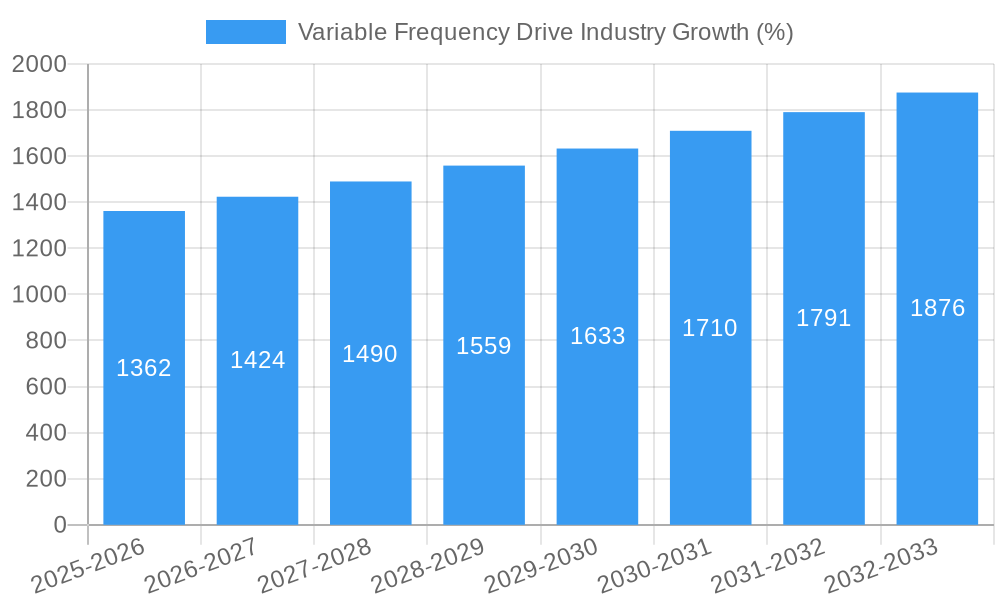
This section analyzes the historical and projected growth of the VFD market, highlighting technological advancements and shifts in consumer demands. The VFD market has experienced a Compound Annual Growth Rate (CAGR) of xx% from 2019 to 2024, driven by increasing industrial automation and energy efficiency mandates. Technological advancements such as the integration of smart sensors, predictive maintenance capabilities, and improved communication protocols are revolutionizing the industry. The rising demand for energy-efficient solutions across various end-user industries, coupled with the increasing adoption of Industry 4.0 technologies, continues to fuel market growth. Adoption rates are expected to accelerate further in the forecast period (2025-2033) driven by government incentives for renewable energy, industrial growth in developing markets, and digitalization efforts. The report projects a CAGR of xx% from 2025 to 2033. Specific details, including regional adoption rates and technological penetration levels, are provided in the full report.
Leading Regions, Countries, or Segments in Variable Frequency Drive Industry
This section identifies the dominant regions, countries, and segments within the VFD market.
- By Voltage Type: The low-voltage segment currently holds the largest market share, driven by its wide applicability in various industrial and commercial settings. However, the medium and high-voltage segments are experiencing significant growth, fueled by large-scale industrial applications and renewable energy projects.
- By End-user Industry: The infrastructure segment is currently the leading end-user industry for VFDs, followed closely by the energy and power sector. Growth in both segments is expected to continue, supported by large-scale infrastructure development and the expanding renewable energy market.
Key Drivers:
- Infrastructure: Massive investments in infrastructure projects globally, particularly in developing economies, are driving strong demand for VFDs.
- Energy and Power: The increasing adoption of renewable energy sources, particularly wind and solar power, necessitates the use of efficient power management solutions like VFDs.
- Government Regulations: Stringent energy efficiency standards and regulations are incentivizing the adoption of VFDs to reduce energy consumption and carbon emissions.
The full report provides detailed regional and segmental breakdowns, including market size, growth forecasts, and key industry players.
Variable Frequency Drive Industry Product Innovations
Recent innovations in VFDs focus on enhancing energy efficiency, improving reliability, and simplifying installation and maintenance. Manufacturers are incorporating advanced features like built-in communication capabilities for seamless integration with industrial automation systems and predictive maintenance algorithms for proactive monitoring and fault detection. These improvements reduce downtime and optimize operational costs, thereby enhancing the value proposition of VFDs in various applications.
Propelling Factors for Variable Frequency Drive Industry Growth
Several factors are driving the growth of the VFD industry. These include the increasing demand for energy-efficient solutions across diverse sectors, ongoing advancements in power electronics and control technologies, stringent government regulations promoting energy conservation, and the rise of industrial automation and smart manufacturing. The increasing adoption of renewable energy sources further fuels market growth, as VFDs play a crucial role in optimizing the performance and efficiency of renewable energy systems.
Obstacles in the Variable Frequency Drive Industry Market
The VFD market faces some challenges. Fluctuations in raw material prices and supply chain disruptions can impact production costs and lead times. Intense competition among established players and the emergence of new entrants can create pricing pressures. Furthermore, the complexity of VFD technology and the need for specialized expertise in installation and maintenance can hinder widespread adoption in certain segments. These challenges are further analyzed with quantifiable impacts in the full report.
Future Opportunities in Variable Frequency Drive Industry
The VFD market presents significant future opportunities. The expansion of industrial automation and smart manufacturing, particularly in developing economies, will create substantial demand for advanced VFD systems. The growing adoption of renewable energy sources and electric vehicles will also fuel market growth. Furthermore, the development of next-generation power electronics technologies, such as SiC and GaN-based VFDs, will open up new possibilities for enhanced efficiency and performance.
Major Players in the Variable Frequency Drive Industry Ecosystem
- Mitsubishi Corporation
- Honeywell International Inc
- Crompton Greaves Ltd
- Toshiba Corporation
- Nidec Corporation
- Siemens AG
- Schneider Electric SE
- Johnson Controls Inc
- Danfoss AS
- Rockwell Automations Inc
- Hitachi Group
- ABB Ltd (GE Industrial)
- Eaton Corporation
Key Developments in Variable Frequency Drive Industry Industry
- February 2022: Mitsubishi Electric Corporation announced a new half-bridge driver high-voltage (600V) integrated circuit (HVIC) for low-capacity inverter systems, enhancing efficiency in various applications.
- April 2022: Rockwell Automation Inc. launched the Allen-Bradley Armor Powerflex AC VFD, featuring simplified commissioning, predictive maintenance, and faster installation, reducing costs for industrial companies.
Strategic Variable Frequency Drive Industry Market Forecast
The VFD market is poised for robust growth, driven by technological advancements, increasing industrial automation, and a global push towards energy efficiency. The expanding adoption of renewable energy and electric vehicles will further stimulate demand. The integration of smart technologies, such as AI and IoT, will create new opportunities for enhanced VFD performance and operational efficiency. The market is expected to witness significant expansion across various regions and end-user segments, presenting substantial growth potential for key players in the coming years.
Variable Frequency Drive Industry Segmentation
-
1. Voltage Type
- 1.1. Low Voltage
- 1.2. Medium and High Voltage
-
2. End-user Industry
- 2.1. Infrastructure
- 2.2. Food Processing
- 2.3. Energy and Power
- 2.4. Mining and Metals
- 2.5. Pulp and Paper
- 2.6. Other End-user Industries
Variable Frequency Drive Industry Segmentation By Geography
-
1. North America
- 1.1. United States
- 1.2. Canada
-
2. Europe
- 2.1. United Kingdom
- 2.2. Germany
- 2.3. France
- 2.4. Rest of Europe
-
3. Asia Pacific
- 3.1. China
- 3.2. India
- 3.3. Japan
- 3.4. Rest of the Asia Pacific
- 4. Latin America
- 5. Middle East and Africa
Variable Frequency Drive Industry REPORT HIGHLIGHTS
| Aspects | Details |
|---|---|
| Study Period | 2019-2033 |
| Base Year | 2024 |
| Estimated Year | 2025 |
| Forecast Period | 2025-2033 |
| Historical Period | 2019-2024 |
| Growth Rate | CAGR of 5.02% from 2019-2033 |
| Segmentation |
|
Table of Contents
- 1. Introduction
- 1.1. Research Scope
- 1.2. Market Segmentation
- 1.3. Research Methodology
- 1.4. Definitions and Assumptions
- 2. Executive Summary
- 2.1. Introduction
- 3. Market Dynamics
- 3.1. Introduction
- 3.2. Market Drivers
- 3.2.1. Rapid Industrialization and Increased Use of VFDs across Major Vertical Industries; Growing Demand for Energy Efficiency
- 3.3. Market Restrains
- 3.3.1. Technical Concerns of the Equipment; High Cost of the Equipment; Cybersecurity Apprehensions
- 3.4. Market Trends
- 3.4.1. Rapid Industrialization and Increased Use of VFDs Across Major Vertical Industries to Drive the Market
- 4. Market Factor Analysis
- 4.1. Porters Five Forces
- 4.2. Supply/Value Chain
- 4.3. PESTEL analysis
- 4.4. Market Entropy
- 4.5. Patent/Trademark Analysis
- 5. Global Variable Frequency Drive Industry Analysis, Insights and Forecast, 2019-2031
- 5.1. Market Analysis, Insights and Forecast - by Voltage Type
- 5.1.1. Low Voltage
- 5.1.2. Medium and High Voltage
- 5.2. Market Analysis, Insights and Forecast - by End-user Industry
- 5.2.1. Infrastructure
- 5.2.2. Food Processing
- 5.2.3. Energy and Power
- 5.2.4. Mining and Metals
- 5.2.5. Pulp and Paper
- 5.2.6. Other End-user Industries
- 5.3. Market Analysis, Insights and Forecast - by Region
- 5.3.1. North America
- 5.3.2. Europe
- 5.3.3. Asia Pacific
- 5.3.4. Latin America
- 5.3.5. Middle East and Africa
- 5.1. Market Analysis, Insights and Forecast - by Voltage Type
- 6. North America Variable Frequency Drive Industry Analysis, Insights and Forecast, 2019-2031
- 6.1. Market Analysis, Insights and Forecast - by Voltage Type
- 6.1.1. Low Voltage
- 6.1.2. Medium and High Voltage
- 6.2. Market Analysis, Insights and Forecast - by End-user Industry
- 6.2.1. Infrastructure
- 6.2.2. Food Processing
- 6.2.3. Energy and Power
- 6.2.4. Mining and Metals
- 6.2.5. Pulp and Paper
- 6.2.6. Other End-user Industries
- 6.1. Market Analysis, Insights and Forecast - by Voltage Type
- 7. Europe Variable Frequency Drive Industry Analysis, Insights and Forecast, 2019-2031
- 7.1. Market Analysis, Insights and Forecast - by Voltage Type
- 7.1.1. Low Voltage
- 7.1.2. Medium and High Voltage
- 7.2. Market Analysis, Insights and Forecast - by End-user Industry
- 7.2.1. Infrastructure
- 7.2.2. Food Processing
- 7.2.3. Energy and Power
- 7.2.4. Mining and Metals
- 7.2.5. Pulp and Paper
- 7.2.6. Other End-user Industries
- 7.1. Market Analysis, Insights and Forecast - by Voltage Type
- 8. Asia Pacific Variable Frequency Drive Industry Analysis, Insights and Forecast, 2019-2031
- 8.1. Market Analysis, Insights and Forecast - by Voltage Type
- 8.1.1. Low Voltage
- 8.1.2. Medium and High Voltage
- 8.2. Market Analysis, Insights and Forecast - by End-user Industry
- 8.2.1. Infrastructure
- 8.2.2. Food Processing
- 8.2.3. Energy and Power
- 8.2.4. Mining and Metals
- 8.2.5. Pulp and Paper
- 8.2.6. Other End-user Industries
- 8.1. Market Analysis, Insights and Forecast - by Voltage Type
- 9. Latin America Variable Frequency Drive Industry Analysis, Insights and Forecast, 2019-2031
- 9.1. Market Analysis, Insights and Forecast - by Voltage Type
- 9.1.1. Low Voltage
- 9.1.2. Medium and High Voltage
- 9.2. Market Analysis, Insights and Forecast - by End-user Industry
- 9.2.1. Infrastructure
- 9.2.2. Food Processing
- 9.2.3. Energy and Power
- 9.2.4. Mining and Metals
- 9.2.5. Pulp and Paper
- 9.2.6. Other End-user Industries
- 9.1. Market Analysis, Insights and Forecast - by Voltage Type
- 10. Middle East and Africa Variable Frequency Drive Industry Analysis, Insights and Forecast, 2019-2031
- 10.1. Market Analysis, Insights and Forecast - by Voltage Type
- 10.1.1. Low Voltage
- 10.1.2. Medium and High Voltage
- 10.2. Market Analysis, Insights and Forecast - by End-user Industry
- 10.2.1. Infrastructure
- 10.2.2. Food Processing
- 10.2.3. Energy and Power
- 10.2.4. Mining and Metals
- 10.2.5. Pulp and Paper
- 10.2.6. Other End-user Industries
- 10.1. Market Analysis, Insights and Forecast - by Voltage Type
- 11. North America Variable Frequency Drive Industry Analysis, Insights and Forecast, 2019-2031
- 11.1. Market Analysis, Insights and Forecast - By Country/Sub-region
- 11.1.1 United States
- 11.1.2 Canada
- 12. Europe Variable Frequency Drive Industry Analysis, Insights and Forecast, 2019-2031
- 12.1. Market Analysis, Insights and Forecast - By Country/Sub-region
- 12.1.1 United Kingdom
- 12.1.2 Germany
- 12.1.3 France
- 12.1.4 Rest of Europe
- 13. Asia Pacific Variable Frequency Drive Industry Analysis, Insights and Forecast, 2019-2031
- 13.1. Market Analysis, Insights and Forecast - By Country/Sub-region
- 13.1.1 China
- 13.1.2 India
- 13.1.3 Japan
- 13.1.4 Rest of Asia Pacific
- 14. Latin America Variable Frequency Drive Industry Analysis, Insights and Forecast, 2019-2031
- 14.1. Market Analysis, Insights and Forecast - By Country/Sub-region
- 14.1.1.
- 15. Middle East and Africa Variable Frequency Drive Industry Analysis, Insights and Forecast, 2019-2031
- 15.1. Market Analysis, Insights and Forecast - By Country/Sub-region
- 15.1.1.
- 16. Competitive Analysis
- 16.1. Global Market Share Analysis 2024
- 16.2. Company Profiles
- 16.2.1 Mitsubishi Corporation
- 16.2.1.1. Overview
- 16.2.1.2. Products
- 16.2.1.3. SWOT Analysis
- 16.2.1.4. Recent Developments
- 16.2.1.5. Financials (Based on Availability)
- 16.2.2 Honeywell International Inc
- 16.2.2.1. Overview
- 16.2.2.2. Products
- 16.2.2.3. SWOT Analysis
- 16.2.2.4. Recent Developments
- 16.2.2.5. Financials (Based on Availability)
- 16.2.3 Crompton Greaves Ltd
- 16.2.3.1. Overview
- 16.2.3.2. Products
- 16.2.3.3. SWOT Analysis
- 16.2.3.4. Recent Developments
- 16.2.3.5. Financials (Based on Availability)
- 16.2.4 Toshiba Corporation
- 16.2.4.1. Overview
- 16.2.4.2. Products
- 16.2.4.3. SWOT Analysis
- 16.2.4.4. Recent Developments
- 16.2.4.5. Financials (Based on Availability)
- 16.2.5 Nidec Corporation
- 16.2.5.1. Overview
- 16.2.5.2. Products
- 16.2.5.3. SWOT Analysis
- 16.2.5.4. Recent Developments
- 16.2.5.5. Financials (Based on Availability)
- 16.2.6 Siemens AG
- 16.2.6.1. Overview
- 16.2.6.2. Products
- 16.2.6.3. SWOT Analysis
- 16.2.6.4. Recent Developments
- 16.2.6.5. Financials (Based on Availability)
- 16.2.7 Schneider Electric SE
- 16.2.7.1. Overview
- 16.2.7.2. Products
- 16.2.7.3. SWOT Analysis
- 16.2.7.4. Recent Developments
- 16.2.7.5. Financials (Based on Availability)
- 16.2.8 Johnson Controls Inc
- 16.2.8.1. Overview
- 16.2.8.2. Products
- 16.2.8.3. SWOT Analysis
- 16.2.8.4. Recent Developments
- 16.2.8.5. Financials (Based on Availability)
- 16.2.9 Danfoss AS
- 16.2.9.1. Overview
- 16.2.9.2. Products
- 16.2.9.3. SWOT Analysis
- 16.2.9.4. Recent Developments
- 16.2.9.5. Financials (Based on Availability)
- 16.2.10 Rockwell Automations Inc
- 16.2.10.1. Overview
- 16.2.10.2. Products
- 16.2.10.3. SWOT Analysis
- 16.2.10.4. Recent Developments
- 16.2.10.5. Financials (Based on Availability)
- 16.2.11 Hitachi Group
- 16.2.11.1. Overview
- 16.2.11.2. Products
- 16.2.11.3. SWOT Analysis
- 16.2.11.4. Recent Developments
- 16.2.11.5. Financials (Based on Availability)
- 16.2.12 ABB Ltd (GE Industrial)
- 16.2.12.1. Overview
- 16.2.12.2. Products
- 16.2.12.3. SWOT Analysis
- 16.2.12.4. Recent Developments
- 16.2.12.5. Financials (Based on Availability)
- 16.2.13 Eaton Corporation
- 16.2.13.1. Overview
- 16.2.13.2. Products
- 16.2.13.3. SWOT Analysis
- 16.2.13.4. Recent Developments
- 16.2.13.5. Financials (Based on Availability)
- 16.2.1 Mitsubishi Corporation
List of Figures
- Figure 1: Global Variable Frequency Drive Industry Revenue Breakdown (Million, %) by Region 2024 & 2032
- Figure 2: North America Variable Frequency Drive Industry Revenue (Million), by Country 2024 & 2032
- Figure 3: North America Variable Frequency Drive Industry Revenue Share (%), by Country 2024 & 2032
- Figure 4: Europe Variable Frequency Drive Industry Revenue (Million), by Country 2024 & 2032
- Figure 5: Europe Variable Frequency Drive Industry Revenue Share (%), by Country 2024 & 2032
- Figure 6: Asia Pacific Variable Frequency Drive Industry Revenue (Million), by Country 2024 & 2032
- Figure 7: Asia Pacific Variable Frequency Drive Industry Revenue Share (%), by Country 2024 & 2032
- Figure 8: Latin America Variable Frequency Drive Industry Revenue (Million), by Country 2024 & 2032
- Figure 9: Latin America Variable Frequency Drive Industry Revenue Share (%), by Country 2024 & 2032
- Figure 10: Middle East and Africa Variable Frequency Drive Industry Revenue (Million), by Country 2024 & 2032
- Figure 11: Middle East and Africa Variable Frequency Drive Industry Revenue Share (%), by Country 2024 & 2032
- Figure 12: North America Variable Frequency Drive Industry Revenue (Million), by Voltage Type 2024 & 2032
- Figure 13: North America Variable Frequency Drive Industry Revenue Share (%), by Voltage Type 2024 & 2032
- Figure 14: North America Variable Frequency Drive Industry Revenue (Million), by End-user Industry 2024 & 2032
- Figure 15: North America Variable Frequency Drive Industry Revenue Share (%), by End-user Industry 2024 & 2032
- Figure 16: North America Variable Frequency Drive Industry Revenue (Million), by Country 2024 & 2032
- Figure 17: North America Variable Frequency Drive Industry Revenue Share (%), by Country 2024 & 2032
- Figure 18: Europe Variable Frequency Drive Industry Revenue (Million), by Voltage Type 2024 & 2032
- Figure 19: Europe Variable Frequency Drive Industry Revenue Share (%), by Voltage Type 2024 & 2032
- Figure 20: Europe Variable Frequency Drive Industry Revenue (Million), by End-user Industry 2024 & 2032
- Figure 21: Europe Variable Frequency Drive Industry Revenue Share (%), by End-user Industry 2024 & 2032
- Figure 22: Europe Variable Frequency Drive Industry Revenue (Million), by Country 2024 & 2032
- Figure 23: Europe Variable Frequency Drive Industry Revenue Share (%), by Country 2024 & 2032
- Figure 24: Asia Pacific Variable Frequency Drive Industry Revenue (Million), by Voltage Type 2024 & 2032
- Figure 25: Asia Pacific Variable Frequency Drive Industry Revenue Share (%), by Voltage Type 2024 & 2032
- Figure 26: Asia Pacific Variable Frequency Drive Industry Revenue (Million), by End-user Industry 2024 & 2032
- Figure 27: Asia Pacific Variable Frequency Drive Industry Revenue Share (%), by End-user Industry 2024 & 2032
- Figure 28: Asia Pacific Variable Frequency Drive Industry Revenue (Million), by Country 2024 & 2032
- Figure 29: Asia Pacific Variable Frequency Drive Industry Revenue Share (%), by Country 2024 & 2032
- Figure 30: Latin America Variable Frequency Drive Industry Revenue (Million), by Voltage Type 2024 & 2032
- Figure 31: Latin America Variable Frequency Drive Industry Revenue Share (%), by Voltage Type 2024 & 2032
- Figure 32: Latin America Variable Frequency Drive Industry Revenue (Million), by End-user Industry 2024 & 2032
- Figure 33: Latin America Variable Frequency Drive Industry Revenue Share (%), by End-user Industry 2024 & 2032
- Figure 34: Latin America Variable Frequency Drive Industry Revenue (Million), by Country 2024 & 2032
- Figure 35: Latin America Variable Frequency Drive Industry Revenue Share (%), by Country 2024 & 2032
- Figure 36: Middle East and Africa Variable Frequency Drive Industry Revenue (Million), by Voltage Type 2024 & 2032
- Figure 37: Middle East and Africa Variable Frequency Drive Industry Revenue Share (%), by Voltage Type 2024 & 2032
- Figure 38: Middle East and Africa Variable Frequency Drive Industry Revenue (Million), by End-user Industry 2024 & 2032
- Figure 39: Middle East and Africa Variable Frequency Drive Industry Revenue Share (%), by End-user Industry 2024 & 2032
- Figure 40: Middle East and Africa Variable Frequency Drive Industry Revenue (Million), by Country 2024 & 2032
- Figure 41: Middle East and Africa Variable Frequency Drive Industry Revenue Share (%), by Country 2024 & 2032
List of Tables
- Table 1: Global Variable Frequency Drive Industry Revenue Million Forecast, by Region 2019 & 2032
- Table 2: Global Variable Frequency Drive Industry Revenue Million Forecast, by Voltage Type 2019 & 2032
- Table 3: Global Variable Frequency Drive Industry Revenue Million Forecast, by End-user Industry 2019 & 2032
- Table 4: Global Variable Frequency Drive Industry Revenue Million Forecast, by Region 2019 & 2032
- Table 5: Global Variable Frequency Drive Industry Revenue Million Forecast, by Country 2019 & 2032
- Table 6: United States Variable Frequency Drive Industry Revenue (Million) Forecast, by Application 2019 & 2032
- Table 7: Canada Variable Frequency Drive Industry Revenue (Million) Forecast, by Application 2019 & 2032
- Table 8: Global Variable Frequency Drive Industry Revenue Million Forecast, by Country 2019 & 2032
- Table 9: United Kingdom Variable Frequency Drive Industry Revenue (Million) Forecast, by Application 2019 & 2032
- Table 10: Germany Variable Frequency Drive Industry Revenue (Million) Forecast, by Application 2019 & 2032
- Table 11: France Variable Frequency Drive Industry Revenue (Million) Forecast, by Application 2019 & 2032
- Table 12: Rest of Europe Variable Frequency Drive Industry Revenue (Million) Forecast, by Application 2019 & 2032
- Table 13: Global Variable Frequency Drive Industry Revenue Million Forecast, by Country 2019 & 2032
- Table 14: China Variable Frequency Drive Industry Revenue (Million) Forecast, by Application 2019 & 2032
- Table 15: India Variable Frequency Drive Industry Revenue (Million) Forecast, by Application 2019 & 2032
- Table 16: Japan Variable Frequency Drive Industry Revenue (Million) Forecast, by Application 2019 & 2032
- Table 17: Rest of Asia Pacific Variable Frequency Drive Industry Revenue (Million) Forecast, by Application 2019 & 2032
- Table 18: Global Variable Frequency Drive Industry Revenue Million Forecast, by Country 2019 & 2032
- Table 19: Variable Frequency Drive Industry Revenue (Million) Forecast, by Application 2019 & 2032
- Table 20: Global Variable Frequency Drive Industry Revenue Million Forecast, by Country 2019 & 2032
- Table 21: Variable Frequency Drive Industry Revenue (Million) Forecast, by Application 2019 & 2032
- Table 22: Global Variable Frequency Drive Industry Revenue Million Forecast, by Voltage Type 2019 & 2032
- Table 23: Global Variable Frequency Drive Industry Revenue Million Forecast, by End-user Industry 2019 & 2032
- Table 24: Global Variable Frequency Drive Industry Revenue Million Forecast, by Country 2019 & 2032
- Table 25: United States Variable Frequency Drive Industry Revenue (Million) Forecast, by Application 2019 & 2032
- Table 26: Canada Variable Frequency Drive Industry Revenue (Million) Forecast, by Application 2019 & 2032
- Table 27: Global Variable Frequency Drive Industry Revenue Million Forecast, by Voltage Type 2019 & 2032
- Table 28: Global Variable Frequency Drive Industry Revenue Million Forecast, by End-user Industry 2019 & 2032
- Table 29: Global Variable Frequency Drive Industry Revenue Million Forecast, by Country 2019 & 2032
- Table 30: United Kingdom Variable Frequency Drive Industry Revenue (Million) Forecast, by Application 2019 & 2032
- Table 31: Germany Variable Frequency Drive Industry Revenue (Million) Forecast, by Application 2019 & 2032
- Table 32: France Variable Frequency Drive Industry Revenue (Million) Forecast, by Application 2019 & 2032
- Table 33: Rest of Europe Variable Frequency Drive Industry Revenue (Million) Forecast, by Application 2019 & 2032
- Table 34: Global Variable Frequency Drive Industry Revenue Million Forecast, by Voltage Type 2019 & 2032
- Table 35: Global Variable Frequency Drive Industry Revenue Million Forecast, by End-user Industry 2019 & 2032
- Table 36: Global Variable Frequency Drive Industry Revenue Million Forecast, by Country 2019 & 2032
- Table 37: China Variable Frequency Drive Industry Revenue (Million) Forecast, by Application 2019 & 2032
- Table 38: India Variable Frequency Drive Industry Revenue (Million) Forecast, by Application 2019 & 2032
- Table 39: Japan Variable Frequency Drive Industry Revenue (Million) Forecast, by Application 2019 & 2032
- Table 40: Rest of the Asia Pacific Variable Frequency Drive Industry Revenue (Million) Forecast, by Application 2019 & 2032
- Table 41: Global Variable Frequency Drive Industry Revenue Million Forecast, by Voltage Type 2019 & 2032
- Table 42: Global Variable Frequency Drive Industry Revenue Million Forecast, by End-user Industry 2019 & 2032
- Table 43: Global Variable Frequency Drive Industry Revenue Million Forecast, by Country 2019 & 2032
- Table 44: Global Variable Frequency Drive Industry Revenue Million Forecast, by Voltage Type 2019 & 2032
- Table 45: Global Variable Frequency Drive Industry Revenue Million Forecast, by End-user Industry 2019 & 2032
- Table 46: Global Variable Frequency Drive Industry Revenue Million Forecast, by Country 2019 & 2032
Frequently Asked Questions
1. What is the projected Compound Annual Growth Rate (CAGR) of the Variable Frequency Drive Industry?
The projected CAGR is approximately 5.02%.
2. Which companies are prominent players in the Variable Frequency Drive Industry?
Key companies in the market include Mitsubishi Corporation, Honeywell International Inc, Crompton Greaves Ltd, Toshiba Corporation, Nidec Corporation, Siemens AG, Schneider Electric SE, Johnson Controls Inc, Danfoss AS, Rockwell Automations Inc, Hitachi Group, ABB Ltd (GE Industrial), Eaton Corporation.
3. What are the main segments of the Variable Frequency Drive Industry?
The market segments include Voltage Type, End-user Industry.
4. Can you provide details about the market size?
The market size is estimated to be USD 26.64 Million as of 2022.
5. What are some drivers contributing to market growth?
Rapid Industrialization and Increased Use of VFDs across Major Vertical Industries; Growing Demand for Energy Efficiency.
6. What are the notable trends driving market growth?
Rapid Industrialization and Increased Use of VFDs Across Major Vertical Industries to Drive the Market.
7. Are there any restraints impacting market growth?
Technical Concerns of the Equipment; High Cost of the Equipment; Cybersecurity Apprehensions.
8. Can you provide examples of recent developments in the market?
April 2022 - Rockwell Automation Inc. launched a new Allen-Bradley Armor Powerflex AC VFD for industrial motor control applications. The newly launched on-machine motor drive provides simple commissioning, predictive maintenance, and quicker installation. This drive helps industrial companies to minimize costs and simplify the machine's design and time to deploy.
9. What pricing options are available for accessing the report?
Pricing options include single-user, multi-user, and enterprise licenses priced at USD 4750, USD 5250, and USD 8750 respectively.
10. Is the market size provided in terms of value or volume?
The market size is provided in terms of value, measured in Million.
11. Are there any specific market keywords associated with the report?
Yes, the market keyword associated with the report is "Variable Frequency Drive Industry," which aids in identifying and referencing the specific market segment covered.
12. How do I determine which pricing option suits my needs best?
The pricing options vary based on user requirements and access needs. Individual users may opt for single-user licenses, while businesses requiring broader access may choose multi-user or enterprise licenses for cost-effective access to the report.
13. Are there any additional resources or data provided in the Variable Frequency Drive Industry report?
While the report offers comprehensive insights, it's advisable to review the specific contents or supplementary materials provided to ascertain if additional resources or data are available.
14. How can I stay updated on further developments or reports in the Variable Frequency Drive Industry?
To stay informed about further developments, trends, and reports in the Variable Frequency Drive Industry, consider subscribing to industry newsletters, following relevant companies and organizations, or regularly checking reputable industry news sources and publications.
Methodology
Step 1 - Identification of Relevant Samples Size from Population Database


Step 2 - Approaches for Defining Global Market Size (Value, Volume* & Price*)

Note*: In applicable scenarios
Step 3 - Data Sources
Primary Research
- Web Analytics
- Survey Reports
- Research Institute
- Latest Research Reports
- Opinion Leaders
Secondary Research
- Annual Reports
- White Paper
- Latest Press Release
- Industry Association
- Paid Database
- Investor Presentations

Step 4 - Data Triangulation
Involves using different sources of information in order to increase the validity of a study
These sources are likely to be stakeholders in a program - participants, other researchers, program staff, other community members, and so on.
Then we put all data in single framework & apply various statistical tools to find out the dynamic on the market.
During the analysis stage, feedback from the stakeholder groups would be compared to determine areas of agreement as well as areas of divergence
