

Key Insights
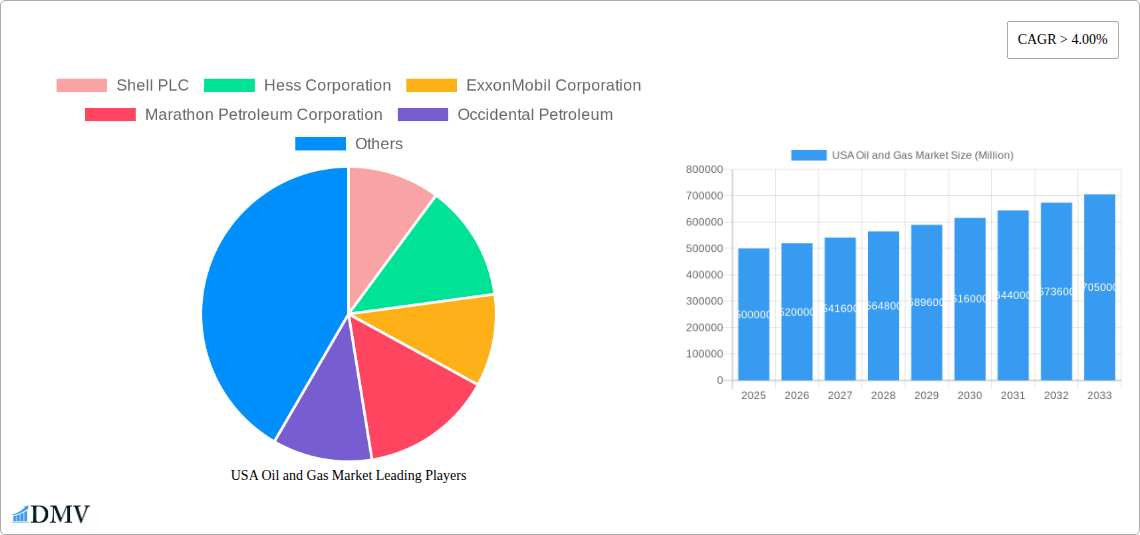
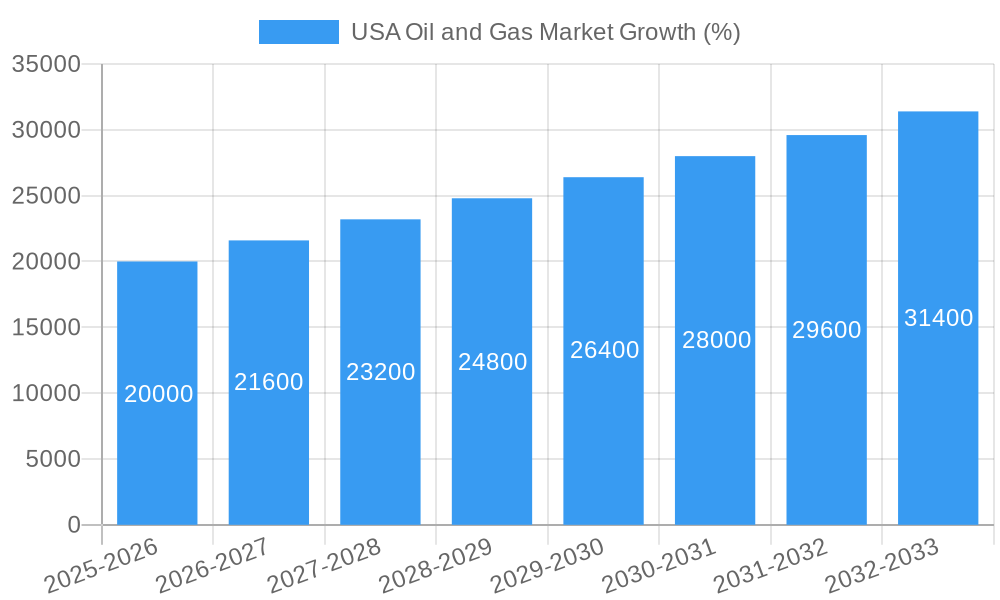
The US oil and gas market, valued at approximately $500 billion in 2025, is projected to experience robust growth, driven by a consistent CAGR exceeding 4% through 2033. This expansion is fueled by several key factors. Increased industrial activity and a growing transportation sector are boosting demand for refined products, while the ongoing transition to cleaner energy sources is creating opportunities for natural gas, which is perceived as a relatively cleaner-burning fossil fuel. Technological advancements in extraction techniques, particularly in shale oil and gas production, are also contributing to increased supply and efficiency. However, the market faces challenges including volatile oil prices, government regulations aimed at reducing carbon emissions, and increasing concerns regarding environmental sustainability. Regional variations are notable, with the Southwest and West benefiting from shale gas production, while the Northeast and Midwest face unique regulatory landscapes and infrastructure limitations. The competitive landscape is dominated by major integrated oil and gas companies like ExxonMobil, Chevron, and ConocoPhillips, along with independent producers specializing in shale resources. These companies are actively investing in both upstream production and downstream refining and distribution to secure their market positions.
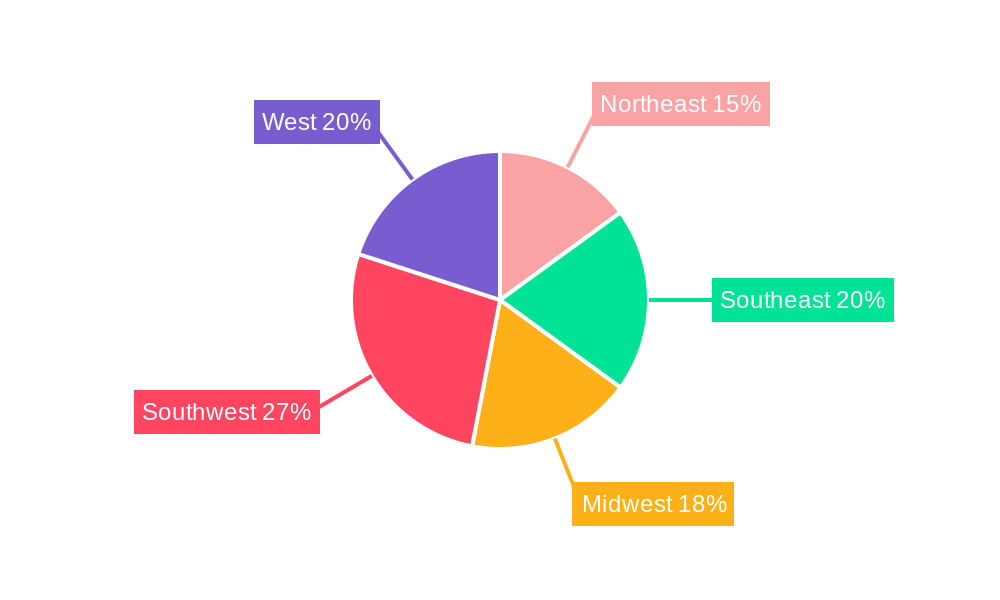
Significant regional disparities exist within the US market. The Southwest and West, known for their shale gas formations, likely command a larger market share than other regions. The Northeast, with its focus on cleaner energy initiatives and tighter environmental regulations, might present a slower growth trajectory compared to other regions. Furthermore, the industrial sector’s energy consumption patterns, which vary across regions, significantly influences the segment-wise market breakdown. The ongoing debate surrounding the balance between economic growth and environmental sustainability will continue to shape the future of the US oil and gas market, influencing both regulatory policies and corporate investment strategies. The increasing emphasis on energy security and the potential for increased domestic production further contribute to the complexities of the market's outlook.
USA Oil and Gas Market: A Comprehensive Report (2019-2033)
This insightful report provides a detailed analysis of the USA Oil and Gas Market, covering the period from 2019 to 2033, with a focus on the 2025-2033 forecast period. It examines market composition, industry evolution, leading segments, product innovations, growth drivers, and challenges, offering a crucial understanding for stakeholders across the energy sector. The report leverages extensive data analysis and expert insights to provide actionable intelligence for strategic decision-making.
USA Oil and Gas Market Composition & Trends
This section delves into the intricate structure of the USA oil and gas market, evaluating key aspects driving its evolution. We analyze market concentration, highlighting the dominance of major players like ExxonMobil Corporation, Chevron Corporation, and ConocoPhillips Company, while also accounting for the roles of Shell PLC, Hess Corporation, Marathon Petroleum Corporation, Occidental Petroleum, Valero Energy, EOG Resources, Total Energies SE, Phillips 66, and BP PLC. The report quantifies market share distribution among these players, identifying any emerging trends towards consolidation or diversification. Furthermore, we assess innovation catalysts, including technological advancements in exploration and extraction, refining processes, and renewable energy integration. The regulatory landscape, encompassing environmental regulations and permitting processes, is thoroughly examined, along with an analysis of substitute products and their impact on market dynamics. Finally, we explore end-user profiles across the industrial, commercial, residential, and transportation sectors, and detail the significant M&A activities within the market, including a quantification of deal values (estimated at xx Million for the period 2019-2024).
- Market Share Distribution (2024): ExxonMobil (xx%), Chevron (xx%), ConocoPhillips (xx%), others (xx%).
- M&A Deal Value (2019-2024): Estimated at xx Million.
- Key Regulatory Changes: Analysis of recent environmental regulations and their impact.
- Substitute Products: Analysis of the impact of renewable energy sources and their market penetration.
USA Oil and Gas Market Industry Evolution
This section provides a comprehensive overview of the historical and projected evolution of the USA oil and gas market. We analyze market growth trajectories from 2019 to 2024, demonstrating a Compound Annual Growth Rate (CAGR) of xx%, driven by factors such as increasing energy demand and technological advancements in extraction techniques like fracking. The report then projects the CAGR for 2025-2033 at xx%, based on anticipated economic growth and policy changes. Technological advancements, including improved drilling techniques, enhanced oil recovery methods, and the integration of digital technologies for optimized operations, are assessed for their impact on efficiency and production. The evolving demands of consumers, with increasing emphasis on energy security and environmental concerns, are also analyzed. We delve into the adoption rates of new technologies, quantifying their contributions to market growth. The analysis also incorporates the influence of geopolitical events, such as the Russia-Ukraine war and its impact on global energy markets.
Leading Regions, Countries, or Segments in USA Oil and Gas Market
The report identifies the dominant regions, countries, and segments within the USA oil and gas market. The analysis highlights the key drivers of growth for each segment, including investment trends and regulatory support. For example, the Permian Basin consistently emerges as a leading region for crude oil production, driven by technological advancements and significant investment. Texas and North Dakota also play crucial roles as major oil-producing states. Similarly, the transportation sector is identified as the largest end-use sector, with its high demand for refined products like gasoline and diesel fuel.
- Crude Oil: Dominated by Texas and North Dakota, driven by technological advancements in extraction.
- Natural Gas: Strong growth in shale gas production regions, fueled by increased demand and infrastructure development.
- Refined Products: Transportation sector as the leading end-use segment, with significant demand for gasoline and diesel.
- Industrial Sector: High demand for energy in manufacturing and industrial processes.
- Commercial Sector: Growing energy consumption driven by economic growth and business activity.
- Residential Sector: Increased heating and electricity demands across the country.
USA Oil and Gas Market Product Innovations
This section highlights recent product innovations in the USA oil and gas market. These include advancements in drilling technology, improved recovery techniques, and the development of cleaner-burning fuels. The unique selling propositions (USPs) of these innovations are analyzed, focusing on their contribution to increased efficiency, reduced environmental impact, and enhanced profitability. Furthermore, we assess the performance metrics of these new products, comparing them to existing technologies.
Propelling Factors for USA Oil and Gas Market Growth
Several factors fuel the growth of the USA oil and gas market. Technological advancements, such as hydraulic fracturing and horizontal drilling, significantly increase extraction efficiency and unlock new reserves. Economic growth drives higher energy demand, particularly in the transportation and industrial sectors. Supportive government policies, including tax incentives and streamlined permitting processes, encourage investment and production. The increasing global demand for energy also provides a significant impetus for production growth.
Obstacles in the USA Oil and Gas Market
Despite positive growth trends, several obstacles challenge the USA oil and gas market. Stringent environmental regulations, aimed at reducing emissions and protecting natural habitats, can increase operational costs and restrict expansion. Supply chain disruptions, caused by geopolitical instability or natural disasters, can impact the availability of crucial equipment and materials. Intense competition among major players can exert downward pressure on prices and profitability. Furthermore, public perception and environmental concerns remain significant challenges.
Future Opportunities in USA Oil and Gas Market
Emerging opportunities for the USA oil and gas market include the expansion of LNG exports, the development of carbon capture and storage technologies, and the growing interest in renewable natural gas. The exploration and development of unconventional resources, coupled with technological advancements in processing and refining, present significant growth prospects. Furthermore, the integration of digital technologies offers potential for optimizing operations and enhancing efficiency.
Major Players in the USA Oil and Gas Market Ecosystem
- Shell PLC
- Hess Corporation
- ExxonMobil Corporation
- Marathon Petroleum Corporation
- Occidental Petroleum
- Chevron Corporation
- ConocoPhillips Company
- Valero Energy
- EOG Resources
- Total Energies SE
- Phillips 66
- BP PLC
Key Developments in USA Oil and Gas Market Industry
- January 2022: The Department of Energy announced the release of 13.4 Million barrels of oil from the Strategic Petroleum Reserve to combat rising gasoline prices. This had a short-term dampening effect on prices but did little to address underlying supply chain issues.
- March 2022: President Biden's energy supply deal with the European Union aimed to increase transatlantic gas deliveries, reducing reliance on Russian energy and boosting US LNG exports. This significantly impacted US gas pricing and export volumes.
Strategic USA Oil and Gas Market Forecast
The USA oil and gas market is poised for continued growth, driven by robust domestic demand and increased global energy security concerns. Technological advancements, strategic investments, and supportive government policies will continue to shape market dynamics. The focus on cleaner energy solutions and the integration of renewable energy sources will influence the long-term trajectory of the market. However, challenges related to environmental regulations and global geopolitical uncertainties need careful consideration for accurate forecasting. The market is expected to show a robust growth potential throughout the forecast period (2025-2033).
USA Oil and Gas Market Segmentation
- 1. Upstream
- 2. Midstream
- 3. Downstream
USA Oil and Gas Market Segmentation By Geography
-
1. North America
- 1.1. United States
- 1.2. Canada
- 1.3. Mexico
-
2. South America
- 2.1. Brazil
- 2.2. Argentina
- 2.3. Rest of South America
-
3. Europe
- 3.1. United Kingdom
- 3.2. Germany
- 3.3. France
- 3.4. Italy
- 3.5. Spain
- 3.6. Russia
- 3.7. Benelux
- 3.8. Nordics
- 3.9. Rest of Europe
-
4. Middle East & Africa
- 4.1. Turkey
- 4.2. Israel
- 4.3. GCC
- 4.4. North Africa
- 4.5. South Africa
- 4.6. Rest of Middle East & Africa
-
5. Asia Pacific
- 5.1. China
- 5.2. India
- 5.3. Japan
- 5.4. South Korea
- 5.5. ASEAN
- 5.6. Oceania
- 5.7. Rest of Asia Pacific
USA Oil and Gas Market REPORT HIGHLIGHTS
| Aspects | Details |
|---|---|
| Study Period | 2019-2033 |
| Base Year | 2024 |
| Estimated Year | 2025 |
| Forecast Period | 2025-2033 |
| Historical Period | 2019-2024 |
| Growth Rate | CAGR of > 4.00% from 2019-2033 |
| Segmentation |
|
Table of Contents
- 1. Introduction
- 1.1. Research Scope
- 1.2. Market Segmentation
- 1.3. Research Methodology
- 1.4. Definitions and Assumptions
- 2. Executive Summary
- 2.1. Introduction
- 3. Market Dynamics
- 3.1. Introduction
- 3.2. Market Drivers
- 3.2.1. 4.; Modernization and Upgrades of Existing Military Aircraft Fleets4.; Increasing Defense Budgets
- 3.3. Market Restrains
- 3.3.1. 4.; Shift Toward Unmanned Aircraft
- 3.4. Market Trends
- 3.4.1. Upstream Sector Expected Witness Significant Growth
- 4. Market Factor Analysis
- 4.1. Porters Five Forces
- 4.2. Supply/Value Chain
- 4.3. PESTEL analysis
- 4.4. Market Entropy
- 4.5. Patent/Trademark Analysis
- 5. Global USA Oil and Gas Market Analysis, Insights and Forecast, 2019-2031
- 5.1. Market Analysis, Insights and Forecast - by Upstream
- 5.2. Market Analysis, Insights and Forecast - by Midstream
- 5.3. Market Analysis, Insights and Forecast - by Downstream
- 5.4. Market Analysis, Insights and Forecast - by Region
- 5.4.1. North America
- 5.4.2. South America
- 5.4.3. Europe
- 5.4.4. Middle East & Africa
- 5.4.5. Asia Pacific
- 5.1. Market Analysis, Insights and Forecast - by Upstream
- 6. North America USA Oil and Gas Market Analysis, Insights and Forecast, 2019-2031
- 6.1. Market Analysis, Insights and Forecast - by Upstream
- 6.2. Market Analysis, Insights and Forecast - by Midstream
- 6.3. Market Analysis, Insights and Forecast - by Downstream
- 6.1. Market Analysis, Insights and Forecast - by Upstream
- 7. South America USA Oil and Gas Market Analysis, Insights and Forecast, 2019-2031
- 7.1. Market Analysis, Insights and Forecast - by Upstream
- 7.2. Market Analysis, Insights and Forecast - by Midstream
- 7.3. Market Analysis, Insights and Forecast - by Downstream
- 7.1. Market Analysis, Insights and Forecast - by Upstream
- 8. Europe USA Oil and Gas Market Analysis, Insights and Forecast, 2019-2031
- 8.1. Market Analysis, Insights and Forecast - by Upstream
- 8.2. Market Analysis, Insights and Forecast - by Midstream
- 8.3. Market Analysis, Insights and Forecast - by Downstream
- 8.1. Market Analysis, Insights and Forecast - by Upstream
- 9. Middle East & Africa USA Oil and Gas Market Analysis, Insights and Forecast, 2019-2031
- 9.1. Market Analysis, Insights and Forecast - by Upstream
- 9.2. Market Analysis, Insights and Forecast - by Midstream
- 9.3. Market Analysis, Insights and Forecast - by Downstream
- 9.1. Market Analysis, Insights and Forecast - by Upstream
- 10. Asia Pacific USA Oil and Gas Market Analysis, Insights and Forecast, 2019-2031
- 10.1. Market Analysis, Insights and Forecast - by Upstream
- 10.2. Market Analysis, Insights and Forecast - by Midstream
- 10.3. Market Analysis, Insights and Forecast - by Downstream
- 10.1. Market Analysis, Insights and Forecast - by Upstream
- 11. Northeast USA Oil and Gas Market Analysis, Insights and Forecast, 2019-2031
- 12. Southeast USA Oil and Gas Market Analysis, Insights and Forecast, 2019-2031
- 13. Midwest USA Oil and Gas Market Analysis, Insights and Forecast, 2019-2031
- 14. Southwest USA Oil and Gas Market Analysis, Insights and Forecast, 2019-2031
- 15. West USA Oil and Gas Market Analysis, Insights and Forecast, 2019-2031
- 16. Competitive Analysis
- 16.1. Global Market Share Analysis 2024
- 16.2. Company Profiles
- 16.2.1 Shell PLC
- 16.2.1.1. Overview
- 16.2.1.2. Products
- 16.2.1.3. SWOT Analysis
- 16.2.1.4. Recent Developments
- 16.2.1.5. Financials (Based on Availability)
- 16.2.2 Hess Corporation
- 16.2.2.1. Overview
- 16.2.2.2. Products
- 16.2.2.3. SWOT Analysis
- 16.2.2.4. Recent Developments
- 16.2.2.5. Financials (Based on Availability)
- 16.2.3 ExxonMobil Corporation
- 16.2.3.1. Overview
- 16.2.3.2. Products
- 16.2.3.3. SWOT Analysis
- 16.2.3.4. Recent Developments
- 16.2.3.5. Financials (Based on Availability)
- 16.2.4 Marathon Petroleum Corporation
- 16.2.4.1. Overview
- 16.2.4.2. Products
- 16.2.4.3. SWOT Analysis
- 16.2.4.4. Recent Developments
- 16.2.4.5. Financials (Based on Availability)
- 16.2.5 Occidental Petroleum
- 16.2.5.1. Overview
- 16.2.5.2. Products
- 16.2.5.3. SWOT Analysis
- 16.2.5.4. Recent Developments
- 16.2.5.5. Financials (Based on Availability)
- 16.2.6 Chevron Corporation
- 16.2.6.1. Overview
- 16.2.6.2. Products
- 16.2.6.3. SWOT Analysis
- 16.2.6.4. Recent Developments
- 16.2.6.5. Financials (Based on Availability)
- 16.2.7 ConocoPhillips Company
- 16.2.7.1. Overview
- 16.2.7.2. Products
- 16.2.7.3. SWOT Analysis
- 16.2.7.4. Recent Developments
- 16.2.7.5. Financials (Based on Availability)
- 16.2.8 Valero Energy
- 16.2.8.1. Overview
- 16.2.8.2. Products
- 16.2.8.3. SWOT Analysis
- 16.2.8.4. Recent Developments
- 16.2.8.5. Financials (Based on Availability)
- 16.2.9 EOG Resources
- 16.2.9.1. Overview
- 16.2.9.2. Products
- 16.2.9.3. SWOT Analysis
- 16.2.9.4. Recent Developments
- 16.2.9.5. Financials (Based on Availability)
- 16.2.10 Total Energies SE
- 16.2.10.1. Overview
- 16.2.10.2. Products
- 16.2.10.3. SWOT Analysis
- 16.2.10.4. Recent Developments
- 16.2.10.5. Financials (Based on Availability)
- 16.2.11 Phillips
- 16.2.11.1. Overview
- 16.2.11.2. Products
- 16.2.11.3. SWOT Analysis
- 16.2.11.4. Recent Developments
- 16.2.11.5. Financials (Based on Availability)
- 16.2.12 BP PLC
- 16.2.12.1. Overview
- 16.2.12.2. Products
- 16.2.12.3. SWOT Analysis
- 16.2.12.4. Recent Developments
- 16.2.12.5. Financials (Based on Availability)
- 16.2.1 Shell PLC
List of Figures
- Figure 1: Global USA Oil and Gas Market Revenue Breakdown (Million, %) by Region 2024 & 2032
- Figure 2: Global USA Oil and Gas Market Volume Breakdown (Tonnes, %) by Region 2024 & 2032
- Figure 3: United states USA Oil and Gas Market Revenue (Million), by Country 2024 & 2032
- Figure 4: United states USA Oil and Gas Market Volume (Tonnes), by Country 2024 & 2032
- Figure 5: United states USA Oil and Gas Market Revenue Share (%), by Country 2024 & 2032
- Figure 6: United states USA Oil and Gas Market Volume Share (%), by Country 2024 & 2032
- Figure 7: North America USA Oil and Gas Market Revenue (Million), by Upstream 2024 & 2032
- Figure 8: North America USA Oil and Gas Market Volume (Tonnes), by Upstream 2024 & 2032
- Figure 9: North America USA Oil and Gas Market Revenue Share (%), by Upstream 2024 & 2032
- Figure 10: North America USA Oil and Gas Market Volume Share (%), by Upstream 2024 & 2032
- Figure 11: North America USA Oil and Gas Market Revenue (Million), by Midstream 2024 & 2032
- Figure 12: North America USA Oil and Gas Market Volume (Tonnes), by Midstream 2024 & 2032
- Figure 13: North America USA Oil and Gas Market Revenue Share (%), by Midstream 2024 & 2032
- Figure 14: North America USA Oil and Gas Market Volume Share (%), by Midstream 2024 & 2032
- Figure 15: North America USA Oil and Gas Market Revenue (Million), by Downstream 2024 & 2032
- Figure 16: North America USA Oil and Gas Market Volume (Tonnes), by Downstream 2024 & 2032
- Figure 17: North America USA Oil and Gas Market Revenue Share (%), by Downstream 2024 & 2032
- Figure 18: North America USA Oil and Gas Market Volume Share (%), by Downstream 2024 & 2032
- Figure 19: North America USA Oil and Gas Market Revenue (Million), by Country 2024 & 2032
- Figure 20: North America USA Oil and Gas Market Volume (Tonnes), by Country 2024 & 2032
- Figure 21: North America USA Oil and Gas Market Revenue Share (%), by Country 2024 & 2032
- Figure 22: North America USA Oil and Gas Market Volume Share (%), by Country 2024 & 2032
- Figure 23: South America USA Oil and Gas Market Revenue (Million), by Upstream 2024 & 2032
- Figure 24: South America USA Oil and Gas Market Volume (Tonnes), by Upstream 2024 & 2032
- Figure 25: South America USA Oil and Gas Market Revenue Share (%), by Upstream 2024 & 2032
- Figure 26: South America USA Oil and Gas Market Volume Share (%), by Upstream 2024 & 2032
- Figure 27: South America USA Oil and Gas Market Revenue (Million), by Midstream 2024 & 2032
- Figure 28: South America USA Oil and Gas Market Volume (Tonnes), by Midstream 2024 & 2032
- Figure 29: South America USA Oil and Gas Market Revenue Share (%), by Midstream 2024 & 2032
- Figure 30: South America USA Oil and Gas Market Volume Share (%), by Midstream 2024 & 2032
- Figure 31: South America USA Oil and Gas Market Revenue (Million), by Downstream 2024 & 2032
- Figure 32: South America USA Oil and Gas Market Volume (Tonnes), by Downstream 2024 & 2032
- Figure 33: South America USA Oil and Gas Market Revenue Share (%), by Downstream 2024 & 2032
- Figure 34: South America USA Oil and Gas Market Volume Share (%), by Downstream 2024 & 2032
- Figure 35: South America USA Oil and Gas Market Revenue (Million), by Country 2024 & 2032
- Figure 36: South America USA Oil and Gas Market Volume (Tonnes), by Country 2024 & 2032
- Figure 37: South America USA Oil and Gas Market Revenue Share (%), by Country 2024 & 2032
- Figure 38: South America USA Oil and Gas Market Volume Share (%), by Country 2024 & 2032
- Figure 39: Europe USA Oil and Gas Market Revenue (Million), by Upstream 2024 & 2032
- Figure 40: Europe USA Oil and Gas Market Volume (Tonnes), by Upstream 2024 & 2032
- Figure 41: Europe USA Oil and Gas Market Revenue Share (%), by Upstream 2024 & 2032
- Figure 42: Europe USA Oil and Gas Market Volume Share (%), by Upstream 2024 & 2032
- Figure 43: Europe USA Oil and Gas Market Revenue (Million), by Midstream 2024 & 2032
- Figure 44: Europe USA Oil and Gas Market Volume (Tonnes), by Midstream 2024 & 2032
- Figure 45: Europe USA Oil and Gas Market Revenue Share (%), by Midstream 2024 & 2032
- Figure 46: Europe USA Oil and Gas Market Volume Share (%), by Midstream 2024 & 2032
- Figure 47: Europe USA Oil and Gas Market Revenue (Million), by Downstream 2024 & 2032
- Figure 48: Europe USA Oil and Gas Market Volume (Tonnes), by Downstream 2024 & 2032
- Figure 49: Europe USA Oil and Gas Market Revenue Share (%), by Downstream 2024 & 2032
- Figure 50: Europe USA Oil and Gas Market Volume Share (%), by Downstream 2024 & 2032
- Figure 51: Europe USA Oil and Gas Market Revenue (Million), by Country 2024 & 2032
- Figure 52: Europe USA Oil and Gas Market Volume (Tonnes), by Country 2024 & 2032
- Figure 53: Europe USA Oil and Gas Market Revenue Share (%), by Country 2024 & 2032
- Figure 54: Europe USA Oil and Gas Market Volume Share (%), by Country 2024 & 2032
- Figure 55: Middle East & Africa USA Oil and Gas Market Revenue (Million), by Upstream 2024 & 2032
- Figure 56: Middle East & Africa USA Oil and Gas Market Volume (Tonnes), by Upstream 2024 & 2032
- Figure 57: Middle East & Africa USA Oil and Gas Market Revenue Share (%), by Upstream 2024 & 2032
- Figure 58: Middle East & Africa USA Oil and Gas Market Volume Share (%), by Upstream 2024 & 2032
- Figure 59: Middle East & Africa USA Oil and Gas Market Revenue (Million), by Midstream 2024 & 2032
- Figure 60: Middle East & Africa USA Oil and Gas Market Volume (Tonnes), by Midstream 2024 & 2032
- Figure 61: Middle East & Africa USA Oil and Gas Market Revenue Share (%), by Midstream 2024 & 2032
- Figure 62: Middle East & Africa USA Oil and Gas Market Volume Share (%), by Midstream 2024 & 2032
- Figure 63: Middle East & Africa USA Oil and Gas Market Revenue (Million), by Downstream 2024 & 2032
- Figure 64: Middle East & Africa USA Oil and Gas Market Volume (Tonnes), by Downstream 2024 & 2032
- Figure 65: Middle East & Africa USA Oil and Gas Market Revenue Share (%), by Downstream 2024 & 2032
- Figure 66: Middle East & Africa USA Oil and Gas Market Volume Share (%), by Downstream 2024 & 2032
- Figure 67: Middle East & Africa USA Oil and Gas Market Revenue (Million), by Country 2024 & 2032
- Figure 68: Middle East & Africa USA Oil and Gas Market Volume (Tonnes), by Country 2024 & 2032
- Figure 69: Middle East & Africa USA Oil and Gas Market Revenue Share (%), by Country 2024 & 2032
- Figure 70: Middle East & Africa USA Oil and Gas Market Volume Share (%), by Country 2024 & 2032
- Figure 71: Asia Pacific USA Oil and Gas Market Revenue (Million), by Upstream 2024 & 2032
- Figure 72: Asia Pacific USA Oil and Gas Market Volume (Tonnes), by Upstream 2024 & 2032
- Figure 73: Asia Pacific USA Oil and Gas Market Revenue Share (%), by Upstream 2024 & 2032
- Figure 74: Asia Pacific USA Oil and Gas Market Volume Share (%), by Upstream 2024 & 2032
- Figure 75: Asia Pacific USA Oil and Gas Market Revenue (Million), by Midstream 2024 & 2032
- Figure 76: Asia Pacific USA Oil and Gas Market Volume (Tonnes), by Midstream 2024 & 2032
- Figure 77: Asia Pacific USA Oil and Gas Market Revenue Share (%), by Midstream 2024 & 2032
- Figure 78: Asia Pacific USA Oil and Gas Market Volume Share (%), by Midstream 2024 & 2032
- Figure 79: Asia Pacific USA Oil and Gas Market Revenue (Million), by Downstream 2024 & 2032
- Figure 80: Asia Pacific USA Oil and Gas Market Volume (Tonnes), by Downstream 2024 & 2032
- Figure 81: Asia Pacific USA Oil and Gas Market Revenue Share (%), by Downstream 2024 & 2032
- Figure 82: Asia Pacific USA Oil and Gas Market Volume Share (%), by Downstream 2024 & 2032
- Figure 83: Asia Pacific USA Oil and Gas Market Revenue (Million), by Country 2024 & 2032
- Figure 84: Asia Pacific USA Oil and Gas Market Volume (Tonnes), by Country 2024 & 2032
- Figure 85: Asia Pacific USA Oil and Gas Market Revenue Share (%), by Country 2024 & 2032
- Figure 86: Asia Pacific USA Oil and Gas Market Volume Share (%), by Country 2024 & 2032
List of Tables
- Table 1: Global USA Oil and Gas Market Revenue Million Forecast, by Region 2019 & 2032
- Table 2: Global USA Oil and Gas Market Volume Tonnes Forecast, by Region 2019 & 2032
- Table 3: Global USA Oil and Gas Market Revenue Million Forecast, by Upstream 2019 & 2032
- Table 4: Global USA Oil and Gas Market Volume Tonnes Forecast, by Upstream 2019 & 2032
- Table 5: Global USA Oil and Gas Market Revenue Million Forecast, by Midstream 2019 & 2032
- Table 6: Global USA Oil and Gas Market Volume Tonnes Forecast, by Midstream 2019 & 2032
- Table 7: Global USA Oil and Gas Market Revenue Million Forecast, by Downstream 2019 & 2032
- Table 8: Global USA Oil and Gas Market Volume Tonnes Forecast, by Downstream 2019 & 2032
- Table 9: Global USA Oil and Gas Market Revenue Million Forecast, by Region 2019 & 2032
- Table 10: Global USA Oil and Gas Market Volume Tonnes Forecast, by Region 2019 & 2032
- Table 11: Global USA Oil and Gas Market Revenue Million Forecast, by Country 2019 & 2032
- Table 12: Global USA Oil and Gas Market Volume Tonnes Forecast, by Country 2019 & 2032
- Table 13: Northeast USA Oil and Gas Market Revenue (Million) Forecast, by Application 2019 & 2032
- Table 14: Northeast USA Oil and Gas Market Volume (Tonnes) Forecast, by Application 2019 & 2032
- Table 15: Southeast USA Oil and Gas Market Revenue (Million) Forecast, by Application 2019 & 2032
- Table 16: Southeast USA Oil and Gas Market Volume (Tonnes) Forecast, by Application 2019 & 2032
- Table 17: Midwest USA Oil and Gas Market Revenue (Million) Forecast, by Application 2019 & 2032
- Table 18: Midwest USA Oil and Gas Market Volume (Tonnes) Forecast, by Application 2019 & 2032
- Table 19: Southwest USA Oil and Gas Market Revenue (Million) Forecast, by Application 2019 & 2032
- Table 20: Southwest USA Oil and Gas Market Volume (Tonnes) Forecast, by Application 2019 & 2032
- Table 21: West USA Oil and Gas Market Revenue (Million) Forecast, by Application 2019 & 2032
- Table 22: West USA Oil and Gas Market Volume (Tonnes) Forecast, by Application 2019 & 2032
- Table 23: Global USA Oil and Gas Market Revenue Million Forecast, by Upstream 2019 & 2032
- Table 24: Global USA Oil and Gas Market Volume Tonnes Forecast, by Upstream 2019 & 2032
- Table 25: Global USA Oil and Gas Market Revenue Million Forecast, by Midstream 2019 & 2032
- Table 26: Global USA Oil and Gas Market Volume Tonnes Forecast, by Midstream 2019 & 2032
- Table 27: Global USA Oil and Gas Market Revenue Million Forecast, by Downstream 2019 & 2032
- Table 28: Global USA Oil and Gas Market Volume Tonnes Forecast, by Downstream 2019 & 2032
- Table 29: Global USA Oil and Gas Market Revenue Million Forecast, by Country 2019 & 2032
- Table 30: Global USA Oil and Gas Market Volume Tonnes Forecast, by Country 2019 & 2032
- Table 31: United States USA Oil and Gas Market Revenue (Million) Forecast, by Application 2019 & 2032
- Table 32: United States USA Oil and Gas Market Volume (Tonnes) Forecast, by Application 2019 & 2032
- Table 33: Canada USA Oil and Gas Market Revenue (Million) Forecast, by Application 2019 & 2032
- Table 34: Canada USA Oil and Gas Market Volume (Tonnes) Forecast, by Application 2019 & 2032
- Table 35: Mexico USA Oil and Gas Market Revenue (Million) Forecast, by Application 2019 & 2032
- Table 36: Mexico USA Oil and Gas Market Volume (Tonnes) Forecast, by Application 2019 & 2032
- Table 37: Global USA Oil and Gas Market Revenue Million Forecast, by Upstream 2019 & 2032
- Table 38: Global USA Oil and Gas Market Volume Tonnes Forecast, by Upstream 2019 & 2032
- Table 39: Global USA Oil and Gas Market Revenue Million Forecast, by Midstream 2019 & 2032
- Table 40: Global USA Oil and Gas Market Volume Tonnes Forecast, by Midstream 2019 & 2032
- Table 41: Global USA Oil and Gas Market Revenue Million Forecast, by Downstream 2019 & 2032
- Table 42: Global USA Oil and Gas Market Volume Tonnes Forecast, by Downstream 2019 & 2032
- Table 43: Global USA Oil and Gas Market Revenue Million Forecast, by Country 2019 & 2032
- Table 44: Global USA Oil and Gas Market Volume Tonnes Forecast, by Country 2019 & 2032
- Table 45: Brazil USA Oil and Gas Market Revenue (Million) Forecast, by Application 2019 & 2032
- Table 46: Brazil USA Oil and Gas Market Volume (Tonnes) Forecast, by Application 2019 & 2032
- Table 47: Argentina USA Oil and Gas Market Revenue (Million) Forecast, by Application 2019 & 2032
- Table 48: Argentina USA Oil and Gas Market Volume (Tonnes) Forecast, by Application 2019 & 2032
- Table 49: Rest of South America USA Oil and Gas Market Revenue (Million) Forecast, by Application 2019 & 2032
- Table 50: Rest of South America USA Oil and Gas Market Volume (Tonnes) Forecast, by Application 2019 & 2032
- Table 51: Global USA Oil and Gas Market Revenue Million Forecast, by Upstream 2019 & 2032
- Table 52: Global USA Oil and Gas Market Volume Tonnes Forecast, by Upstream 2019 & 2032
- Table 53: Global USA Oil and Gas Market Revenue Million Forecast, by Midstream 2019 & 2032
- Table 54: Global USA Oil and Gas Market Volume Tonnes Forecast, by Midstream 2019 & 2032
- Table 55: Global USA Oil and Gas Market Revenue Million Forecast, by Downstream 2019 & 2032
- Table 56: Global USA Oil and Gas Market Volume Tonnes Forecast, by Downstream 2019 & 2032
- Table 57: Global USA Oil and Gas Market Revenue Million Forecast, by Country 2019 & 2032
- Table 58: Global USA Oil and Gas Market Volume Tonnes Forecast, by Country 2019 & 2032
- Table 59: United Kingdom USA Oil and Gas Market Revenue (Million) Forecast, by Application 2019 & 2032
- Table 60: United Kingdom USA Oil and Gas Market Volume (Tonnes) Forecast, by Application 2019 & 2032
- Table 61: Germany USA Oil and Gas Market Revenue (Million) Forecast, by Application 2019 & 2032
- Table 62: Germany USA Oil and Gas Market Volume (Tonnes) Forecast, by Application 2019 & 2032
- Table 63: France USA Oil and Gas Market Revenue (Million) Forecast, by Application 2019 & 2032
- Table 64: France USA Oil and Gas Market Volume (Tonnes) Forecast, by Application 2019 & 2032
- Table 65: Italy USA Oil and Gas Market Revenue (Million) Forecast, by Application 2019 & 2032
- Table 66: Italy USA Oil and Gas Market Volume (Tonnes) Forecast, by Application 2019 & 2032
- Table 67: Spain USA Oil and Gas Market Revenue (Million) Forecast, by Application 2019 & 2032
- Table 68: Spain USA Oil and Gas Market Volume (Tonnes) Forecast, by Application 2019 & 2032
- Table 69: Russia USA Oil and Gas Market Revenue (Million) Forecast, by Application 2019 & 2032
- Table 70: Russia USA Oil and Gas Market Volume (Tonnes) Forecast, by Application 2019 & 2032
- Table 71: Benelux USA Oil and Gas Market Revenue (Million) Forecast, by Application 2019 & 2032
- Table 72: Benelux USA Oil and Gas Market Volume (Tonnes) Forecast, by Application 2019 & 2032
- Table 73: Nordics USA Oil and Gas Market Revenue (Million) Forecast, by Application 2019 & 2032
- Table 74: Nordics USA Oil and Gas Market Volume (Tonnes) Forecast, by Application 2019 & 2032
- Table 75: Rest of Europe USA Oil and Gas Market Revenue (Million) Forecast, by Application 2019 & 2032
- Table 76: Rest of Europe USA Oil and Gas Market Volume (Tonnes) Forecast, by Application 2019 & 2032
- Table 77: Global USA Oil and Gas Market Revenue Million Forecast, by Upstream 2019 & 2032
- Table 78: Global USA Oil and Gas Market Volume Tonnes Forecast, by Upstream 2019 & 2032
- Table 79: Global USA Oil and Gas Market Revenue Million Forecast, by Midstream 2019 & 2032
- Table 80: Global USA Oil and Gas Market Volume Tonnes Forecast, by Midstream 2019 & 2032
- Table 81: Global USA Oil and Gas Market Revenue Million Forecast, by Downstream 2019 & 2032
- Table 82: Global USA Oil and Gas Market Volume Tonnes Forecast, by Downstream 2019 & 2032
- Table 83: Global USA Oil and Gas Market Revenue Million Forecast, by Country 2019 & 2032
- Table 84: Global USA Oil and Gas Market Volume Tonnes Forecast, by Country 2019 & 2032
- Table 85: Turkey USA Oil and Gas Market Revenue (Million) Forecast, by Application 2019 & 2032
- Table 86: Turkey USA Oil and Gas Market Volume (Tonnes) Forecast, by Application 2019 & 2032
- Table 87: Israel USA Oil and Gas Market Revenue (Million) Forecast, by Application 2019 & 2032
- Table 88: Israel USA Oil and Gas Market Volume (Tonnes) Forecast, by Application 2019 & 2032
- Table 89: GCC USA Oil and Gas Market Revenue (Million) Forecast, by Application 2019 & 2032
- Table 90: GCC USA Oil and Gas Market Volume (Tonnes) Forecast, by Application 2019 & 2032
- Table 91: North Africa USA Oil and Gas Market Revenue (Million) Forecast, by Application 2019 & 2032
- Table 92: North Africa USA Oil and Gas Market Volume (Tonnes) Forecast, by Application 2019 & 2032
- Table 93: South Africa USA Oil and Gas Market Revenue (Million) Forecast, by Application 2019 & 2032
- Table 94: South Africa USA Oil and Gas Market Volume (Tonnes) Forecast, by Application 2019 & 2032
- Table 95: Rest of Middle East & Africa USA Oil and Gas Market Revenue (Million) Forecast, by Application 2019 & 2032
- Table 96: Rest of Middle East & Africa USA Oil and Gas Market Volume (Tonnes) Forecast, by Application 2019 & 2032
- Table 97: Global USA Oil and Gas Market Revenue Million Forecast, by Upstream 2019 & 2032
- Table 98: Global USA Oil and Gas Market Volume Tonnes Forecast, by Upstream 2019 & 2032
- Table 99: Global USA Oil and Gas Market Revenue Million Forecast, by Midstream 2019 & 2032
- Table 100: Global USA Oil and Gas Market Volume Tonnes Forecast, by Midstream 2019 & 2032
- Table 101: Global USA Oil and Gas Market Revenue Million Forecast, by Downstream 2019 & 2032
- Table 102: Global USA Oil and Gas Market Volume Tonnes Forecast, by Downstream 2019 & 2032
- Table 103: Global USA Oil and Gas Market Revenue Million Forecast, by Country 2019 & 2032
- Table 104: Global USA Oil and Gas Market Volume Tonnes Forecast, by Country 2019 & 2032
- Table 105: China USA Oil and Gas Market Revenue (Million) Forecast, by Application 2019 & 2032
- Table 106: China USA Oil and Gas Market Volume (Tonnes) Forecast, by Application 2019 & 2032
- Table 107: India USA Oil and Gas Market Revenue (Million) Forecast, by Application 2019 & 2032
- Table 108: India USA Oil and Gas Market Volume (Tonnes) Forecast, by Application 2019 & 2032
- Table 109: Japan USA Oil and Gas Market Revenue (Million) Forecast, by Application 2019 & 2032
- Table 110: Japan USA Oil and Gas Market Volume (Tonnes) Forecast, by Application 2019 & 2032
- Table 111: South Korea USA Oil and Gas Market Revenue (Million) Forecast, by Application 2019 & 2032
- Table 112: South Korea USA Oil and Gas Market Volume (Tonnes) Forecast, by Application 2019 & 2032
- Table 113: ASEAN USA Oil and Gas Market Revenue (Million) Forecast, by Application 2019 & 2032
- Table 114: ASEAN USA Oil and Gas Market Volume (Tonnes) Forecast, by Application 2019 & 2032
- Table 115: Oceania USA Oil and Gas Market Revenue (Million) Forecast, by Application 2019 & 2032
- Table 116: Oceania USA Oil and Gas Market Volume (Tonnes) Forecast, by Application 2019 & 2032
- Table 117: Rest of Asia Pacific USA Oil and Gas Market Revenue (Million) Forecast, by Application 2019 & 2032
- Table 118: Rest of Asia Pacific USA Oil and Gas Market Volume (Tonnes) Forecast, by Application 2019 & 2032
Frequently Asked Questions
1. What is the projected Compound Annual Growth Rate (CAGR) of the USA Oil and Gas Market?
The projected CAGR is approximately > 4.00%.
2. Which companies are prominent players in the USA Oil and Gas Market?
Key companies in the market include Shell PLC, Hess Corporation, ExxonMobil Corporation, Marathon Petroleum Corporation, Occidental Petroleum, Chevron Corporation, ConocoPhillips Company, Valero Energy, EOG Resources, Total Energies SE, Phillips, BP PLC.
3. What are the main segments of the USA Oil and Gas Market?
The market segments include Upstream, Midstream, Downstream.
4. Can you provide details about the market size?
The market size is estimated to be USD XX Million as of 2022.
5. What are some drivers contributing to market growth?
4.; Modernization and Upgrades of Existing Military Aircraft Fleets4.; Increasing Defense Budgets.
6. What are the notable trends driving market growth?
Upstream Sector Expected Witness Significant Growth.
7. Are there any restraints impacting market growth?
4.; Shift Toward Unmanned Aircraft.
8. Can you provide examples of recent developments in the market?
March 2022: The United States' President Joe Biden agreed to a landmark energy supply deal with the European Union. Under this deal, the United States was expected to increase transatlantic gas deliveries. This deal is important to reduce dependence on Russia after the Russia-Ukraine War.
9. What pricing options are available for accessing the report?
Pricing options include single-user, multi-user, and enterprise licenses priced at USD 3800, USD 4500, and USD 5800 respectively.
10. Is the market size provided in terms of value or volume?
The market size is provided in terms of value, measured in Million and volume, measured in Tonnes.
11. Are there any specific market keywords associated with the report?
Yes, the market keyword associated with the report is "USA Oil and Gas Market," which aids in identifying and referencing the specific market segment covered.
12. How do I determine which pricing option suits my needs best?
The pricing options vary based on user requirements and access needs. Individual users may opt for single-user licenses, while businesses requiring broader access may choose multi-user or enterprise licenses for cost-effective access to the report.
13. Are there any additional resources or data provided in the USA Oil and Gas Market report?
While the report offers comprehensive insights, it's advisable to review the specific contents or supplementary materials provided to ascertain if additional resources or data are available.
14. How can I stay updated on further developments or reports in the USA Oil and Gas Market?
To stay informed about further developments, trends, and reports in the USA Oil and Gas Market, consider subscribing to industry newsletters, following relevant companies and organizations, or regularly checking reputable industry news sources and publications.
Methodology
Step 1 - Identification of Relevant Samples Size from Population Database


Step 2 - Approaches for Defining Global Market Size (Value, Volume* & Price*)

Note*: In applicable scenarios
Step 3 - Data Sources
Primary Research
- Web Analytics
- Survey Reports
- Research Institute
- Latest Research Reports
- Opinion Leaders
Secondary Research
- Annual Reports
- White Paper
- Latest Press Release
- Industry Association
- Paid Database
- Investor Presentations

Step 4 - Data Triangulation
Involves using different sources of information in order to increase the validity of a study
These sources are likely to be stakeholders in a program - participants, other researchers, program staff, other community members, and so on.
Then we put all data in single framework & apply various statistical tools to find out the dynamic on the market.
During the analysis stage, feedback from the stakeholder groups would be compared to determine areas of agreement as well as areas of divergence
