

Key Insights
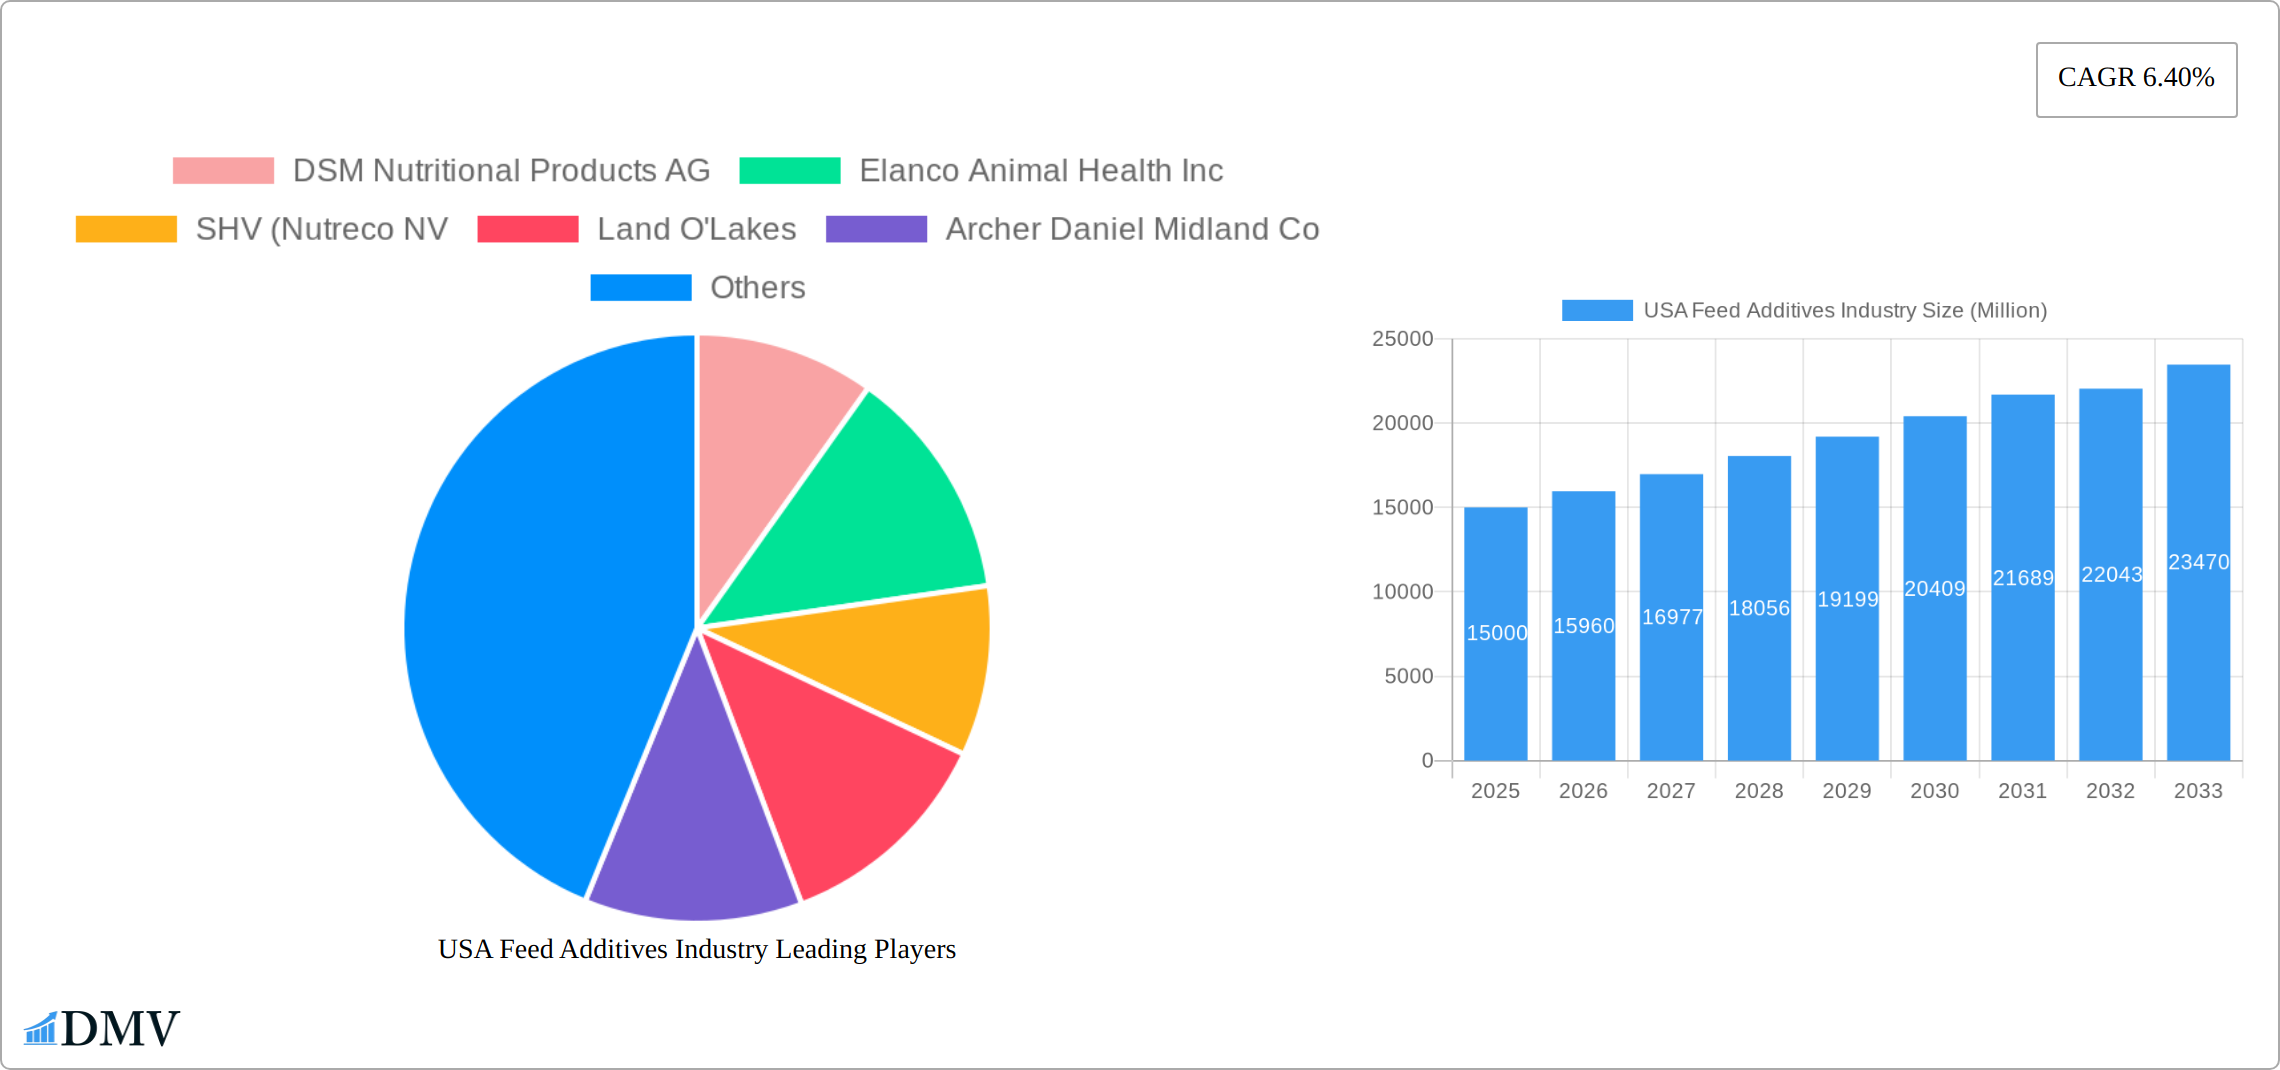
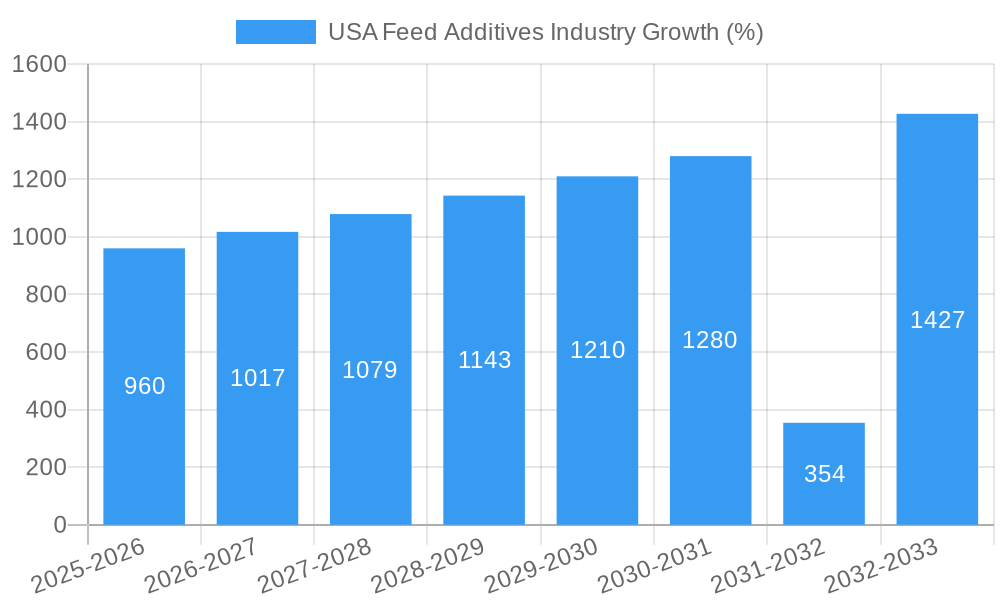
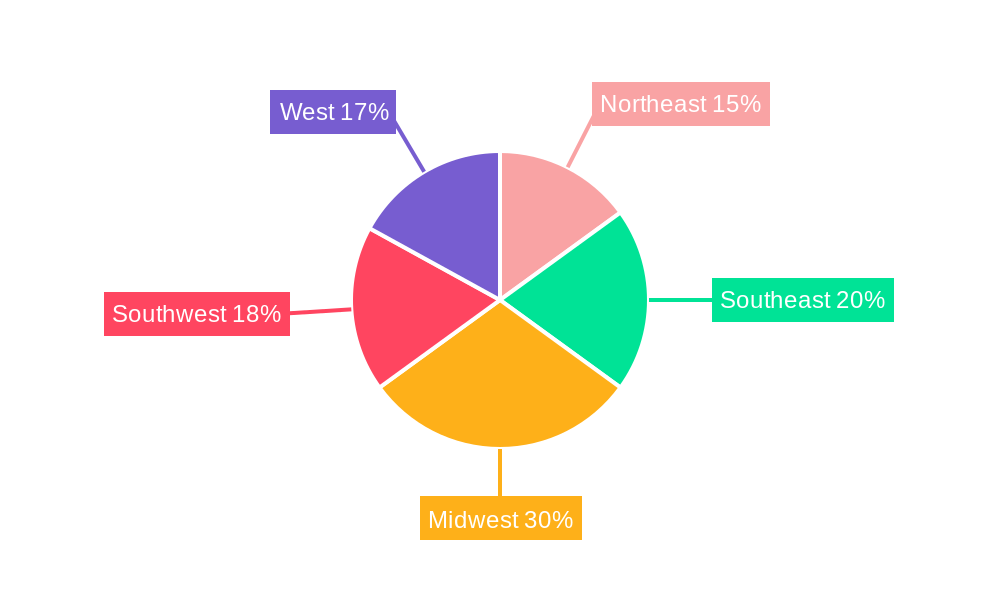
The US feed additives market, valued at approximately $XX million in 2025, is projected to experience robust growth, exhibiting a Compound Annual Growth Rate (CAGR) of 6.40% from 2025 to 2033. This expansion is driven by several key factors. Increasing demand for animal protein, particularly poultry and swine, necessitates higher feed efficiency and improved animal health. This fuels the demand for feed additives that enhance nutrient utilization, promote growth, and prevent diseases. Furthermore, rising consumer awareness regarding food safety and the growing adoption of sustainable farming practices are influencing the market positively. The industry is also witnessing a shift towards advanced feed additives with targeted functionalities, such as prebiotics and probiotics, reflecting a focus on animal welfare and improved gut health. Key segments like acidifiers and those catering to aquaculture and swine are experiencing particularly strong growth due to their specific needs and the increasing scale of these sectors. Geographic variations exist, with regions like the Midwest and Southeast potentially showing higher growth rates due to concentrated animal agriculture. Competitive pressures from established players like DSM, Elanco, and Cargill, alongside emerging players focusing on innovative solutions, are shaping the market landscape.
However, the market faces certain challenges. Regulatory scrutiny surrounding the use of certain feed additives and the fluctuations in raw material prices pose potential constraints on growth. Furthermore, maintaining the efficacy and safety of additives in the face of evolving animal health needs is an ongoing concern for manufacturers. The market’s success hinges on innovation, the development of environmentally friendly additives, and continuous efforts to comply with evolving regulatory frameworks. The market is likely to see continued consolidation, with larger players acquiring smaller companies to expand their product portfolios and geographic reach. The future of the US feed additives market is bright, characterized by innovation, sustainability, and continuous adaptation to meet the evolving demands of the animal feed industry.
USA Feed Additives Industry: A Comprehensive Market Report (2019-2033)
This insightful report provides a detailed analysis of the USA Feed Additives industry, offering valuable insights for stakeholders seeking to understand market trends, competitive dynamics, and future growth opportunities. The study covers the period 2019-2033, with 2025 serving as the base and estimated year. The report's comprehensive scope includes detailed market sizing, competitive landscape analysis, and future projections, providing a complete understanding of this dynamic sector. The total market value in 2025 is estimated at $XX Billion, expected to reach $XX Billion by 2033.
USA Feed Additives Industry Market Composition & Trends
This section delves into the intricate structure of the USA feed additives market, examining its concentration, innovation drivers, regulatory environment, substitute products, end-user profiles, and significant mergers and acquisitions (M&A) activities. The market is characterized by a moderately concentrated landscape with several key players holding significant market share. DSM Nutritional Products AG, Cargill Inc, and BASF SE are among the dominant players, collectively accounting for approximately XX% of the market in 2025.
Market Share Distribution (2025):
- DSM Nutritional Products AG: XX%
- Cargill Inc: XX%
- BASF SE: XX%
- Others: XX%
Innovation Catalysts: Growing consumer demand for sustainable and efficient animal feed production, coupled with stringent regulations, is driving innovation in areas like phytogenic additives and methane-reducing solutions.
Regulatory Landscape: The FDA and other regulatory bodies play a crucial role, shaping product approvals and safety standards, influencing market dynamics.
Substitute Products: The availability of alternative feed sources and approaches presents competitive challenges, especially in the context of price sensitivity.
End-User Profiles: The report segments end-users based on animal type (aquaculture, swine, poultry, ruminants, and others) providing insights into specific needs and preferences.
M&A Activities: Significant M&A deals, such as the Adisseo group's acquisition of Nor-Feed (December 2022) and the collaboration between Delacon and Cargill (June 2022), demonstrate a significant level of industry consolidation and a focus on expanding product portfolios. The total value of M&A deals within the period 2019-2024 is estimated at $XX Billion.
USA Feed Additives Industry Industry Evolution
This section examines the trajectory of the USA feed additives market, analyzing its growth patterns, technological advancements, and evolving consumer preferences over the historical period (2019-2024) and projecting growth through 2033. The market witnessed a Compound Annual Growth Rate (CAGR) of XX% during 2019-2024, primarily driven by increasing livestock production and rising consumer demand for animal products. Technological advancements, especially in areas like precision feeding and the development of novel feed additives, have played a significant role in shaping the market's evolution. The shift towards sustainable and environmentally friendly practices has increased the demand for plant-based and methane-reducing feed additives, fostering significant growth opportunities. Future market growth will be heavily influenced by factors such as feed efficiency improvement strategies, regulatory changes, and price fluctuations in raw materials. The forecasted CAGR for 2025-2033 is expected to be XX%. Adoption of innovative feed additives is projected to increase by XX% over the forecast period, driven by advancements in phytogenic and enzymatic feed solutions.
Leading Regions, Countries, or Segments in USA Feed Additives Industry
This section analyzes the dominant regions, countries, and segments within the USA feed additives market. While granular regional data may vary, the analysis suggests that the swine and poultry segments are currently the largest contributors to the market, driven by high animal populations and feed consumption. Aquaculture is a rapidly growing segment, fueled by increasing seafood demand.
Key Drivers for Swine Segment Dominance:
- High swine population in key agricultural states.
- Strong demand for efficient and cost-effective feed solutions.
- Regulatory support promoting animal health and productivity.
Key Drivers for Poultry Segment Dominance:
- High poultry production levels.
- Focus on improving feed conversion ratio.
- Increased adoption of advanced feed additives.
Key Drivers for Aquaculture Segment Growth:
- Growing demand for seafood products.
- Increased investment in sustainable aquaculture practices.
- Government initiatives promoting the aquaculture sector.
The detailed market analysis illustrates the nuances driving segment growth, providing valuable insights into factors affecting market share dynamics and growth potential across diverse animal categories.
USA Feed Additives Industry Product Innovations
Recent product innovations focus heavily on improving feed efficiency, reducing environmental impact, and enhancing animal health. Examples include the introduction of novel enzyme blends for improved nutrient digestibility, plant-based phytogenic additives for disease prevention, and methane-reducing feed additives like Bovaer (Elanco and DSM partnership). These innovations leverage advancements in biotechnology and precision agriculture, leading to improved feed conversion ratios, reduced greenhouse gas emissions, and enhanced animal welfare. Unique selling propositions often center around improved animal health, performance, sustainability benefits, and cost-effectiveness.
Propelling Factors for USA Feed Additives Industry Growth
The growth of the USA feed additives market is driven by a confluence of factors. Technological advancements, such as precision feeding and the development of novel feed additives, lead to improved efficiency and productivity. The increasing demand for animal products fuels the need for higher-quality and specialized feed additives, supporting overall market expansion. Furthermore, regulatory changes focused on improving animal welfare and reducing environmental impact incentivize the adoption of innovative and sustainable solutions. The growing awareness of animal health and environmental concerns has led to increased demand for sustainable and eco-friendly feed additives.
Obstacles in the USA Feed Additives Industry Market
Several factors hinder market growth. Regulatory hurdles, such as stringent approval processes for new feed additives, can lead to delays and increased costs. Supply chain disruptions, especially related to raw material sourcing, pose challenges to market stability and pricing. Intense competition among established players and the emergence of new entrants also exerts pressure on profit margins and market share. Price volatility in raw materials, coupled with fluctuations in energy costs, directly impacts the profitability of feed additive producers.
Future Opportunities in USA Feed Additives Industry
Future opportunities abound. The increasing focus on sustainable agriculture presents a significant opportunity for the development and adoption of environmentally friendly feed additives. The growing demand for traceable and transparent supply chains offers opportunities for companies focusing on sustainable sourcing and production. Advances in biotechnology and precision agriculture provide avenues for developing novel feed additives tailored to specific animal needs. Expanding into niche markets, such as organic and specialty animal feed, presents additional avenues for growth.
Major Players in the USA Feed Additives Industry Ecosystem
- DSM Nutritional Products AG
- Elanco Animal Health Inc
- SHV (Nutreco NV)
- Land O'Lakes
- Archer Daniel Midland Co
- BASF SE
- Alltech Inc
- Cargill Inc
- IFF(Danisco Animal Nutrition)
- Adisseo
Key Developments in USA Feed Additives Industry Industry
April 2022: Elanco and Royal DSM formed a strategic partnership for Bovaer, a methane-reducing feed additive for cattle. This partnership signifies a major step towards sustainable cattle farming.
June 2022: Delacon and Cargill collaborated to establish a global plant-based phytogenic feed additives business. This collaboration expands the market for plant-based alternatives.
December 2022: The Adisseo group agreed to acquire Nor-Feed and its subsidiaries to develop and register botanical additives. This acquisition strengthens Adisseo's position in the botanical additives market.
Strategic USA Feed Additives Industry Market Forecast
The USA feed additives market is poised for significant growth over the forecast period (2025-2033), driven by technological advancements, increasing demand for animal products, and a heightened focus on sustainability. The emergence of novel feed additives, improvements in feed efficiency, and a growing awareness of animal welfare will continue to shape market dynamics. The increasing adoption of sustainable practices will also accelerate the demand for eco-friendly feed additives, creating ample opportunities for innovation and growth in the years to come. The market is projected to experience robust growth, with the potential for significant expansion in various segments and geographical regions.
USA Feed Additives Industry Segmentation
-
1. Additive
-
1.1. Acidifiers
-
1.1.1. By Sub Additive
- 1.1.1.1. Fumaric Acid
- 1.1.1.2. Lactic Acid
- 1.1.1.3. Propionic Acid
- 1.1.1.4. Other Acidifiers
-
1.1.1. By Sub Additive
-
1.2. Amino Acids
- 1.2.1. Lysine
- 1.2.2. Methionine
- 1.2.3. Threonine
- 1.2.4. Tryptophan
- 1.2.5. Other Amino Acids
-
1.3. Antioxidants
- 1.3.1. Butylated Hydroxyanisole (BHA)
- 1.3.2. Butylated Hydroxytoluene (BHT)
- 1.3.3. Citric Acid
- 1.3.4. Ethoxyquin
- 1.3.5. Propyl Gallate
- 1.3.6. Tocopherols
- 1.3.7. Other Antioxidants
-
1.4. Binders
- 1.4.1. Natural Binders
- 1.4.2. Synthetic Binders
-
1.5. Enzymes
- 1.5.1. Carbohydrases
- 1.5.2. Phytases
- 1.5.3. Other Enzymes
- 1.6. Flavors & Sweeteners
-
1.7. Minerals
- 1.7.1. Macrominerals
- 1.7.2. Microminerals
-
1.8. Mycotoxin Detoxifiers
- 1.8.1. Biotransformers
-
1.9. Phytogenics
- 1.9.1. Essential Oil
- 1.9.2. Herbs & Spices
- 1.9.3. Other Phytogenics
-
1.10. Pigments
- 1.10.1. Carotenoids
- 1.10.2. Curcumin & Spirulina
-
1.11. Prebiotics
- 1.11.1. Fructo Oligosaccharides
- 1.11.2. Galacto Oligosaccharides
- 1.11.3. Inulin
- 1.11.4. Lactulose
- 1.11.5. Mannan Oligosaccharides
- 1.11.6. Xylo Oligosaccharides
- 1.11.7. Other Prebiotics
-
1.12. Probiotics
- 1.12.1. Bifidobacteria
- 1.12.2. Enterococcus
- 1.12.3. Lactobacilli
- 1.12.4. Pediococcus
- 1.12.5. Streptococcus
- 1.12.6. Other Probiotics
-
1.13. Vitamins
- 1.13.1. Vitamin A
- 1.13.2. Vitamin B
- 1.13.3. Vitamin C
- 1.13.4. Vitamin E
- 1.13.5. Other Vitamins
-
1.14. Yeast
- 1.14.1. Live Yeast
- 1.14.2. Selenium Yeast
- 1.14.3. Spent Yeast
- 1.14.4. Torula Dried Yeast
- 1.14.5. Whey Yeast
- 1.14.6. Yeast Derivatives
-
1.1. Acidifiers
-
2. Animal
-
2.1. Aquaculture
-
2.1.1. By Sub Animal
- 2.1.1.1. Fish
- 2.1.1.2. Shrimp
- 2.1.1.3. Other Aquaculture Species
-
2.1.1. By Sub Animal
-
2.2. Poultry
- 2.2.1. Broiler
- 2.2.2. Layer
- 2.2.3. Other Poultry Birds
-
2.3. Ruminants
- 2.3.1. Beef Cattle
- 2.3.2. Dairy Cattle
- 2.3.3. Other Ruminants
- 2.4. Swine
- 2.5. Other Animals
-
2.1. Aquaculture
USA Feed Additives Industry Segmentation By Geography
-
1. North America
- 1.1. United States
- 1.2. Canada
- 1.3. Mexico
-
2. South America
- 2.1. Brazil
- 2.2. Argentina
- 2.3. Rest of South America
-
3. Europe
- 3.1. United Kingdom
- 3.2. Germany
- 3.3. France
- 3.4. Italy
- 3.5. Spain
- 3.6. Russia
- 3.7. Benelux
- 3.8. Nordics
- 3.9. Rest of Europe
-
4. Middle East & Africa
- 4.1. Turkey
- 4.2. Israel
- 4.3. GCC
- 4.4. North Africa
- 4.5. South Africa
- 4.6. Rest of Middle East & Africa
-
5. Asia Pacific
- 5.1. China
- 5.2. India
- 5.3. Japan
- 5.4. South Korea
- 5.5. ASEAN
- 5.6. Oceania
- 5.7. Rest of Asia Pacific
USA Feed Additives Industry REPORT HIGHLIGHTS
| Aspects | Details |
|---|---|
| Study Period | 2019-2033 |
| Base Year | 2024 |
| Estimated Year | 2025 |
| Forecast Period | 2025-2033 |
| Historical Period | 2019-2024 |
| Growth Rate | CAGR of 6.40% from 2019-2033 |
| Segmentation |
|
Table of Contents
- 1. Introduction
- 1.1. Research Scope
- 1.2. Market Segmentation
- 1.3. Research Methodology
- 1.4. Definitions and Assumptions
- 2. Executive Summary
- 2.1. Introduction
- 3. Market Dynamics
- 3.1. Introduction
- 3.2. Market Drivers
- 3.2.1. Growing Livestock Population; Area Under Forage Production is Increasing; Increasing Demand for Animal Products
- 3.3. Market Restrains
- 3.3.1. Competition Amongst Industries and High Input Prices; Growing Shift Toward Vegan-Based Diet
- 3.4. Market Trends
- 3.4.1. OTHER KEY INDUSTRY TRENDS COVERED IN THE REPORT
- 4. Market Factor Analysis
- 4.1. Porters Five Forces
- 4.2. Supply/Value Chain
- 4.3. PESTEL analysis
- 4.4. Market Entropy
- 4.5. Patent/Trademark Analysis
- 5. Global USA Feed Additives Industry Analysis, Insights and Forecast, 2019-2031
- 5.1. Market Analysis, Insights and Forecast - by Additive
- 5.1.1. Acidifiers
- 5.1.1.1. By Sub Additive
- 5.1.1.1.1. Fumaric Acid
- 5.1.1.1.2. Lactic Acid
- 5.1.1.1.3. Propionic Acid
- 5.1.1.1.4. Other Acidifiers
- 5.1.1.1. By Sub Additive
- 5.1.2. Amino Acids
- 5.1.2.1. Lysine
- 5.1.2.2. Methionine
- 5.1.2.3. Threonine
- 5.1.2.4. Tryptophan
- 5.1.2.5. Other Amino Acids
- 5.1.3. Antioxidants
- 5.1.3.1. Butylated Hydroxyanisole (BHA)
- 5.1.3.2. Butylated Hydroxytoluene (BHT)
- 5.1.3.3. Citric Acid
- 5.1.3.4. Ethoxyquin
- 5.1.3.5. Propyl Gallate
- 5.1.3.6. Tocopherols
- 5.1.3.7. Other Antioxidants
- 5.1.4. Binders
- 5.1.4.1. Natural Binders
- 5.1.4.2. Synthetic Binders
- 5.1.5. Enzymes
- 5.1.5.1. Carbohydrases
- 5.1.5.2. Phytases
- 5.1.5.3. Other Enzymes
- 5.1.6. Flavors & Sweeteners
- 5.1.7. Minerals
- 5.1.7.1. Macrominerals
- 5.1.7.2. Microminerals
- 5.1.8. Mycotoxin Detoxifiers
- 5.1.8.1. Biotransformers
- 5.1.9. Phytogenics
- 5.1.9.1. Essential Oil
- 5.1.9.2. Herbs & Spices
- 5.1.9.3. Other Phytogenics
- 5.1.10. Pigments
- 5.1.10.1. Carotenoids
- 5.1.10.2. Curcumin & Spirulina
- 5.1.11. Prebiotics
- 5.1.11.1. Fructo Oligosaccharides
- 5.1.11.2. Galacto Oligosaccharides
- 5.1.11.3. Inulin
- 5.1.11.4. Lactulose
- 5.1.11.5. Mannan Oligosaccharides
- 5.1.11.6. Xylo Oligosaccharides
- 5.1.11.7. Other Prebiotics
- 5.1.12. Probiotics
- 5.1.12.1. Bifidobacteria
- 5.1.12.2. Enterococcus
- 5.1.12.3. Lactobacilli
- 5.1.12.4. Pediococcus
- 5.1.12.5. Streptococcus
- 5.1.12.6. Other Probiotics
- 5.1.13. Vitamins
- 5.1.13.1. Vitamin A
- 5.1.13.2. Vitamin B
- 5.1.13.3. Vitamin C
- 5.1.13.4. Vitamin E
- 5.1.13.5. Other Vitamins
- 5.1.14. Yeast
- 5.1.14.1. Live Yeast
- 5.1.14.2. Selenium Yeast
- 5.1.14.3. Spent Yeast
- 5.1.14.4. Torula Dried Yeast
- 5.1.14.5. Whey Yeast
- 5.1.14.6. Yeast Derivatives
- 5.1.1. Acidifiers
- 5.2. Market Analysis, Insights and Forecast - by Animal
- 5.2.1. Aquaculture
- 5.2.1.1. By Sub Animal
- 5.2.1.1.1. Fish
- 5.2.1.1.2. Shrimp
- 5.2.1.1.3. Other Aquaculture Species
- 5.2.1.1. By Sub Animal
- 5.2.2. Poultry
- 5.2.2.1. Broiler
- 5.2.2.2. Layer
- 5.2.2.3. Other Poultry Birds
- 5.2.3. Ruminants
- 5.2.3.1. Beef Cattle
- 5.2.3.2. Dairy Cattle
- 5.2.3.3. Other Ruminants
- 5.2.4. Swine
- 5.2.5. Other Animals
- 5.2.1. Aquaculture
- 5.3. Market Analysis, Insights and Forecast - by Region
- 5.3.1. North America
- 5.3.2. South America
- 5.3.3. Europe
- 5.3.4. Middle East & Africa
- 5.3.5. Asia Pacific
- 5.1. Market Analysis, Insights and Forecast - by Additive
- 6. North America USA Feed Additives Industry Analysis, Insights and Forecast, 2019-2031
- 6.1. Market Analysis, Insights and Forecast - by Additive
- 6.1.1. Acidifiers
- 6.1.1.1. By Sub Additive
- 6.1.1.1.1. Fumaric Acid
- 6.1.1.1.2. Lactic Acid
- 6.1.1.1.3. Propionic Acid
- 6.1.1.1.4. Other Acidifiers
- 6.1.1.1. By Sub Additive
- 6.1.2. Amino Acids
- 6.1.2.1. Lysine
- 6.1.2.2. Methionine
- 6.1.2.3. Threonine
- 6.1.2.4. Tryptophan
- 6.1.2.5. Other Amino Acids
- 6.1.3. Antioxidants
- 6.1.3.1. Butylated Hydroxyanisole (BHA)
- 6.1.3.2. Butylated Hydroxytoluene (BHT)
- 6.1.3.3. Citric Acid
- 6.1.3.4. Ethoxyquin
- 6.1.3.5. Propyl Gallate
- 6.1.3.6. Tocopherols
- 6.1.3.7. Other Antioxidants
- 6.1.4. Binders
- 6.1.4.1. Natural Binders
- 6.1.4.2. Synthetic Binders
- 6.1.5. Enzymes
- 6.1.5.1. Carbohydrases
- 6.1.5.2. Phytases
- 6.1.5.3. Other Enzymes
- 6.1.6. Flavors & Sweeteners
- 6.1.7. Minerals
- 6.1.7.1. Macrominerals
- 6.1.7.2. Microminerals
- 6.1.8. Mycotoxin Detoxifiers
- 6.1.8.1. Biotransformers
- 6.1.9. Phytogenics
- 6.1.9.1. Essential Oil
- 6.1.9.2. Herbs & Spices
- 6.1.9.3. Other Phytogenics
- 6.1.10. Pigments
- 6.1.10.1. Carotenoids
- 6.1.10.2. Curcumin & Spirulina
- 6.1.11. Prebiotics
- 6.1.11.1. Fructo Oligosaccharides
- 6.1.11.2. Galacto Oligosaccharides
- 6.1.11.3. Inulin
- 6.1.11.4. Lactulose
- 6.1.11.5. Mannan Oligosaccharides
- 6.1.11.6. Xylo Oligosaccharides
- 6.1.11.7. Other Prebiotics
- 6.1.12. Probiotics
- 6.1.12.1. Bifidobacteria
- 6.1.12.2. Enterococcus
- 6.1.12.3. Lactobacilli
- 6.1.12.4. Pediococcus
- 6.1.12.5. Streptococcus
- 6.1.12.6. Other Probiotics
- 6.1.13. Vitamins
- 6.1.13.1. Vitamin A
- 6.1.13.2. Vitamin B
- 6.1.13.3. Vitamin C
- 6.1.13.4. Vitamin E
- 6.1.13.5. Other Vitamins
- 6.1.14. Yeast
- 6.1.14.1. Live Yeast
- 6.1.14.2. Selenium Yeast
- 6.1.14.3. Spent Yeast
- 6.1.14.4. Torula Dried Yeast
- 6.1.14.5. Whey Yeast
- 6.1.14.6. Yeast Derivatives
- 6.1.1. Acidifiers
- 6.2. Market Analysis, Insights and Forecast - by Animal
- 6.2.1. Aquaculture
- 6.2.1.1. By Sub Animal
- 6.2.1.1.1. Fish
- 6.2.1.1.2. Shrimp
- 6.2.1.1.3. Other Aquaculture Species
- 6.2.1.1. By Sub Animal
- 6.2.2. Poultry
- 6.2.2.1. Broiler
- 6.2.2.2. Layer
- 6.2.2.3. Other Poultry Birds
- 6.2.3. Ruminants
- 6.2.3.1. Beef Cattle
- 6.2.3.2. Dairy Cattle
- 6.2.3.3. Other Ruminants
- 6.2.4. Swine
- 6.2.5. Other Animals
- 6.2.1. Aquaculture
- 6.1. Market Analysis, Insights and Forecast - by Additive
- 7. South America USA Feed Additives Industry Analysis, Insights and Forecast, 2019-2031
- 7.1. Market Analysis, Insights and Forecast - by Additive
- 7.1.1. Acidifiers
- 7.1.1.1. By Sub Additive
- 7.1.1.1.1. Fumaric Acid
- 7.1.1.1.2. Lactic Acid
- 7.1.1.1.3. Propionic Acid
- 7.1.1.1.4. Other Acidifiers
- 7.1.1.1. By Sub Additive
- 7.1.2. Amino Acids
- 7.1.2.1. Lysine
- 7.1.2.2. Methionine
- 7.1.2.3. Threonine
- 7.1.2.4. Tryptophan
- 7.1.2.5. Other Amino Acids
- 7.1.3. Antioxidants
- 7.1.3.1. Butylated Hydroxyanisole (BHA)
- 7.1.3.2. Butylated Hydroxytoluene (BHT)
- 7.1.3.3. Citric Acid
- 7.1.3.4. Ethoxyquin
- 7.1.3.5. Propyl Gallate
- 7.1.3.6. Tocopherols
- 7.1.3.7. Other Antioxidants
- 7.1.4. Binders
- 7.1.4.1. Natural Binders
- 7.1.4.2. Synthetic Binders
- 7.1.5. Enzymes
- 7.1.5.1. Carbohydrases
- 7.1.5.2. Phytases
- 7.1.5.3. Other Enzymes
- 7.1.6. Flavors & Sweeteners
- 7.1.7. Minerals
- 7.1.7.1. Macrominerals
- 7.1.7.2. Microminerals
- 7.1.8. Mycotoxin Detoxifiers
- 7.1.8.1. Biotransformers
- 7.1.9. Phytogenics
- 7.1.9.1. Essential Oil
- 7.1.9.2. Herbs & Spices
- 7.1.9.3. Other Phytogenics
- 7.1.10. Pigments
- 7.1.10.1. Carotenoids
- 7.1.10.2. Curcumin & Spirulina
- 7.1.11. Prebiotics
- 7.1.11.1. Fructo Oligosaccharides
- 7.1.11.2. Galacto Oligosaccharides
- 7.1.11.3. Inulin
- 7.1.11.4. Lactulose
- 7.1.11.5. Mannan Oligosaccharides
- 7.1.11.6. Xylo Oligosaccharides
- 7.1.11.7. Other Prebiotics
- 7.1.12. Probiotics
- 7.1.12.1. Bifidobacteria
- 7.1.12.2. Enterococcus
- 7.1.12.3. Lactobacilli
- 7.1.12.4. Pediococcus
- 7.1.12.5. Streptococcus
- 7.1.12.6. Other Probiotics
- 7.1.13. Vitamins
- 7.1.13.1. Vitamin A
- 7.1.13.2. Vitamin B
- 7.1.13.3. Vitamin C
- 7.1.13.4. Vitamin E
- 7.1.13.5. Other Vitamins
- 7.1.14. Yeast
- 7.1.14.1. Live Yeast
- 7.1.14.2. Selenium Yeast
- 7.1.14.3. Spent Yeast
- 7.1.14.4. Torula Dried Yeast
- 7.1.14.5. Whey Yeast
- 7.1.14.6. Yeast Derivatives
- 7.1.1. Acidifiers
- 7.2. Market Analysis, Insights and Forecast - by Animal
- 7.2.1. Aquaculture
- 7.2.1.1. By Sub Animal
- 7.2.1.1.1. Fish
- 7.2.1.1.2. Shrimp
- 7.2.1.1.3. Other Aquaculture Species
- 7.2.1.1. By Sub Animal
- 7.2.2. Poultry
- 7.2.2.1. Broiler
- 7.2.2.2. Layer
- 7.2.2.3. Other Poultry Birds
- 7.2.3. Ruminants
- 7.2.3.1. Beef Cattle
- 7.2.3.2. Dairy Cattle
- 7.2.3.3. Other Ruminants
- 7.2.4. Swine
- 7.2.5. Other Animals
- 7.2.1. Aquaculture
- 7.1. Market Analysis, Insights and Forecast - by Additive
- 8. Europe USA Feed Additives Industry Analysis, Insights and Forecast, 2019-2031
- 8.1. Market Analysis, Insights and Forecast - by Additive
- 8.1.1. Acidifiers
- 8.1.1.1. By Sub Additive
- 8.1.1.1.1. Fumaric Acid
- 8.1.1.1.2. Lactic Acid
- 8.1.1.1.3. Propionic Acid
- 8.1.1.1.4. Other Acidifiers
- 8.1.1.1. By Sub Additive
- 8.1.2. Amino Acids
- 8.1.2.1. Lysine
- 8.1.2.2. Methionine
- 8.1.2.3. Threonine
- 8.1.2.4. Tryptophan
- 8.1.2.5. Other Amino Acids
- 8.1.3. Antioxidants
- 8.1.3.1. Butylated Hydroxyanisole (BHA)
- 8.1.3.2. Butylated Hydroxytoluene (BHT)
- 8.1.3.3. Citric Acid
- 8.1.3.4. Ethoxyquin
- 8.1.3.5. Propyl Gallate
- 8.1.3.6. Tocopherols
- 8.1.3.7. Other Antioxidants
- 8.1.4. Binders
- 8.1.4.1. Natural Binders
- 8.1.4.2. Synthetic Binders
- 8.1.5. Enzymes
- 8.1.5.1. Carbohydrases
- 8.1.5.2. Phytases
- 8.1.5.3. Other Enzymes
- 8.1.6. Flavors & Sweeteners
- 8.1.7. Minerals
- 8.1.7.1. Macrominerals
- 8.1.7.2. Microminerals
- 8.1.8. Mycotoxin Detoxifiers
- 8.1.8.1. Biotransformers
- 8.1.9. Phytogenics
- 8.1.9.1. Essential Oil
- 8.1.9.2. Herbs & Spices
- 8.1.9.3. Other Phytogenics
- 8.1.10. Pigments
- 8.1.10.1. Carotenoids
- 8.1.10.2. Curcumin & Spirulina
- 8.1.11. Prebiotics
- 8.1.11.1. Fructo Oligosaccharides
- 8.1.11.2. Galacto Oligosaccharides
- 8.1.11.3. Inulin
- 8.1.11.4. Lactulose
- 8.1.11.5. Mannan Oligosaccharides
- 8.1.11.6. Xylo Oligosaccharides
- 8.1.11.7. Other Prebiotics
- 8.1.12. Probiotics
- 8.1.12.1. Bifidobacteria
- 8.1.12.2. Enterococcus
- 8.1.12.3. Lactobacilli
- 8.1.12.4. Pediococcus
- 8.1.12.5. Streptococcus
- 8.1.12.6. Other Probiotics
- 8.1.13. Vitamins
- 8.1.13.1. Vitamin A
- 8.1.13.2. Vitamin B
- 8.1.13.3. Vitamin C
- 8.1.13.4. Vitamin E
- 8.1.13.5. Other Vitamins
- 8.1.14. Yeast
- 8.1.14.1. Live Yeast
- 8.1.14.2. Selenium Yeast
- 8.1.14.3. Spent Yeast
- 8.1.14.4. Torula Dried Yeast
- 8.1.14.5. Whey Yeast
- 8.1.14.6. Yeast Derivatives
- 8.1.1. Acidifiers
- 8.2. Market Analysis, Insights and Forecast - by Animal
- 8.2.1. Aquaculture
- 8.2.1.1. By Sub Animal
- 8.2.1.1.1. Fish
- 8.2.1.1.2. Shrimp
- 8.2.1.1.3. Other Aquaculture Species
- 8.2.1.1. By Sub Animal
- 8.2.2. Poultry
- 8.2.2.1. Broiler
- 8.2.2.2. Layer
- 8.2.2.3. Other Poultry Birds
- 8.2.3. Ruminants
- 8.2.3.1. Beef Cattle
- 8.2.3.2. Dairy Cattle
- 8.2.3.3. Other Ruminants
- 8.2.4. Swine
- 8.2.5. Other Animals
- 8.2.1. Aquaculture
- 8.1. Market Analysis, Insights and Forecast - by Additive
- 9. Middle East & Africa USA Feed Additives Industry Analysis, Insights and Forecast, 2019-2031
- 9.1. Market Analysis, Insights and Forecast - by Additive
- 9.1.1. Acidifiers
- 9.1.1.1. By Sub Additive
- 9.1.1.1.1. Fumaric Acid
- 9.1.1.1.2. Lactic Acid
- 9.1.1.1.3. Propionic Acid
- 9.1.1.1.4. Other Acidifiers
- 9.1.1.1. By Sub Additive
- 9.1.2. Amino Acids
- 9.1.2.1. Lysine
- 9.1.2.2. Methionine
- 9.1.2.3. Threonine
- 9.1.2.4. Tryptophan
- 9.1.2.5. Other Amino Acids
- 9.1.3. Antioxidants
- 9.1.3.1. Butylated Hydroxyanisole (BHA)
- 9.1.3.2. Butylated Hydroxytoluene (BHT)
- 9.1.3.3. Citric Acid
- 9.1.3.4. Ethoxyquin
- 9.1.3.5. Propyl Gallate
- 9.1.3.6. Tocopherols
- 9.1.3.7. Other Antioxidants
- 9.1.4. Binders
- 9.1.4.1. Natural Binders
- 9.1.4.2. Synthetic Binders
- 9.1.5. Enzymes
- 9.1.5.1. Carbohydrases
- 9.1.5.2. Phytases
- 9.1.5.3. Other Enzymes
- 9.1.6. Flavors & Sweeteners
- 9.1.7. Minerals
- 9.1.7.1. Macrominerals
- 9.1.7.2. Microminerals
- 9.1.8. Mycotoxin Detoxifiers
- 9.1.8.1. Biotransformers
- 9.1.9. Phytogenics
- 9.1.9.1. Essential Oil
- 9.1.9.2. Herbs & Spices
- 9.1.9.3. Other Phytogenics
- 9.1.10. Pigments
- 9.1.10.1. Carotenoids
- 9.1.10.2. Curcumin & Spirulina
- 9.1.11. Prebiotics
- 9.1.11.1. Fructo Oligosaccharides
- 9.1.11.2. Galacto Oligosaccharides
- 9.1.11.3. Inulin
- 9.1.11.4. Lactulose
- 9.1.11.5. Mannan Oligosaccharides
- 9.1.11.6. Xylo Oligosaccharides
- 9.1.11.7. Other Prebiotics
- 9.1.12. Probiotics
- 9.1.12.1. Bifidobacteria
- 9.1.12.2. Enterococcus
- 9.1.12.3. Lactobacilli
- 9.1.12.4. Pediococcus
- 9.1.12.5. Streptococcus
- 9.1.12.6. Other Probiotics
- 9.1.13. Vitamins
- 9.1.13.1. Vitamin A
- 9.1.13.2. Vitamin B
- 9.1.13.3. Vitamin C
- 9.1.13.4. Vitamin E
- 9.1.13.5. Other Vitamins
- 9.1.14. Yeast
- 9.1.14.1. Live Yeast
- 9.1.14.2. Selenium Yeast
- 9.1.14.3. Spent Yeast
- 9.1.14.4. Torula Dried Yeast
- 9.1.14.5. Whey Yeast
- 9.1.14.6. Yeast Derivatives
- 9.1.1. Acidifiers
- 9.2. Market Analysis, Insights and Forecast - by Animal
- 9.2.1. Aquaculture
- 9.2.1.1. By Sub Animal
- 9.2.1.1.1. Fish
- 9.2.1.1.2. Shrimp
- 9.2.1.1.3. Other Aquaculture Species
- 9.2.1.1. By Sub Animal
- 9.2.2. Poultry
- 9.2.2.1. Broiler
- 9.2.2.2. Layer
- 9.2.2.3. Other Poultry Birds
- 9.2.3. Ruminants
- 9.2.3.1. Beef Cattle
- 9.2.3.2. Dairy Cattle
- 9.2.3.3. Other Ruminants
- 9.2.4. Swine
- 9.2.5. Other Animals
- 9.2.1. Aquaculture
- 9.1. Market Analysis, Insights and Forecast - by Additive
- 10. Asia Pacific USA Feed Additives Industry Analysis, Insights and Forecast, 2019-2031
- 10.1. Market Analysis, Insights and Forecast - by Additive
- 10.1.1. Acidifiers
- 10.1.1.1. By Sub Additive
- 10.1.1.1.1. Fumaric Acid
- 10.1.1.1.2. Lactic Acid
- 10.1.1.1.3. Propionic Acid
- 10.1.1.1.4. Other Acidifiers
- 10.1.1.1. By Sub Additive
- 10.1.2. Amino Acids
- 10.1.2.1. Lysine
- 10.1.2.2. Methionine
- 10.1.2.3. Threonine
- 10.1.2.4. Tryptophan
- 10.1.2.5. Other Amino Acids
- 10.1.3. Antioxidants
- 10.1.3.1. Butylated Hydroxyanisole (BHA)
- 10.1.3.2. Butylated Hydroxytoluene (BHT)
- 10.1.3.3. Citric Acid
- 10.1.3.4. Ethoxyquin
- 10.1.3.5. Propyl Gallate
- 10.1.3.6. Tocopherols
- 10.1.3.7. Other Antioxidants
- 10.1.4. Binders
- 10.1.4.1. Natural Binders
- 10.1.4.2. Synthetic Binders
- 10.1.5. Enzymes
- 10.1.5.1. Carbohydrases
- 10.1.5.2. Phytases
- 10.1.5.3. Other Enzymes
- 10.1.6. Flavors & Sweeteners
- 10.1.7. Minerals
- 10.1.7.1. Macrominerals
- 10.1.7.2. Microminerals
- 10.1.8. Mycotoxin Detoxifiers
- 10.1.8.1. Biotransformers
- 10.1.9. Phytogenics
- 10.1.9.1. Essential Oil
- 10.1.9.2. Herbs & Spices
- 10.1.9.3. Other Phytogenics
- 10.1.10. Pigments
- 10.1.10.1. Carotenoids
- 10.1.10.2. Curcumin & Spirulina
- 10.1.11. Prebiotics
- 10.1.11.1. Fructo Oligosaccharides
- 10.1.11.2. Galacto Oligosaccharides
- 10.1.11.3. Inulin
- 10.1.11.4. Lactulose
- 10.1.11.5. Mannan Oligosaccharides
- 10.1.11.6. Xylo Oligosaccharides
- 10.1.11.7. Other Prebiotics
- 10.1.12. Probiotics
- 10.1.12.1. Bifidobacteria
- 10.1.12.2. Enterococcus
- 10.1.12.3. Lactobacilli
- 10.1.12.4. Pediococcus
- 10.1.12.5. Streptococcus
- 10.1.12.6. Other Probiotics
- 10.1.13. Vitamins
- 10.1.13.1. Vitamin A
- 10.1.13.2. Vitamin B
- 10.1.13.3. Vitamin C
- 10.1.13.4. Vitamin E
- 10.1.13.5. Other Vitamins
- 10.1.14. Yeast
- 10.1.14.1. Live Yeast
- 10.1.14.2. Selenium Yeast
- 10.1.14.3. Spent Yeast
- 10.1.14.4. Torula Dried Yeast
- 10.1.14.5. Whey Yeast
- 10.1.14.6. Yeast Derivatives
- 10.1.1. Acidifiers
- 10.2. Market Analysis, Insights and Forecast - by Animal
- 10.2.1. Aquaculture
- 10.2.1.1. By Sub Animal
- 10.2.1.1.1. Fish
- 10.2.1.1.2. Shrimp
- 10.2.1.1.3. Other Aquaculture Species
- 10.2.1.1. By Sub Animal
- 10.2.2. Poultry
- 10.2.2.1. Broiler
- 10.2.2.2. Layer
- 10.2.2.3. Other Poultry Birds
- 10.2.3. Ruminants
- 10.2.3.1. Beef Cattle
- 10.2.3.2. Dairy Cattle
- 10.2.3.3. Other Ruminants
- 10.2.4. Swine
- 10.2.5. Other Animals
- 10.2.1. Aquaculture
- 10.1. Market Analysis, Insights and Forecast - by Additive
- 11. Northeast USA Feed Additives Industry Analysis, Insights and Forecast, 2019-2031
- 12. Southeast USA Feed Additives Industry Analysis, Insights and Forecast, 2019-2031
- 13. Midwest USA Feed Additives Industry Analysis, Insights and Forecast, 2019-2031
- 14. Southwest USA Feed Additives Industry Analysis, Insights and Forecast, 2019-2031
- 15. West USA Feed Additives Industry Analysis, Insights and Forecast, 2019-2031
- 16. Competitive Analysis
- 16.1. Global Market Share Analysis 2024
- 16.2. Company Profiles
- 16.2.1 DSM Nutritional Products AG
- 16.2.1.1. Overview
- 16.2.1.2. Products
- 16.2.1.3. SWOT Analysis
- 16.2.1.4. Recent Developments
- 16.2.1.5. Financials (Based on Availability)
- 16.2.2 Elanco Animal Health Inc
- 16.2.2.1. Overview
- 16.2.2.2. Products
- 16.2.2.3. SWOT Analysis
- 16.2.2.4. Recent Developments
- 16.2.2.5. Financials (Based on Availability)
- 16.2.3 SHV (Nutreco NV
- 16.2.3.1. Overview
- 16.2.3.2. Products
- 16.2.3.3. SWOT Analysis
- 16.2.3.4. Recent Developments
- 16.2.3.5. Financials (Based on Availability)
- 16.2.4 Land O'Lakes
- 16.2.4.1. Overview
- 16.2.4.2. Products
- 16.2.4.3. SWOT Analysis
- 16.2.4.4. Recent Developments
- 16.2.4.5. Financials (Based on Availability)
- 16.2.5 Archer Daniel Midland Co
- 16.2.5.1. Overview
- 16.2.5.2. Products
- 16.2.5.3. SWOT Analysis
- 16.2.5.4. Recent Developments
- 16.2.5.5. Financials (Based on Availability)
- 16.2.6 BASF SE
- 16.2.6.1. Overview
- 16.2.6.2. Products
- 16.2.6.3. SWOT Analysis
- 16.2.6.4. Recent Developments
- 16.2.6.5. Financials (Based on Availability)
- 16.2.7 Alltech Inc
- 16.2.7.1. Overview
- 16.2.7.2. Products
- 16.2.7.3. SWOT Analysis
- 16.2.7.4. Recent Developments
- 16.2.7.5. Financials (Based on Availability)
- 16.2.8 Cargill Inc
- 16.2.8.1. Overview
- 16.2.8.2. Products
- 16.2.8.3. SWOT Analysis
- 16.2.8.4. Recent Developments
- 16.2.8.5. Financials (Based on Availability)
- 16.2.9 IFF(Danisco Animal Nutrition)
- 16.2.9.1. Overview
- 16.2.9.2. Products
- 16.2.9.3. SWOT Analysis
- 16.2.9.4. Recent Developments
- 16.2.9.5. Financials (Based on Availability)
- 16.2.10 Adisseo
- 16.2.10.1. Overview
- 16.2.10.2. Products
- 16.2.10.3. SWOT Analysis
- 16.2.10.4. Recent Developments
- 16.2.10.5. Financials (Based on Availability)
- 16.2.1 DSM Nutritional Products AG
List of Figures
- Figure 1: Global USA Feed Additives Industry Revenue Breakdown (Million, %) by Region 2024 & 2032
- Figure 2: United states USA Feed Additives Industry Revenue (Million), by Country 2024 & 2032
- Figure 3: United states USA Feed Additives Industry Revenue Share (%), by Country 2024 & 2032
- Figure 4: North America USA Feed Additives Industry Revenue (Million), by Additive 2024 & 2032
- Figure 5: North America USA Feed Additives Industry Revenue Share (%), by Additive 2024 & 2032
- Figure 6: North America USA Feed Additives Industry Revenue (Million), by Animal 2024 & 2032
- Figure 7: North America USA Feed Additives Industry Revenue Share (%), by Animal 2024 & 2032
- Figure 8: North America USA Feed Additives Industry Revenue (Million), by Country 2024 & 2032
- Figure 9: North America USA Feed Additives Industry Revenue Share (%), by Country 2024 & 2032
- Figure 10: South America USA Feed Additives Industry Revenue (Million), by Additive 2024 & 2032
- Figure 11: South America USA Feed Additives Industry Revenue Share (%), by Additive 2024 & 2032
- Figure 12: South America USA Feed Additives Industry Revenue (Million), by Animal 2024 & 2032
- Figure 13: South America USA Feed Additives Industry Revenue Share (%), by Animal 2024 & 2032
- Figure 14: South America USA Feed Additives Industry Revenue (Million), by Country 2024 & 2032
- Figure 15: South America USA Feed Additives Industry Revenue Share (%), by Country 2024 & 2032
- Figure 16: Europe USA Feed Additives Industry Revenue (Million), by Additive 2024 & 2032
- Figure 17: Europe USA Feed Additives Industry Revenue Share (%), by Additive 2024 & 2032
- Figure 18: Europe USA Feed Additives Industry Revenue (Million), by Animal 2024 & 2032
- Figure 19: Europe USA Feed Additives Industry Revenue Share (%), by Animal 2024 & 2032
- Figure 20: Europe USA Feed Additives Industry Revenue (Million), by Country 2024 & 2032
- Figure 21: Europe USA Feed Additives Industry Revenue Share (%), by Country 2024 & 2032
- Figure 22: Middle East & Africa USA Feed Additives Industry Revenue (Million), by Additive 2024 & 2032
- Figure 23: Middle East & Africa USA Feed Additives Industry Revenue Share (%), by Additive 2024 & 2032
- Figure 24: Middle East & Africa USA Feed Additives Industry Revenue (Million), by Animal 2024 & 2032
- Figure 25: Middle East & Africa USA Feed Additives Industry Revenue Share (%), by Animal 2024 & 2032
- Figure 26: Middle East & Africa USA Feed Additives Industry Revenue (Million), by Country 2024 & 2032
- Figure 27: Middle East & Africa USA Feed Additives Industry Revenue Share (%), by Country 2024 & 2032
- Figure 28: Asia Pacific USA Feed Additives Industry Revenue (Million), by Additive 2024 & 2032
- Figure 29: Asia Pacific USA Feed Additives Industry Revenue Share (%), by Additive 2024 & 2032
- Figure 30: Asia Pacific USA Feed Additives Industry Revenue (Million), by Animal 2024 & 2032
- Figure 31: Asia Pacific USA Feed Additives Industry Revenue Share (%), by Animal 2024 & 2032
- Figure 32: Asia Pacific USA Feed Additives Industry Revenue (Million), by Country 2024 & 2032
- Figure 33: Asia Pacific USA Feed Additives Industry Revenue Share (%), by Country 2024 & 2032
List of Tables
- Table 1: Global USA Feed Additives Industry Revenue Million Forecast, by Region 2019 & 2032
- Table 2: Global USA Feed Additives Industry Revenue Million Forecast, by Additive 2019 & 2032
- Table 3: Global USA Feed Additives Industry Revenue Million Forecast, by Animal 2019 & 2032
- Table 4: Global USA Feed Additives Industry Revenue Million Forecast, by Region 2019 & 2032
- Table 5: Global USA Feed Additives Industry Revenue Million Forecast, by Country 2019 & 2032
- Table 6: Northeast USA Feed Additives Industry Revenue (Million) Forecast, by Application 2019 & 2032
- Table 7: Southeast USA Feed Additives Industry Revenue (Million) Forecast, by Application 2019 & 2032
- Table 8: Midwest USA Feed Additives Industry Revenue (Million) Forecast, by Application 2019 & 2032
- Table 9: Southwest USA Feed Additives Industry Revenue (Million) Forecast, by Application 2019 & 2032
- Table 10: West USA Feed Additives Industry Revenue (Million) Forecast, by Application 2019 & 2032
- Table 11: Global USA Feed Additives Industry Revenue Million Forecast, by Additive 2019 & 2032
- Table 12: Global USA Feed Additives Industry Revenue Million Forecast, by Animal 2019 & 2032
- Table 13: Global USA Feed Additives Industry Revenue Million Forecast, by Country 2019 & 2032
- Table 14: United States USA Feed Additives Industry Revenue (Million) Forecast, by Application 2019 & 2032
- Table 15: Canada USA Feed Additives Industry Revenue (Million) Forecast, by Application 2019 & 2032
- Table 16: Mexico USA Feed Additives Industry Revenue (Million) Forecast, by Application 2019 & 2032
- Table 17: Global USA Feed Additives Industry Revenue Million Forecast, by Additive 2019 & 2032
- Table 18: Global USA Feed Additives Industry Revenue Million Forecast, by Animal 2019 & 2032
- Table 19: Global USA Feed Additives Industry Revenue Million Forecast, by Country 2019 & 2032
- Table 20: Brazil USA Feed Additives Industry Revenue (Million) Forecast, by Application 2019 & 2032
- Table 21: Argentina USA Feed Additives Industry Revenue (Million) Forecast, by Application 2019 & 2032
- Table 22: Rest of South America USA Feed Additives Industry Revenue (Million) Forecast, by Application 2019 & 2032
- Table 23: Global USA Feed Additives Industry Revenue Million Forecast, by Additive 2019 & 2032
- Table 24: Global USA Feed Additives Industry Revenue Million Forecast, by Animal 2019 & 2032
- Table 25: Global USA Feed Additives Industry Revenue Million Forecast, by Country 2019 & 2032
- Table 26: United Kingdom USA Feed Additives Industry Revenue (Million) Forecast, by Application 2019 & 2032
- Table 27: Germany USA Feed Additives Industry Revenue (Million) Forecast, by Application 2019 & 2032
- Table 28: France USA Feed Additives Industry Revenue (Million) Forecast, by Application 2019 & 2032
- Table 29: Italy USA Feed Additives Industry Revenue (Million) Forecast, by Application 2019 & 2032
- Table 30: Spain USA Feed Additives Industry Revenue (Million) Forecast, by Application 2019 & 2032
- Table 31: Russia USA Feed Additives Industry Revenue (Million) Forecast, by Application 2019 & 2032
- Table 32: Benelux USA Feed Additives Industry Revenue (Million) Forecast, by Application 2019 & 2032
- Table 33: Nordics USA Feed Additives Industry Revenue (Million) Forecast, by Application 2019 & 2032
- Table 34: Rest of Europe USA Feed Additives Industry Revenue (Million) Forecast, by Application 2019 & 2032
- Table 35: Global USA Feed Additives Industry Revenue Million Forecast, by Additive 2019 & 2032
- Table 36: Global USA Feed Additives Industry Revenue Million Forecast, by Animal 2019 & 2032
- Table 37: Global USA Feed Additives Industry Revenue Million Forecast, by Country 2019 & 2032
- Table 38: Turkey USA Feed Additives Industry Revenue (Million) Forecast, by Application 2019 & 2032
- Table 39: Israel USA Feed Additives Industry Revenue (Million) Forecast, by Application 2019 & 2032
- Table 40: GCC USA Feed Additives Industry Revenue (Million) Forecast, by Application 2019 & 2032
- Table 41: North Africa USA Feed Additives Industry Revenue (Million) Forecast, by Application 2019 & 2032
- Table 42: South Africa USA Feed Additives Industry Revenue (Million) Forecast, by Application 2019 & 2032
- Table 43: Rest of Middle East & Africa USA Feed Additives Industry Revenue (Million) Forecast, by Application 2019 & 2032
- Table 44: Global USA Feed Additives Industry Revenue Million Forecast, by Additive 2019 & 2032
- Table 45: Global USA Feed Additives Industry Revenue Million Forecast, by Animal 2019 & 2032
- Table 46: Global USA Feed Additives Industry Revenue Million Forecast, by Country 2019 & 2032
- Table 47: China USA Feed Additives Industry Revenue (Million) Forecast, by Application 2019 & 2032
- Table 48: India USA Feed Additives Industry Revenue (Million) Forecast, by Application 2019 & 2032
- Table 49: Japan USA Feed Additives Industry Revenue (Million) Forecast, by Application 2019 & 2032
- Table 50: South Korea USA Feed Additives Industry Revenue (Million) Forecast, by Application 2019 & 2032
- Table 51: ASEAN USA Feed Additives Industry Revenue (Million) Forecast, by Application 2019 & 2032
- Table 52: Oceania USA Feed Additives Industry Revenue (Million) Forecast, by Application 2019 & 2032
- Table 53: Rest of Asia Pacific USA Feed Additives Industry Revenue (Million) Forecast, by Application 2019 & 2032
Frequently Asked Questions
1. What is the projected Compound Annual Growth Rate (CAGR) of the USA Feed Additives Industry?
The projected CAGR is approximately 6.40%.
2. Which companies are prominent players in the USA Feed Additives Industry?
Key companies in the market include DSM Nutritional Products AG, Elanco Animal Health Inc, SHV (Nutreco NV, Land O'Lakes, Archer Daniel Midland Co, BASF SE, Alltech Inc, Cargill Inc, IFF(Danisco Animal Nutrition), Adisseo.
3. What are the main segments of the USA Feed Additives Industry?
The market segments include Additive, Animal.
4. Can you provide details about the market size?
The market size is estimated to be USD XX Million as of 2022.
5. What are some drivers contributing to market growth?
Growing Livestock Population; Area Under Forage Production is Increasing; Increasing Demand for Animal Products.
6. What are the notable trends driving market growth?
OTHER KEY INDUSTRY TRENDS COVERED IN THE REPORT.
7. Are there any restraints impacting market growth?
Competition Amongst Industries and High Input Prices; Growing Shift Toward Vegan-Based Diet.
8. Can you provide examples of recent developments in the market?
December 2022: Adisseo group had agreed to acquire Nor-Feed and its subsidiaries to develop and register botanical additives for use in animal feed.June 2022: Delacon and Cargill collaborated to establish a global plant-based phytogenic feed additives business for enhanced animal nutrition. The partnership has helped in extensive feed additives expertise as well as an increase in the global presence.April 2022: A strategic partnership has been made between Elanco and Royal DSM for Bovaer, an innovative, methane-reducing feed additive for cattle.
9. What pricing options are available for accessing the report?
Pricing options include single-user, multi-user, and enterprise licenses priced at USD 3800, USD 4500, and USD 5800 respectively.
10. Is the market size provided in terms of value or volume?
The market size is provided in terms of value, measured in Million.
11. Are there any specific market keywords associated with the report?
Yes, the market keyword associated with the report is "USA Feed Additives Industry," which aids in identifying and referencing the specific market segment covered.
12. How do I determine which pricing option suits my needs best?
The pricing options vary based on user requirements and access needs. Individual users may opt for single-user licenses, while businesses requiring broader access may choose multi-user or enterprise licenses for cost-effective access to the report.
13. Are there any additional resources or data provided in the USA Feed Additives Industry report?
While the report offers comprehensive insights, it's advisable to review the specific contents or supplementary materials provided to ascertain if additional resources or data are available.
14. How can I stay updated on further developments or reports in the USA Feed Additives Industry?
To stay informed about further developments, trends, and reports in the USA Feed Additives Industry, consider subscribing to industry newsletters, following relevant companies and organizations, or regularly checking reputable industry news sources and publications.
Methodology
Step 1 - Identification of Relevant Samples Size from Population Database


Step 2 - Approaches for Defining Global Market Size (Value, Volume* & Price*)

Note*: In applicable scenarios
Step 3 - Data Sources
Primary Research
- Web Analytics
- Survey Reports
- Research Institute
- Latest Research Reports
- Opinion Leaders
Secondary Research
- Annual Reports
- White Paper
- Latest Press Release
- Industry Association
- Paid Database
- Investor Presentations

Step 4 - Data Triangulation
Involves using different sources of information in order to increase the validity of a study
These sources are likely to be stakeholders in a program - participants, other researchers, program staff, other community members, and so on.
Then we put all data in single framework & apply various statistical tools to find out the dynamic on the market.
During the analysis stage, feedback from the stakeholder groups would be compared to determine areas of agreement as well as areas of divergence
