

Key Insights
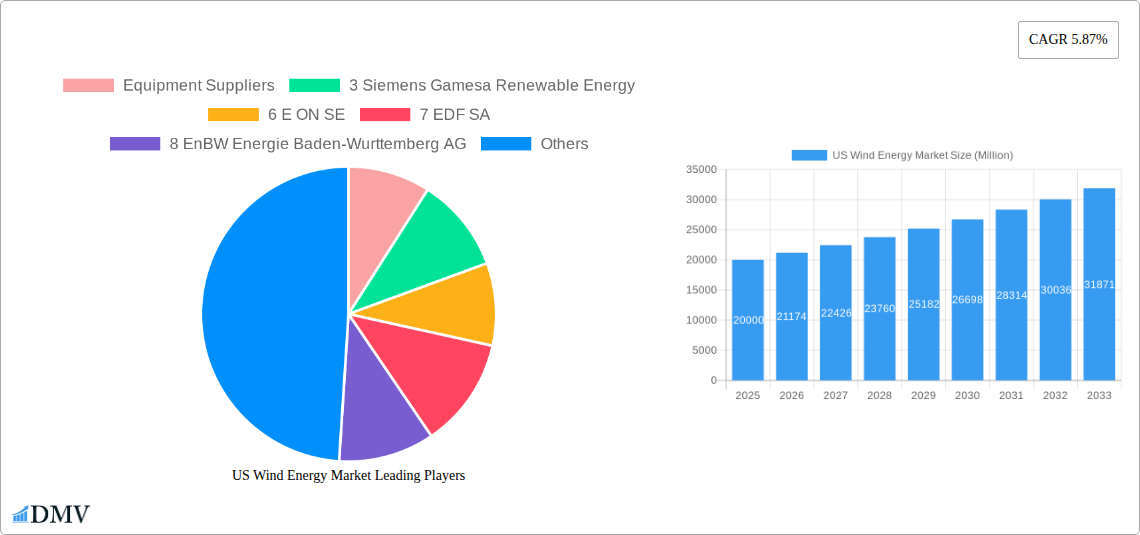
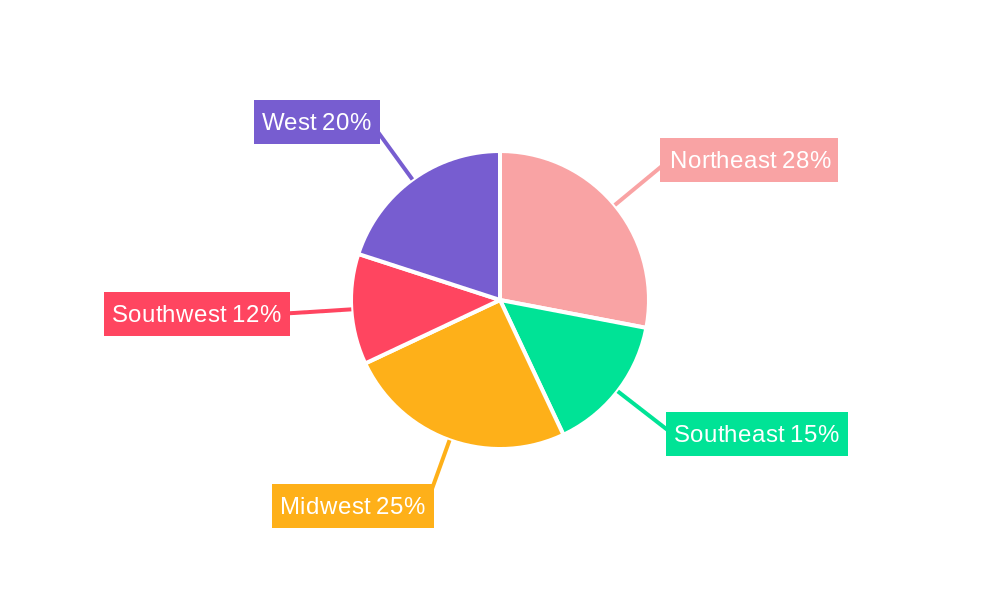
The US wind energy market, currently experiencing robust growth, is projected to maintain a significant expansion trajectory throughout the forecast period (2025-2033). A Compound Annual Growth Rate (CAGR) of 5.87% indicates a substantial increase in market value, driven primarily by increasing demand for renewable energy sources to combat climate change and meet stringent emission reduction targets. Government incentives, such as tax credits and subsidies, are further fueling this expansion, along with advancements in wind turbine technology leading to increased efficiency and lower costs. The onshore segment currently dominates the market due to established infrastructure and lower development costs, although the offshore segment is anticipated to witness accelerated growth in the coming years, fueled by technological breakthroughs and favorable policy support. Key players, including Siemens Gamesa, Vestas, General Electric, and Orsted, are actively investing in research and development, and expanding their operational capacity to capitalize on market opportunities. The geographic distribution of wind energy projects shows significant activity across various regions, with the Northeast, West, and Midwest currently leading the way, driven by suitable wind resources and supportive regulatory frameworks. Competitive pressures amongst equipment suppliers and wind farm operators continue to drive innovation and cost reductions, ultimately benefiting consumers and accelerating the wider adoption of wind energy.
The market segmentation reveals a dynamic landscape. While onshore projects currently lead in terms of market share due to established infrastructure and cost-effectiveness, the offshore wind segment presents a significant growth opportunity. The considerable investment needed for offshore infrastructure initially restricts its growth but advancements in technology, coupled with supportive government policies aimed at promoting offshore energy development, are projected to significantly increase the offshore segment's contribution to the overall market in the coming decade. Regional variations reflect differing regulatory environments, wind resource availability, and grid infrastructure. However, across all regions, the growth trajectory is expected to be strongly positive, influenced by the overarching national push toward renewable energy sources and a growing awareness of climate change amongst both the public and policymakers. Continued technological improvements, along with a stable policy framework, are crucial to ensuring the sustained and predictable expansion of the US wind energy market.
US Wind Energy Market: A Comprehensive Report (2019-2033)
This insightful report provides a detailed analysis of the US wind energy market, offering a comprehensive overview of market dynamics, key players, and future growth prospects. The study period spans from 2019 to 2033, with 2025 serving as both the base and estimated year. This report is essential for stakeholders seeking to understand the current landscape and navigate the future of this rapidly evolving sector. The report delves into market segmentation, technological advancements, and competitive analysis, providing invaluable data and insights for strategic decision-making.
US Wind Energy Market Composition & Trends
This section evaluates the competitive landscape of the US wind energy market, exploring market concentration, innovation drivers, regulatory influences, substitute technologies, end-user profiles, and mergers and acquisitions (M&A) activity. We analyze market share distribution amongst key players and provide insights into the financial aspects of M&A deals. The analysis covers the historical period (2019-2024) and extends to the forecast period (2025-2033).
- Market Concentration: The US wind energy market exhibits a moderately concentrated structure, with several major players dominating different segments (e.g., equipment supply, wind farm operation). Further analysis within the report will detail market share distribution among key companies.
- Innovation Catalysts: Government incentives, technological advancements (e.g., larger turbine sizes, improved energy storage), and the growing demand for renewable energy are key innovation drivers.
- Regulatory Landscape: Federal and state-level policies, including renewable portfolio standards (RPS) and tax credits, significantly influence market growth and investment decisions.
- Substitute Products: While solar power is a primary competitor, wind energy's cost competitiveness and suitability for various locations secure its position in the renewable energy mix.
- End-User Profiles: The report categorizes end-users, including utilities, independent power producers (IPPs), and corporations, analyzing their specific needs and market contributions.
- M&A Activities: The report details significant M&A transactions in the US wind energy market, analyzing deal values (e.g., Equinor's USD 1.1 Billion deal with BP) and their impact on market consolidation and competitiveness. The total value of M&A transactions during the study period is estimated to be around xx Million.
US Wind Energy Market Industry Evolution
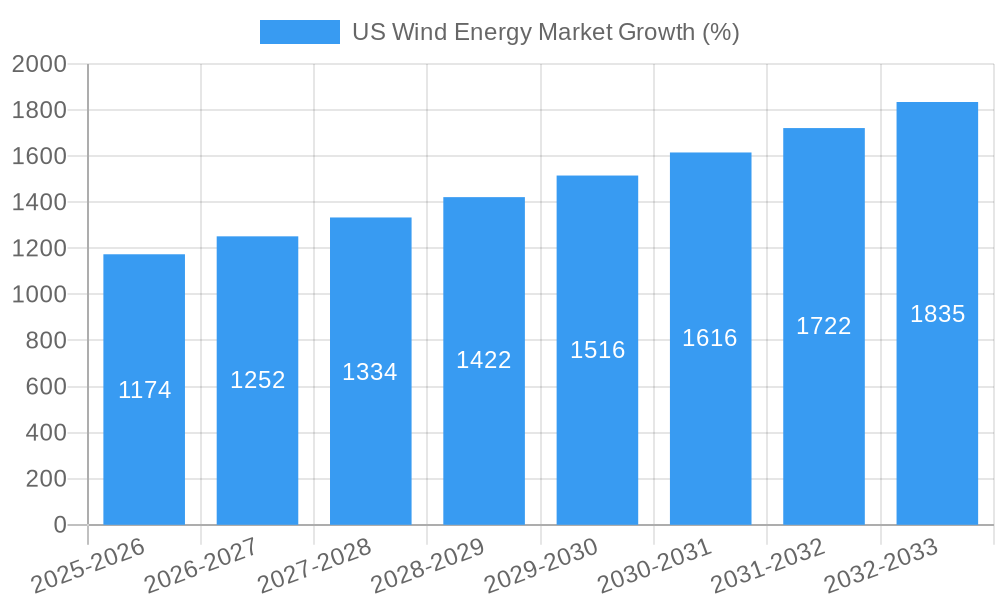
This section offers a comprehensive overview of the US wind energy market's growth trajectory, highlighting technological advancements and evolving consumer demands. The analysis examines historical trends and projects future growth based on current market dynamics and expected advancements. Specific data points on growth rates and technology adoption rates are provided to support the analysis. Growth is anticipated to continue at a CAGR of xx% during the forecast period (2025-2033), driven by factors detailed later in this report.
Leading Regions, Countries, or Segments in US Wind Energy Market
This section identifies the dominant regions and segments (onshore vs. offshore) within the US wind energy market, providing a detailed analysis of the key factors contributing to their dominance.
- Onshore Wind: Remains the dominant segment due to lower development costs and established infrastructure.
- Key Drivers: Abundant land availability in suitable regions, established supply chains, and supportive state-level policies.
- Offshore Wind: Experiencing rapid growth, driven by technological advancements and increasing government support. The substantial potential for offshore wind farm development along the US East Coast is a major contributor.
- Key Drivers: Federal support through tax credits and lease auctions, technological advancements reducing installation costs, and higher capacity factors compared to onshore wind farms. Large-scale projects such as Equinor’s Empire Wind project are boosting this sector's growth.
US Wind Energy Market Product Innovations
The US wind energy market witnesses continuous product innovation, focusing on larger turbine capacities, improved efficiency, and enhanced operational performance. Advancements in blade design, tower technology, and control systems contribute to higher energy yields and reduced operating costs. The introduction of floating offshore wind turbines opens up new possibilities for harnessing wind resources in deeper waters. These innovations aim to increase energy output, reduce levelized cost of energy (LCOE), and improve overall system reliability.
Propelling Factors for US Wind Energy Market Growth
Several factors drive the growth of the US wind energy market. Government policies, such as the Investment Tax Credit (ITC) and Production Tax Credit (PTC), provide crucial financial incentives. Falling technology costs and increased efficiency make wind energy increasingly competitive with traditional power sources. Growing environmental concerns and the need to mitigate climate change boost the demand for renewable energy sources. The increasing reliability and integration capabilities of wind energy further contribute to this growth.
Obstacles in the US Wind Energy Market
Despite its significant growth potential, the US wind energy market faces challenges. Permitting processes can be lengthy and complex, leading to project delays. Intermittency issues associated with wind energy require effective grid management solutions and potentially energy storage technologies. Supply chain disruptions can affect project timelines and costs. Competition from other renewable energy sources and fossil fuels also pose challenges.
Future Opportunities in US Wind Energy Market
The US wind energy market offers numerous future opportunities. Offshore wind holds immense potential, particularly along the East Coast. Technological advancements, such as improved energy storage solutions and smart grids, enhance the integration of wind energy. The integration of wind energy into microgrids for increased grid resilience offers another promising avenue for future growth. Government policies continuing to support renewable energy will ensure a continued growth trajectory.
Major Players in the US Wind Energy Market Ecosystem
Equipment Suppliers:
Wind Farm Operators:
- NextEra Energy Inc
- Acciona Energia SA
- Duke Energy Corporation
Key Developments in US Wind Energy Market Industry
- October 2020: Equinor announces the Empire wind project (816MW), scheduled for commissioning by 2024.
- September 2020: Equinor sells a 50% stake in the Empire wind project and a 50% stake in the Beacon wind project to BP PLC for USD 1.1 Billion.
Strategic US Wind Energy Market Forecast
The US wind energy market is poised for continued robust growth, driven by strong government support, technological advancements, and increasing demand for clean energy. Offshore wind will play a significant role in this growth, unlocking vast untapped resources. Continued innovation in turbine technology, energy storage, and grid integration will further enhance the competitiveness and reliability of wind energy, solidifying its position as a cornerstone of the US energy transition. The market is expected to reach xx Million by 2033.
US Wind Energy Market Segmentation
- 1. Onshore
- 2. Offshore
US Wind Energy Market Segmentation By Geography
-
1. North America
- 1.1. United States
- 1.2. Canada
- 1.3. Mexico
-
2. South America
- 2.1. Brazil
- 2.2. Argentina
- 2.3. Rest of South America
-
3. Europe
- 3.1. United Kingdom
- 3.2. Germany
- 3.3. France
- 3.4. Italy
- 3.5. Spain
- 3.6. Russia
- 3.7. Benelux
- 3.8. Nordics
- 3.9. Rest of Europe
-
4. Middle East & Africa
- 4.1. Turkey
- 4.2. Israel
- 4.3. GCC
- 4.4. North Africa
- 4.5. South Africa
- 4.6. Rest of Middle East & Africa
-
5. Asia Pacific
- 5.1. China
- 5.2. India
- 5.3. Japan
- 5.4. South Korea
- 5.5. ASEAN
- 5.6. Oceania
- 5.7. Rest of Asia Pacific
US Wind Energy Market REPORT HIGHLIGHTS
| Aspects | Details |
|---|---|
| Study Period | 2019-2033 |
| Base Year | 2024 |
| Estimated Year | 2025 |
| Forecast Period | 2025-2033 |
| Historical Period | 2019-2024 |
| Growth Rate | CAGR of 5.87% from 2019-2033 |
| Segmentation |
|
Table of Contents
- 1. Introduction
- 1.1. Research Scope
- 1.2. Market Segmentation
- 1.3. Research Methodology
- 1.4. Definitions and Assumptions
- 2. Executive Summary
- 2.1. Introduction
- 3. Market Dynamics
- 3.1. Introduction
- 3.2. Market Drivers
- 3.2.1. 4.; Global Inclination toward Renewable-based Power Generation4.; Increased Power Demand in Line with the Increasing Population
- 3.3. Market Restrains
- 3.3.1. 4.; High Initial Cost
- 3.4. Market Trends
- 3.4.1. Onshore Segment to Dominate the Market
- 4. Market Factor Analysis
- 4.1. Porters Five Forces
- 4.2. Supply/Value Chain
- 4.3. PESTEL analysis
- 4.4. Market Entropy
- 4.5. Patent/Trademark Analysis
- 5. Global US Wind Energy Market Analysis, Insights and Forecast, 2019-2031
- 5.1. Market Analysis, Insights and Forecast - by Onshore
- 5.2. Market Analysis, Insights and Forecast - by Offshore
- 5.3. Market Analysis, Insights and Forecast - by Region
- 5.3.1. North America
- 5.3.2. South America
- 5.3.3. Europe
- 5.3.4. Middle East & Africa
- 5.3.5. Asia Pacific
- 5.1. Market Analysis, Insights and Forecast - by Onshore
- 6. North America US Wind Energy Market Analysis, Insights and Forecast, 2019-2031
- 6.1. Market Analysis, Insights and Forecast - by Onshore
- 6.2. Market Analysis, Insights and Forecast - by Offshore
- 6.1. Market Analysis, Insights and Forecast - by Onshore
- 7. South America US Wind Energy Market Analysis, Insights and Forecast, 2019-2031
- 7.1. Market Analysis, Insights and Forecast - by Onshore
- 7.2. Market Analysis, Insights and Forecast - by Offshore
- 7.1. Market Analysis, Insights and Forecast - by Onshore
- 8. Europe US Wind Energy Market Analysis, Insights and Forecast, 2019-2031
- 8.1. Market Analysis, Insights and Forecast - by Onshore
- 8.2. Market Analysis, Insights and Forecast - by Offshore
- 8.1. Market Analysis, Insights and Forecast - by Onshore
- 9. Middle East & Africa US Wind Energy Market Analysis, Insights and Forecast, 2019-2031
- 9.1. Market Analysis, Insights and Forecast - by Onshore
- 9.2. Market Analysis, Insights and Forecast - by Offshore
- 9.1. Market Analysis, Insights and Forecast - by Onshore
- 10. Asia Pacific US Wind Energy Market Analysis, Insights and Forecast, 2019-2031
- 10.1. Market Analysis, Insights and Forecast - by Onshore
- 10.2. Market Analysis, Insights and Forecast - by Offshore
- 10.1. Market Analysis, Insights and Forecast - by Onshore
- 11. Northeast US Wind Energy Market Analysis, Insights and Forecast, 2019-2031
- 12. Southeast US Wind Energy Market Analysis, Insights and Forecast, 2019-2031
- 13. Midwest US Wind Energy Market Analysis, Insights and Forecast, 2019-2031
- 14. Southwest US Wind Energy Market Analysis, Insights and Forecast, 2019-2031
- 15. West US Wind Energy Market Analysis, Insights and Forecast, 2019-2031
- 16. Competitive Analysis
- 16.1. Global Market Share Analysis 2024
- 16.2. Company Profiles
- 16.2.1 Equipment Suppliers
- 16.2.1.1. Overview
- 16.2.1.2. Products
- 16.2.1.3. SWOT Analysis
- 16.2.1.4. Recent Developments
- 16.2.1.5. Financials (Based on Availability)
- 16.2.2 3 Siemens Gamesa Renewable Energy
- 16.2.2.1. Overview
- 16.2.2.2. Products
- 16.2.2.3. SWOT Analysis
- 16.2.2.4. Recent Developments
- 16.2.2.5. Financials (Based on Availability)
- 16.2.3 6 E ON SE
- 16.2.3.1. Overview
- 16.2.3.2. Products
- 16.2.3.3. SWOT Analysis
- 16.2.3.4. Recent Developments
- 16.2.3.5. Financials (Based on Availability)
- 16.2.4 7 EDF SA
- 16.2.4.1. Overview
- 16.2.4.2. Products
- 16.2.4.3. SWOT Analysis
- 16.2.4.4. Recent Developments
- 16.2.4.5. Financials (Based on Availability)
- 16.2.5 8 EnBW Energie Baden-Wurttemberg AG
- 16.2.5.1. Overview
- 16.2.5.2. Products
- 16.2.5.3. SWOT Analysis
- 16.2.5.4. Recent Developments
- 16.2.5.5. Financials (Based on Availability)
- 16.2.6 2 General Electric Company
- 16.2.6.1. Overview
- 16.2.6.2. Products
- 16.2.6.3. SWOT Analysis
- 16.2.6.4. Recent Developments
- 16.2.6.5. Financials (Based on Availability)
- 16.2.7 1 Envision Energy
- 16.2.7.1. Overview
- 16.2.7.2. Products
- 16.2.7.3. SWOT Analysis
- 16.2.7.4. Recent Developments
- 16.2.7.5. Financials (Based on Availability)
- 16.2.8 5 Trident Winds Inc
- 16.2.8.1. Overview
- 16.2.8.2. Products
- 16.2.8.3. SWOT Analysis
- 16.2.8.4. Recent Developments
- 16.2.8.5. Financials (Based on Availability)
- 16.2.9 2 Orsted AS
- 16.2.9.1. Overview
- 16.2.9.2. Products
- 16.2.9.3. SWOT Analysis
- 16.2.9.4. Recent Developments
- 16.2.9.5. Financials (Based on Availability)
- 16.2.10 Wind Farm Operators
- 16.2.10.1. Overview
- 16.2.10.2. Products
- 16.2.10.3. SWOT Analysis
- 16.2.10.4. Recent Developments
- 16.2.10.5. Financials (Based on Availability)
- 16.2.11 4 Vestas Wind Systems AS
- 16.2.11.1. Overview
- 16.2.11.2. Products
- 16.2.11.3. SWOT Analysis
- 16.2.11.4. Recent Developments
- 16.2.11.5. Financials (Based on Availability)
- 16.2.12 4 NextEra Energy Inc
- 16.2.12.1. Overview
- 16.2.12.2. Products
- 16.2.12.3. SWOT Analysis
- 16.2.12.4. Recent Developments
- 16.2.12.5. Financials (Based on Availability)
- 16.2.13 1 Acciona Energia SA
- 16.2.13.1. Overview
- 16.2.13.2. Products
- 16.2.13.3. SWOT Analysis
- 16.2.13.4. Recent Developments
- 16.2.13.5. Financials (Based on Availability)
- 16.2.14 3 Duke Energy Corporation
- 16.2.14.1. Overview
- 16.2.14.2. Products
- 16.2.14.3. SWOT Analysis
- 16.2.14.4. Recent Developments
- 16.2.14.5. Financials (Based on Availability)
- 16.2.1 Equipment Suppliers
List of Figures
- Figure 1: Global US Wind Energy Market Revenue Breakdown (Million, %) by Region 2024 & 2032
- Figure 2: Global US Wind Energy Market Volume Breakdown (gigawatt, %) by Region 2024 & 2032
- Figure 3: United states US Wind Energy Market Revenue (Million), by Country 2024 & 2032
- Figure 4: United states US Wind Energy Market Volume (gigawatt), by Country 2024 & 2032
- Figure 5: United states US Wind Energy Market Revenue Share (%), by Country 2024 & 2032
- Figure 6: United states US Wind Energy Market Volume Share (%), by Country 2024 & 2032
- Figure 7: North America US Wind Energy Market Revenue (Million), by Onshore 2024 & 2032
- Figure 8: North America US Wind Energy Market Volume (gigawatt), by Onshore 2024 & 2032
- Figure 9: North America US Wind Energy Market Revenue Share (%), by Onshore 2024 & 2032
- Figure 10: North America US Wind Energy Market Volume Share (%), by Onshore 2024 & 2032
- Figure 11: North America US Wind Energy Market Revenue (Million), by Offshore 2024 & 2032
- Figure 12: North America US Wind Energy Market Volume (gigawatt), by Offshore 2024 & 2032
- Figure 13: North America US Wind Energy Market Revenue Share (%), by Offshore 2024 & 2032
- Figure 14: North America US Wind Energy Market Volume Share (%), by Offshore 2024 & 2032
- Figure 15: North America US Wind Energy Market Revenue (Million), by Country 2024 & 2032
- Figure 16: North America US Wind Energy Market Volume (gigawatt), by Country 2024 & 2032
- Figure 17: North America US Wind Energy Market Revenue Share (%), by Country 2024 & 2032
- Figure 18: North America US Wind Energy Market Volume Share (%), by Country 2024 & 2032
- Figure 19: South America US Wind Energy Market Revenue (Million), by Onshore 2024 & 2032
- Figure 20: South America US Wind Energy Market Volume (gigawatt), by Onshore 2024 & 2032
- Figure 21: South America US Wind Energy Market Revenue Share (%), by Onshore 2024 & 2032
- Figure 22: South America US Wind Energy Market Volume Share (%), by Onshore 2024 & 2032
- Figure 23: South America US Wind Energy Market Revenue (Million), by Offshore 2024 & 2032
- Figure 24: South America US Wind Energy Market Volume (gigawatt), by Offshore 2024 & 2032
- Figure 25: South America US Wind Energy Market Revenue Share (%), by Offshore 2024 & 2032
- Figure 26: South America US Wind Energy Market Volume Share (%), by Offshore 2024 & 2032
- Figure 27: South America US Wind Energy Market Revenue (Million), by Country 2024 & 2032
- Figure 28: South America US Wind Energy Market Volume (gigawatt), by Country 2024 & 2032
- Figure 29: South America US Wind Energy Market Revenue Share (%), by Country 2024 & 2032
- Figure 30: South America US Wind Energy Market Volume Share (%), by Country 2024 & 2032
- Figure 31: Europe US Wind Energy Market Revenue (Million), by Onshore 2024 & 2032
- Figure 32: Europe US Wind Energy Market Volume (gigawatt), by Onshore 2024 & 2032
- Figure 33: Europe US Wind Energy Market Revenue Share (%), by Onshore 2024 & 2032
- Figure 34: Europe US Wind Energy Market Volume Share (%), by Onshore 2024 & 2032
- Figure 35: Europe US Wind Energy Market Revenue (Million), by Offshore 2024 & 2032
- Figure 36: Europe US Wind Energy Market Volume (gigawatt), by Offshore 2024 & 2032
- Figure 37: Europe US Wind Energy Market Revenue Share (%), by Offshore 2024 & 2032
- Figure 38: Europe US Wind Energy Market Volume Share (%), by Offshore 2024 & 2032
- Figure 39: Europe US Wind Energy Market Revenue (Million), by Country 2024 & 2032
- Figure 40: Europe US Wind Energy Market Volume (gigawatt), by Country 2024 & 2032
- Figure 41: Europe US Wind Energy Market Revenue Share (%), by Country 2024 & 2032
- Figure 42: Europe US Wind Energy Market Volume Share (%), by Country 2024 & 2032
- Figure 43: Middle East & Africa US Wind Energy Market Revenue (Million), by Onshore 2024 & 2032
- Figure 44: Middle East & Africa US Wind Energy Market Volume (gigawatt), by Onshore 2024 & 2032
- Figure 45: Middle East & Africa US Wind Energy Market Revenue Share (%), by Onshore 2024 & 2032
- Figure 46: Middle East & Africa US Wind Energy Market Volume Share (%), by Onshore 2024 & 2032
- Figure 47: Middle East & Africa US Wind Energy Market Revenue (Million), by Offshore 2024 & 2032
- Figure 48: Middle East & Africa US Wind Energy Market Volume (gigawatt), by Offshore 2024 & 2032
- Figure 49: Middle East & Africa US Wind Energy Market Revenue Share (%), by Offshore 2024 & 2032
- Figure 50: Middle East & Africa US Wind Energy Market Volume Share (%), by Offshore 2024 & 2032
- Figure 51: Middle East & Africa US Wind Energy Market Revenue (Million), by Country 2024 & 2032
- Figure 52: Middle East & Africa US Wind Energy Market Volume (gigawatt), by Country 2024 & 2032
- Figure 53: Middle East & Africa US Wind Energy Market Revenue Share (%), by Country 2024 & 2032
- Figure 54: Middle East & Africa US Wind Energy Market Volume Share (%), by Country 2024 & 2032
- Figure 55: Asia Pacific US Wind Energy Market Revenue (Million), by Onshore 2024 & 2032
- Figure 56: Asia Pacific US Wind Energy Market Volume (gigawatt), by Onshore 2024 & 2032
- Figure 57: Asia Pacific US Wind Energy Market Revenue Share (%), by Onshore 2024 & 2032
- Figure 58: Asia Pacific US Wind Energy Market Volume Share (%), by Onshore 2024 & 2032
- Figure 59: Asia Pacific US Wind Energy Market Revenue (Million), by Offshore 2024 & 2032
- Figure 60: Asia Pacific US Wind Energy Market Volume (gigawatt), by Offshore 2024 & 2032
- Figure 61: Asia Pacific US Wind Energy Market Revenue Share (%), by Offshore 2024 & 2032
- Figure 62: Asia Pacific US Wind Energy Market Volume Share (%), by Offshore 2024 & 2032
- Figure 63: Asia Pacific US Wind Energy Market Revenue (Million), by Country 2024 & 2032
- Figure 64: Asia Pacific US Wind Energy Market Volume (gigawatt), by Country 2024 & 2032
- Figure 65: Asia Pacific US Wind Energy Market Revenue Share (%), by Country 2024 & 2032
- Figure 66: Asia Pacific US Wind Energy Market Volume Share (%), by Country 2024 & 2032
List of Tables
- Table 1: Global US Wind Energy Market Revenue Million Forecast, by Region 2019 & 2032
- Table 2: Global US Wind Energy Market Volume gigawatt Forecast, by Region 2019 & 2032
- Table 3: Global US Wind Energy Market Revenue Million Forecast, by Onshore 2019 & 2032
- Table 4: Global US Wind Energy Market Volume gigawatt Forecast, by Onshore 2019 & 2032
- Table 5: Global US Wind Energy Market Revenue Million Forecast, by Offshore 2019 & 2032
- Table 6: Global US Wind Energy Market Volume gigawatt Forecast, by Offshore 2019 & 2032
- Table 7: Global US Wind Energy Market Revenue Million Forecast, by Region 2019 & 2032
- Table 8: Global US Wind Energy Market Volume gigawatt Forecast, by Region 2019 & 2032
- Table 9: Global US Wind Energy Market Revenue Million Forecast, by Country 2019 & 2032
- Table 10: Global US Wind Energy Market Volume gigawatt Forecast, by Country 2019 & 2032
- Table 11: Northeast US Wind Energy Market Revenue (Million) Forecast, by Application 2019 & 2032
- Table 12: Northeast US Wind Energy Market Volume (gigawatt) Forecast, by Application 2019 & 2032
- Table 13: Southeast US Wind Energy Market Revenue (Million) Forecast, by Application 2019 & 2032
- Table 14: Southeast US Wind Energy Market Volume (gigawatt) Forecast, by Application 2019 & 2032
- Table 15: Midwest US Wind Energy Market Revenue (Million) Forecast, by Application 2019 & 2032
- Table 16: Midwest US Wind Energy Market Volume (gigawatt) Forecast, by Application 2019 & 2032
- Table 17: Southwest US Wind Energy Market Revenue (Million) Forecast, by Application 2019 & 2032
- Table 18: Southwest US Wind Energy Market Volume (gigawatt) Forecast, by Application 2019 & 2032
- Table 19: West US Wind Energy Market Revenue (Million) Forecast, by Application 2019 & 2032
- Table 20: West US Wind Energy Market Volume (gigawatt) Forecast, by Application 2019 & 2032
- Table 21: Global US Wind Energy Market Revenue Million Forecast, by Onshore 2019 & 2032
- Table 22: Global US Wind Energy Market Volume gigawatt Forecast, by Onshore 2019 & 2032
- Table 23: Global US Wind Energy Market Revenue Million Forecast, by Offshore 2019 & 2032
- Table 24: Global US Wind Energy Market Volume gigawatt Forecast, by Offshore 2019 & 2032
- Table 25: Global US Wind Energy Market Revenue Million Forecast, by Country 2019 & 2032
- Table 26: Global US Wind Energy Market Volume gigawatt Forecast, by Country 2019 & 2032
- Table 27: United States US Wind Energy Market Revenue (Million) Forecast, by Application 2019 & 2032
- Table 28: United States US Wind Energy Market Volume (gigawatt) Forecast, by Application 2019 & 2032
- Table 29: Canada US Wind Energy Market Revenue (Million) Forecast, by Application 2019 & 2032
- Table 30: Canada US Wind Energy Market Volume (gigawatt) Forecast, by Application 2019 & 2032
- Table 31: Mexico US Wind Energy Market Revenue (Million) Forecast, by Application 2019 & 2032
- Table 32: Mexico US Wind Energy Market Volume (gigawatt) Forecast, by Application 2019 & 2032
- Table 33: Global US Wind Energy Market Revenue Million Forecast, by Onshore 2019 & 2032
- Table 34: Global US Wind Energy Market Volume gigawatt Forecast, by Onshore 2019 & 2032
- Table 35: Global US Wind Energy Market Revenue Million Forecast, by Offshore 2019 & 2032
- Table 36: Global US Wind Energy Market Volume gigawatt Forecast, by Offshore 2019 & 2032
- Table 37: Global US Wind Energy Market Revenue Million Forecast, by Country 2019 & 2032
- Table 38: Global US Wind Energy Market Volume gigawatt Forecast, by Country 2019 & 2032
- Table 39: Brazil US Wind Energy Market Revenue (Million) Forecast, by Application 2019 & 2032
- Table 40: Brazil US Wind Energy Market Volume (gigawatt) Forecast, by Application 2019 & 2032
- Table 41: Argentina US Wind Energy Market Revenue (Million) Forecast, by Application 2019 & 2032
- Table 42: Argentina US Wind Energy Market Volume (gigawatt) Forecast, by Application 2019 & 2032
- Table 43: Rest of South America US Wind Energy Market Revenue (Million) Forecast, by Application 2019 & 2032
- Table 44: Rest of South America US Wind Energy Market Volume (gigawatt) Forecast, by Application 2019 & 2032
- Table 45: Global US Wind Energy Market Revenue Million Forecast, by Onshore 2019 & 2032
- Table 46: Global US Wind Energy Market Volume gigawatt Forecast, by Onshore 2019 & 2032
- Table 47: Global US Wind Energy Market Revenue Million Forecast, by Offshore 2019 & 2032
- Table 48: Global US Wind Energy Market Volume gigawatt Forecast, by Offshore 2019 & 2032
- Table 49: Global US Wind Energy Market Revenue Million Forecast, by Country 2019 & 2032
- Table 50: Global US Wind Energy Market Volume gigawatt Forecast, by Country 2019 & 2032
- Table 51: United Kingdom US Wind Energy Market Revenue (Million) Forecast, by Application 2019 & 2032
- Table 52: United Kingdom US Wind Energy Market Volume (gigawatt) Forecast, by Application 2019 & 2032
- Table 53: Germany US Wind Energy Market Revenue (Million) Forecast, by Application 2019 & 2032
- Table 54: Germany US Wind Energy Market Volume (gigawatt) Forecast, by Application 2019 & 2032
- Table 55: France US Wind Energy Market Revenue (Million) Forecast, by Application 2019 & 2032
- Table 56: France US Wind Energy Market Volume (gigawatt) Forecast, by Application 2019 & 2032
- Table 57: Italy US Wind Energy Market Revenue (Million) Forecast, by Application 2019 & 2032
- Table 58: Italy US Wind Energy Market Volume (gigawatt) Forecast, by Application 2019 & 2032
- Table 59: Spain US Wind Energy Market Revenue (Million) Forecast, by Application 2019 & 2032
- Table 60: Spain US Wind Energy Market Volume (gigawatt) Forecast, by Application 2019 & 2032
- Table 61: Russia US Wind Energy Market Revenue (Million) Forecast, by Application 2019 & 2032
- Table 62: Russia US Wind Energy Market Volume (gigawatt) Forecast, by Application 2019 & 2032
- Table 63: Benelux US Wind Energy Market Revenue (Million) Forecast, by Application 2019 & 2032
- Table 64: Benelux US Wind Energy Market Volume (gigawatt) Forecast, by Application 2019 & 2032
- Table 65: Nordics US Wind Energy Market Revenue (Million) Forecast, by Application 2019 & 2032
- Table 66: Nordics US Wind Energy Market Volume (gigawatt) Forecast, by Application 2019 & 2032
- Table 67: Rest of Europe US Wind Energy Market Revenue (Million) Forecast, by Application 2019 & 2032
- Table 68: Rest of Europe US Wind Energy Market Volume (gigawatt) Forecast, by Application 2019 & 2032
- Table 69: Global US Wind Energy Market Revenue Million Forecast, by Onshore 2019 & 2032
- Table 70: Global US Wind Energy Market Volume gigawatt Forecast, by Onshore 2019 & 2032
- Table 71: Global US Wind Energy Market Revenue Million Forecast, by Offshore 2019 & 2032
- Table 72: Global US Wind Energy Market Volume gigawatt Forecast, by Offshore 2019 & 2032
- Table 73: Global US Wind Energy Market Revenue Million Forecast, by Country 2019 & 2032
- Table 74: Global US Wind Energy Market Volume gigawatt Forecast, by Country 2019 & 2032
- Table 75: Turkey US Wind Energy Market Revenue (Million) Forecast, by Application 2019 & 2032
- Table 76: Turkey US Wind Energy Market Volume (gigawatt) Forecast, by Application 2019 & 2032
- Table 77: Israel US Wind Energy Market Revenue (Million) Forecast, by Application 2019 & 2032
- Table 78: Israel US Wind Energy Market Volume (gigawatt) Forecast, by Application 2019 & 2032
- Table 79: GCC US Wind Energy Market Revenue (Million) Forecast, by Application 2019 & 2032
- Table 80: GCC US Wind Energy Market Volume (gigawatt) Forecast, by Application 2019 & 2032
- Table 81: North Africa US Wind Energy Market Revenue (Million) Forecast, by Application 2019 & 2032
- Table 82: North Africa US Wind Energy Market Volume (gigawatt) Forecast, by Application 2019 & 2032
- Table 83: South Africa US Wind Energy Market Revenue (Million) Forecast, by Application 2019 & 2032
- Table 84: South Africa US Wind Energy Market Volume (gigawatt) Forecast, by Application 2019 & 2032
- Table 85: Rest of Middle East & Africa US Wind Energy Market Revenue (Million) Forecast, by Application 2019 & 2032
- Table 86: Rest of Middle East & Africa US Wind Energy Market Volume (gigawatt) Forecast, by Application 2019 & 2032
- Table 87: Global US Wind Energy Market Revenue Million Forecast, by Onshore 2019 & 2032
- Table 88: Global US Wind Energy Market Volume gigawatt Forecast, by Onshore 2019 & 2032
- Table 89: Global US Wind Energy Market Revenue Million Forecast, by Offshore 2019 & 2032
- Table 90: Global US Wind Energy Market Volume gigawatt Forecast, by Offshore 2019 & 2032
- Table 91: Global US Wind Energy Market Revenue Million Forecast, by Country 2019 & 2032
- Table 92: Global US Wind Energy Market Volume gigawatt Forecast, by Country 2019 & 2032
- Table 93: China US Wind Energy Market Revenue (Million) Forecast, by Application 2019 & 2032
- Table 94: China US Wind Energy Market Volume (gigawatt) Forecast, by Application 2019 & 2032
- Table 95: India US Wind Energy Market Revenue (Million) Forecast, by Application 2019 & 2032
- Table 96: India US Wind Energy Market Volume (gigawatt) Forecast, by Application 2019 & 2032
- Table 97: Japan US Wind Energy Market Revenue (Million) Forecast, by Application 2019 & 2032
- Table 98: Japan US Wind Energy Market Volume (gigawatt) Forecast, by Application 2019 & 2032
- Table 99: South Korea US Wind Energy Market Revenue (Million) Forecast, by Application 2019 & 2032
- Table 100: South Korea US Wind Energy Market Volume (gigawatt) Forecast, by Application 2019 & 2032
- Table 101: ASEAN US Wind Energy Market Revenue (Million) Forecast, by Application 2019 & 2032
- Table 102: ASEAN US Wind Energy Market Volume (gigawatt) Forecast, by Application 2019 & 2032
- Table 103: Oceania US Wind Energy Market Revenue (Million) Forecast, by Application 2019 & 2032
- Table 104: Oceania US Wind Energy Market Volume (gigawatt) Forecast, by Application 2019 & 2032
- Table 105: Rest of Asia Pacific US Wind Energy Market Revenue (Million) Forecast, by Application 2019 & 2032
- Table 106: Rest of Asia Pacific US Wind Energy Market Volume (gigawatt) Forecast, by Application 2019 & 2032
Frequently Asked Questions
1. What is the projected Compound Annual Growth Rate (CAGR) of the US Wind Energy Market?
The projected CAGR is approximately 5.87%.
2. Which companies are prominent players in the US Wind Energy Market?
Key companies in the market include Equipment Suppliers, 3 Siemens Gamesa Renewable Energy, 6 E ON SE, 7 EDF SA, 8 EnBW Energie Baden-Wurttemberg AG, 2 General Electric Company, 1 Envision Energy, 5 Trident Winds Inc, 2 Orsted AS, Wind Farm Operators, 4 Vestas Wind Systems AS, 4 NextEra Energy Inc, 1 Acciona Energia SA, 3 Duke Energy Corporation.
3. What are the main segments of the US Wind Energy Market?
The market segments include Onshore, Offshore.
4. Can you provide details about the market size?
The market size is estimated to be USD XX Million as of 2022.
5. What are some drivers contributing to market growth?
4.; Global Inclination toward Renewable-based Power Generation4.; Increased Power Demand in Line with the Increasing Population.
6. What are the notable trends driving market growth?
Onshore Segment to Dominate the Market.
7. Are there any restraints impacting market growth?
4.; High Initial Cost.
8. Can you provide examples of recent developments in the market?
In October 2020, Equinor announced its Empire wind project with an installed capacity of 816MW, scheduled to be commissioned by 2024. The project will meet the power needs of more than half a million households in New York. Equinor is currently the sole owner of the Empire wind project and will remain the operator throughout the development, construction, and operations phases.
9. What pricing options are available for accessing the report?
Pricing options include single-user, multi-user, and enterprise licenses priced at USD 3800, USD 4500, and USD 5800 respectively.
10. Is the market size provided in terms of value or volume?
The market size is provided in terms of value, measured in Million and volume, measured in gigawatt.
11. Are there any specific market keywords associated with the report?
Yes, the market keyword associated with the report is "US Wind Energy Market," which aids in identifying and referencing the specific market segment covered.
12. How do I determine which pricing option suits my needs best?
The pricing options vary based on user requirements and access needs. Individual users may opt for single-user licenses, while businesses requiring broader access may choose multi-user or enterprise licenses for cost-effective access to the report.
13. Are there any additional resources or data provided in the US Wind Energy Market report?
While the report offers comprehensive insights, it's advisable to review the specific contents or supplementary materials provided to ascertain if additional resources or data are available.
14. How can I stay updated on further developments or reports in the US Wind Energy Market?
To stay informed about further developments, trends, and reports in the US Wind Energy Market, consider subscribing to industry newsletters, following relevant companies and organizations, or regularly checking reputable industry news sources and publications.
Methodology
Step 1 - Identification of Relevant Samples Size from Population Database


Step 2 - Approaches for Defining Global Market Size (Value, Volume* & Price*)

Note*: In applicable scenarios
Step 3 - Data Sources
Primary Research
- Web Analytics
- Survey Reports
- Research Institute
- Latest Research Reports
- Opinion Leaders
Secondary Research
- Annual Reports
- White Paper
- Latest Press Release
- Industry Association
- Paid Database
- Investor Presentations

Step 4 - Data Triangulation
Involves using different sources of information in order to increase the validity of a study
These sources are likely to be stakeholders in a program - participants, other researchers, program staff, other community members, and so on.
Then we put all data in single framework & apply various statistical tools to find out the dynamic on the market.
During the analysis stage, feedback from the stakeholder groups would be compared to determine areas of agreement as well as areas of divergence
