

Key Insights
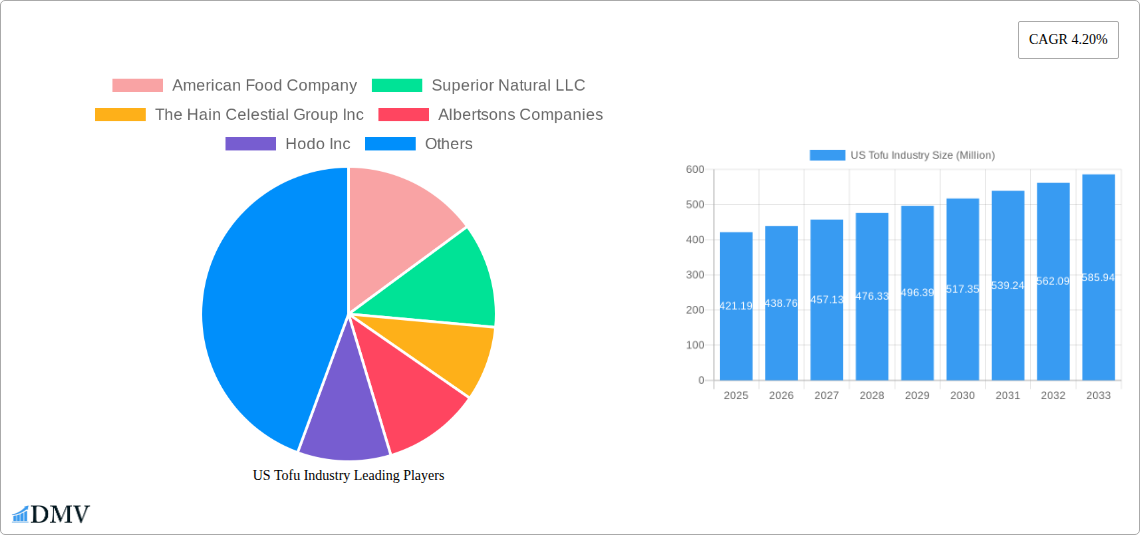
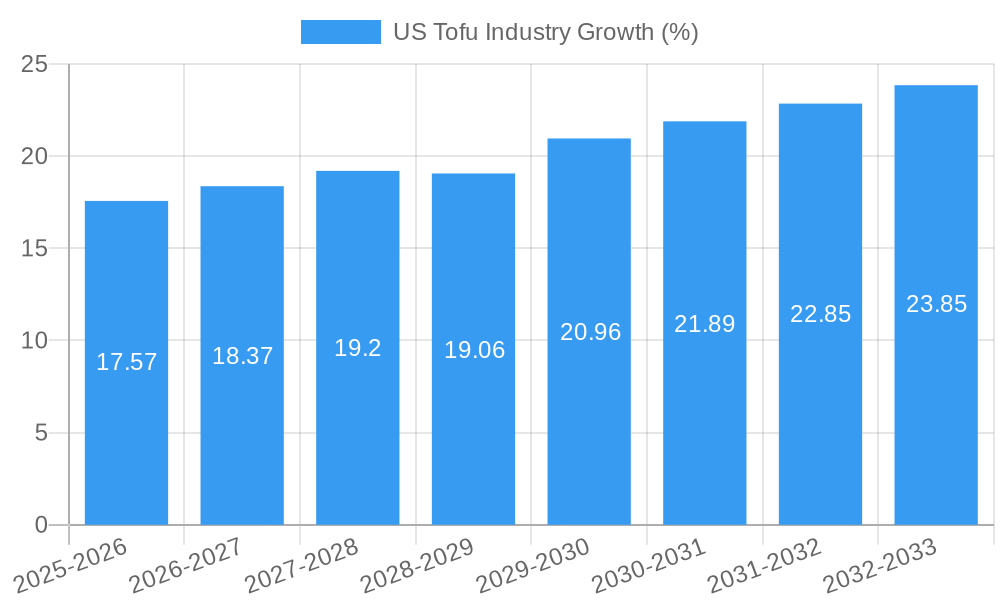
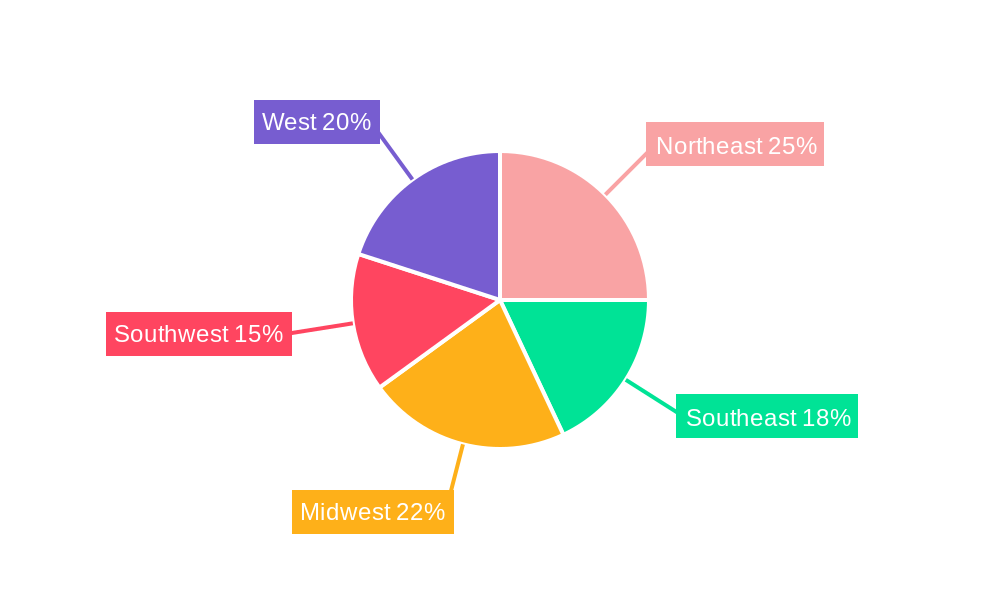
The US tofu market, valued at $421.19 million in 2025, is projected to experience steady growth, exhibiting a Compound Annual Growth Rate (CAGR) of 4.20% from 2025 to 2033. This expansion is driven by several key factors. Increasing consumer awareness of the health benefits associated with plant-based diets, including the high protein and low-fat content of tofu, fuels demand. The rise in veganism and vegetarianism, coupled with growing concerns about the environmental impact of animal agriculture, further contributes to market growth. Furthermore, the increasing availability of tofu in diverse forms and applications, from traditional dishes to innovative culinary creations, expands its appeal to a broader consumer base. The market is segmented into on-trade (food service) and off-trade (retail) distribution channels, with both segments witnessing consistent growth, albeit potentially at varying rates. Major players like American Food Company, Superior Natural LLC, and The Hain Celestial Group Inc. are actively involved in product innovation and market expansion to capitalize on these trends. Geographic variations exist within the US market, with regions such as the Northeast and West potentially exhibiting higher per capita consumption due to established health-conscious populations and diverse culinary preferences. While specific regional data is limited, the overall growth trajectory indicates a promising future for the US tofu market.
The continued growth of the US tofu market will depend on several factors. Sustained consumer interest in plant-based protein sources will be crucial. The success of innovative tofu product development and marketing strategies, targeting diverse consumer segments and culinary applications, will play a significant role. Competitive pricing strategies and effective supply chain management are also vital to ensure market accessibility and affordability. Furthermore, effective communication of tofu's nutritional and environmental benefits to a wider consumer base remains crucial. Challenges may include fluctuations in raw material prices (soybeans) and the potential for consumer preference shifts towards other plant-based protein alternatives. However, given the current trends and industry dynamics, the US tofu market is expected to maintain a steady growth trajectory through 2033.
US Tofu Industry: A Comprehensive Market Report (2019-2033)
This insightful report provides a comprehensive analysis of the US Tofu industry, offering invaluable data and projections for stakeholders seeking to navigate this dynamic market. Covering the period from 2019 to 2033, with a base year of 2025 and a forecast period from 2025 to 2033, this report unveils key trends, challenges, and opportunities within the US Tofu market. The report's robust analysis incorporates data from the historical period (2019-2024) and estimated data for 2025, providing a solid foundation for informed decision-making.
US Tofu Industry Market Composition & Trends
This section delves into the competitive landscape of the US Tofu market, analyzing market concentration, innovation drivers, regulatory frameworks, substitute products, end-user preferences, and significant M&A activities. The report reveals the market share distribution amongst key players, such as American Food Company, Superior Natural LLC, The Hain Celestial Group Inc, Albertsons Companies, Hodo Inc, Pulmuone Corporate, House Foods Group Inc, and Morinaga Milk Industry Co Ltd. The analysis also quantifies the value of major M&A deals, providing insights into strategic market consolidation. The impact of regulatory changes on market dynamics and the emergence of substitute products, such as plant-based meat alternatives, are also thoroughly investigated. Detailed end-user profiles are included to provide a complete picture of market segmentation and consumer preferences. The report estimates the US Tofu market size to be $XX Million in 2025, growing to $YY Million by 2033, representing a Compound Annual Growth Rate (CAGR) of Z%.
- Market Share Distribution: A detailed breakdown of market share amongst leading companies, highlighting dominant players and emerging competitors.
- M&A Activity: Analysis of major mergers and acquisitions, including deal values and their impact on market structure.
- Regulatory Landscape: An assessment of current and future regulations impacting the industry, along with their potential consequences.
- Substitute Products: Examination of competitive pressures from substitute products and their impact on market growth.
- End-User Profiles: Detailed segmentation of consumers based on demographics, preferences and consumption habits.
US Tofu Industry Industry Evolution
This section provides a detailed analysis of the US Tofu industry's evolution, tracing its growth trajectory, highlighting technological advancements, and examining the shifting preferences of consumers. The report meticulously tracks market growth rates throughout the study period, providing specific data points and adoption metrics for key technological innovations. The influence of evolving consumer demands – for example, increasing preference for organic and non-GMO tofu – is thoroughly investigated, explaining how these factors shape market dynamics.
Leading Regions, Countries, or Segments in US Tofu Industry
This section identifies the leading segments within the US Tofu industry – focusing on the “Others: On-Trade” and “Distribution Channel: Off-Trade” segments. It explores the key drivers of dominance within these segments through a detailed analysis of regional and geographical variations. The report details investment trends, regulatory support, and other factors that contribute to the success of leading areas.
- Key Drivers for On-Trade Dominance:
- Increased demand from restaurants and food service establishments
- Growing popularity of tofu-based dishes in restaurants.
- Specific regional preferences for tofu consumption.
- Key Drivers for Off-Trade Dominance:
- Rising retail sales of tofu products through supermarkets and grocery stores.
- Expanding online grocery delivery services.
- Increased availability of tofu in various formats and flavors.
US Tofu Industry Product Innovations
This section highlights recent product innovations in the US Tofu industry, analyzing their applications, and providing performance metrics for key products. The report showcases unique selling propositions, such as new flavors, textures, or improved nutritional profiles, and the technological advancements underlying these innovations. For example, the introduction of plant-based proteins to expand nutritional value and the shift toward sustainable sourcing methods.
Propelling Factors for US Tofu Industry Growth
This section pinpoints the key drivers of growth within the US Tofu industry, focusing on technological advancements, favorable economic conditions, and supportive regulatory environments. The analysis illustrates how these factors combine to fuel market expansion. For instance, the rise of plant-based diets, improvements in tofu processing and production, and supportive government policies towards sustainable agriculture are examined.
Obstacles in the US Tofu Industry Market
This section explores the challenges and barriers hindering growth in the US Tofu industry. These include regulatory hurdles, supply chain disruptions, and the intensity of competitive pressures. The report quantifies the impact of these challenges on market dynamics, providing concrete examples of their effects.
Future Opportunities in US Tofu Industry
This section focuses on promising opportunities for growth in the US Tofu market. These include the exploration of new markets, adoption of innovative technologies, and capitalizing on emerging consumer trends – for instance, the growing demand for convenient and ready-to-eat tofu products, or opportunities in functional food and ingredient applications.
Major Players in the US Tofu Industry Ecosystem
- American Food Company
- Superior Natural LLC
- The Hain Celestial Group Inc
- Albertsons Companies
- Hodo Inc
- Pulmuone Corporate
- House Foods Group Inc
- Morinaga Milk Industry Co Ltd
Key Developments in US Tofu Industry Industry
- June 2022: Morinaga Nutritional Foods launched Mori-Nu Yuzu Flavored Silken Tofu.
- February 2023: Morinaga Nutritional Foods acquired Tofurky and Moocho.
- March 2023: Hodo launched Miso Tofu and Indian Spiced Tofu.
Strategic US Tofu Industry Market Forecast
This section summarizes the key growth catalysts identified in the report, offering a concise outlook on the future trajectory of the US Tofu market. It highlights the significant market potential and emphasizes the opportunities for expansion and innovation within the industry. The forecast anticipates continued growth driven by increasing consumer demand for plant-based proteins, ongoing product innovation, and the expanding market for tofu in various food applications.
US Tofu Industry Segmentation
-
1. Distribution Channel
-
1.1. Off-Trade
- 1.1.1. Convenience Stores
- 1.1.2. Online Channel
- 1.1.3. Supermarkets and Hypermarkets
- 1.1.4. Others
- 1.2. On-Trade
-
1.1. Off-Trade
US Tofu Industry Segmentation By Geography
-
1. North America
- 1.1. United States
- 1.2. Canada
- 1.3. Mexico
-
2. South America
- 2.1. Brazil
- 2.2. Argentina
- 2.3. Rest of South America
-
3. Europe
- 3.1. United Kingdom
- 3.2. Germany
- 3.3. France
- 3.4. Italy
- 3.5. Spain
- 3.6. Russia
- 3.7. Benelux
- 3.8. Nordics
- 3.9. Rest of Europe
-
4. Middle East & Africa
- 4.1. Turkey
- 4.2. Israel
- 4.3. GCC
- 4.4. North Africa
- 4.5. South Africa
- 4.6. Rest of Middle East & Africa
-
5. Asia Pacific
- 5.1. China
- 5.2. India
- 5.3. Japan
- 5.4. South Korea
- 5.5. ASEAN
- 5.6. Oceania
- 5.7. Rest of Asia Pacific
US Tofu Industry REPORT HIGHLIGHTS
| Aspects | Details |
|---|---|
| Study Period | 2019-2033 |
| Base Year | 2024 |
| Estimated Year | 2025 |
| Forecast Period | 2025-2033 |
| Historical Period | 2019-2024 |
| Growth Rate | CAGR of 4.20% from 2019-2033 |
| Segmentation |
|
Table of Contents
- 1. Introduction
- 1.1. Research Scope
- 1.2. Market Segmentation
- 1.3. Research Methodology
- 1.4. Definitions and Assumptions
- 2. Executive Summary
- 2.1. Introduction
- 3. Market Dynamics
- 3.1. Introduction
- 3.2. Market Drivers
- 3.2.1. Escalating Demand for Processed Poultry Products; Favorable Government Initiatives to Boost Production
- 3.3. Market Restrains
- 3.3.1. Rising Vegan Trend among Young Consumers; Deeper Penetration of Red Meat Across Saudi Arabia
- 3.4. Market Trends
- 3.4.1. Increasing demand for new variants in the tofu market through the expanded e-commerce channels drives the market
- 4. Market Factor Analysis
- 4.1. Porters Five Forces
- 4.2. Supply/Value Chain
- 4.3. PESTEL analysis
- 4.4. Market Entropy
- 4.5. Patent/Trademark Analysis
- 5. Global US Tofu Industry Analysis, Insights and Forecast, 2019-2031
- 5.1. Market Analysis, Insights and Forecast - by Distribution Channel
- 5.1.1. Off-Trade
- 5.1.1.1. Convenience Stores
- 5.1.1.2. Online Channel
- 5.1.1.3. Supermarkets and Hypermarkets
- 5.1.1.4. Others
- 5.1.2. On-Trade
- 5.1.1. Off-Trade
- 5.2. Market Analysis, Insights and Forecast - by Region
- 5.2.1. North America
- 5.2.2. South America
- 5.2.3. Europe
- 5.2.4. Middle East & Africa
- 5.2.5. Asia Pacific
- 5.1. Market Analysis, Insights and Forecast - by Distribution Channel
- 6. North America US Tofu Industry Analysis, Insights and Forecast, 2019-2031
- 6.1. Market Analysis, Insights and Forecast - by Distribution Channel
- 6.1.1. Off-Trade
- 6.1.1.1. Convenience Stores
- 6.1.1.2. Online Channel
- 6.1.1.3. Supermarkets and Hypermarkets
- 6.1.1.4. Others
- 6.1.2. On-Trade
- 6.1.1. Off-Trade
- 6.1. Market Analysis, Insights and Forecast - by Distribution Channel
- 7. South America US Tofu Industry Analysis, Insights and Forecast, 2019-2031
- 7.1. Market Analysis, Insights and Forecast - by Distribution Channel
- 7.1.1. Off-Trade
- 7.1.1.1. Convenience Stores
- 7.1.1.2. Online Channel
- 7.1.1.3. Supermarkets and Hypermarkets
- 7.1.1.4. Others
- 7.1.2. On-Trade
- 7.1.1. Off-Trade
- 7.1. Market Analysis, Insights and Forecast - by Distribution Channel
- 8. Europe US Tofu Industry Analysis, Insights and Forecast, 2019-2031
- 8.1. Market Analysis, Insights and Forecast - by Distribution Channel
- 8.1.1. Off-Trade
- 8.1.1.1. Convenience Stores
- 8.1.1.2. Online Channel
- 8.1.1.3. Supermarkets and Hypermarkets
- 8.1.1.4. Others
- 8.1.2. On-Trade
- 8.1.1. Off-Trade
- 8.1. Market Analysis, Insights and Forecast - by Distribution Channel
- 9. Middle East & Africa US Tofu Industry Analysis, Insights and Forecast, 2019-2031
- 9.1. Market Analysis, Insights and Forecast - by Distribution Channel
- 9.1.1. Off-Trade
- 9.1.1.1. Convenience Stores
- 9.1.1.2. Online Channel
- 9.1.1.3. Supermarkets and Hypermarkets
- 9.1.1.4. Others
- 9.1.2. On-Trade
- 9.1.1. Off-Trade
- 9.1. Market Analysis, Insights and Forecast - by Distribution Channel
- 10. Asia Pacific US Tofu Industry Analysis, Insights and Forecast, 2019-2031
- 10.1. Market Analysis, Insights and Forecast - by Distribution Channel
- 10.1.1. Off-Trade
- 10.1.1.1. Convenience Stores
- 10.1.1.2. Online Channel
- 10.1.1.3. Supermarkets and Hypermarkets
- 10.1.1.4. Others
- 10.1.2. On-Trade
- 10.1.1. Off-Trade
- 10.1. Market Analysis, Insights and Forecast - by Distribution Channel
- 11. Northeast US Tofu Industry Analysis, Insights and Forecast, 2019-2031
- 12. Southeast US Tofu Industry Analysis, Insights and Forecast, 2019-2031
- 13. Midwest US Tofu Industry Analysis, Insights and Forecast, 2019-2031
- 14. Southwest US Tofu Industry Analysis, Insights and Forecast, 2019-2031
- 15. West US Tofu Industry Analysis, Insights and Forecast, 2019-2031
- 16. Competitive Analysis
- 16.1. Global Market Share Analysis 2024
- 16.2. Company Profiles
- 16.2.1 American Food Company
- 16.2.1.1. Overview
- 16.2.1.2. Products
- 16.2.1.3. SWOT Analysis
- 16.2.1.4. Recent Developments
- 16.2.1.5. Financials (Based on Availability)
- 16.2.2 Superior Natural LLC
- 16.2.2.1. Overview
- 16.2.2.2. Products
- 16.2.2.3. SWOT Analysis
- 16.2.2.4. Recent Developments
- 16.2.2.5. Financials (Based on Availability)
- 16.2.3 The Hain Celestial Group Inc
- 16.2.3.1. Overview
- 16.2.3.2. Products
- 16.2.3.3. SWOT Analysis
- 16.2.3.4. Recent Developments
- 16.2.3.5. Financials (Based on Availability)
- 16.2.4 Albertsons Companies
- 16.2.4.1. Overview
- 16.2.4.2. Products
- 16.2.4.3. SWOT Analysis
- 16.2.4.4. Recent Developments
- 16.2.4.5. Financials (Based on Availability)
- 16.2.5 Hodo Inc
- 16.2.5.1. Overview
- 16.2.5.2. Products
- 16.2.5.3. SWOT Analysis
- 16.2.5.4. Recent Developments
- 16.2.5.5. Financials (Based on Availability)
- 16.2.6 Pulmuone Corporate
- 16.2.6.1. Overview
- 16.2.6.2. Products
- 16.2.6.3. SWOT Analysis
- 16.2.6.4. Recent Developments
- 16.2.6.5. Financials (Based on Availability)
- 16.2.7 House Foods Group Inc
- 16.2.7.1. Overview
- 16.2.7.2. Products
- 16.2.7.3. SWOT Analysis
- 16.2.7.4. Recent Developments
- 16.2.7.5. Financials (Based on Availability)
- 16.2.8 Morinaga Milk Industry Co Ltd
- 16.2.8.1. Overview
- 16.2.8.2. Products
- 16.2.8.3. SWOT Analysis
- 16.2.8.4. Recent Developments
- 16.2.8.5. Financials (Based on Availability)
- 16.2.1 American Food Company
List of Figures
- Figure 1: Global US Tofu Industry Revenue Breakdown (Million, %) by Region 2024 & 2032
- Figure 2: Global US Tofu Industry Volume Breakdown (K Tons, %) by Region 2024 & 2032
- Figure 3: United states US Tofu Industry Revenue (Million), by Country 2024 & 2032
- Figure 4: United states US Tofu Industry Volume (K Tons), by Country 2024 & 2032
- Figure 5: United states US Tofu Industry Revenue Share (%), by Country 2024 & 2032
- Figure 6: United states US Tofu Industry Volume Share (%), by Country 2024 & 2032
- Figure 7: North America US Tofu Industry Revenue (Million), by Distribution Channel 2024 & 2032
- Figure 8: North America US Tofu Industry Volume (K Tons), by Distribution Channel 2024 & 2032
- Figure 9: North America US Tofu Industry Revenue Share (%), by Distribution Channel 2024 & 2032
- Figure 10: North America US Tofu Industry Volume Share (%), by Distribution Channel 2024 & 2032
- Figure 11: North America US Tofu Industry Revenue (Million), by Country 2024 & 2032
- Figure 12: North America US Tofu Industry Volume (K Tons), by Country 2024 & 2032
- Figure 13: North America US Tofu Industry Revenue Share (%), by Country 2024 & 2032
- Figure 14: North America US Tofu Industry Volume Share (%), by Country 2024 & 2032
- Figure 15: South America US Tofu Industry Revenue (Million), by Distribution Channel 2024 & 2032
- Figure 16: South America US Tofu Industry Volume (K Tons), by Distribution Channel 2024 & 2032
- Figure 17: South America US Tofu Industry Revenue Share (%), by Distribution Channel 2024 & 2032
- Figure 18: South America US Tofu Industry Volume Share (%), by Distribution Channel 2024 & 2032
- Figure 19: South America US Tofu Industry Revenue (Million), by Country 2024 & 2032
- Figure 20: South America US Tofu Industry Volume (K Tons), by Country 2024 & 2032
- Figure 21: South America US Tofu Industry Revenue Share (%), by Country 2024 & 2032
- Figure 22: South America US Tofu Industry Volume Share (%), by Country 2024 & 2032
- Figure 23: Europe US Tofu Industry Revenue (Million), by Distribution Channel 2024 & 2032
- Figure 24: Europe US Tofu Industry Volume (K Tons), by Distribution Channel 2024 & 2032
- Figure 25: Europe US Tofu Industry Revenue Share (%), by Distribution Channel 2024 & 2032
- Figure 26: Europe US Tofu Industry Volume Share (%), by Distribution Channel 2024 & 2032
- Figure 27: Europe US Tofu Industry Revenue (Million), by Country 2024 & 2032
- Figure 28: Europe US Tofu Industry Volume (K Tons), by Country 2024 & 2032
- Figure 29: Europe US Tofu Industry Revenue Share (%), by Country 2024 & 2032
- Figure 30: Europe US Tofu Industry Volume Share (%), by Country 2024 & 2032
- Figure 31: Middle East & Africa US Tofu Industry Revenue (Million), by Distribution Channel 2024 & 2032
- Figure 32: Middle East & Africa US Tofu Industry Volume (K Tons), by Distribution Channel 2024 & 2032
- Figure 33: Middle East & Africa US Tofu Industry Revenue Share (%), by Distribution Channel 2024 & 2032
- Figure 34: Middle East & Africa US Tofu Industry Volume Share (%), by Distribution Channel 2024 & 2032
- Figure 35: Middle East & Africa US Tofu Industry Revenue (Million), by Country 2024 & 2032
- Figure 36: Middle East & Africa US Tofu Industry Volume (K Tons), by Country 2024 & 2032
- Figure 37: Middle East & Africa US Tofu Industry Revenue Share (%), by Country 2024 & 2032
- Figure 38: Middle East & Africa US Tofu Industry Volume Share (%), by Country 2024 & 2032
- Figure 39: Asia Pacific US Tofu Industry Revenue (Million), by Distribution Channel 2024 & 2032
- Figure 40: Asia Pacific US Tofu Industry Volume (K Tons), by Distribution Channel 2024 & 2032
- Figure 41: Asia Pacific US Tofu Industry Revenue Share (%), by Distribution Channel 2024 & 2032
- Figure 42: Asia Pacific US Tofu Industry Volume Share (%), by Distribution Channel 2024 & 2032
- Figure 43: Asia Pacific US Tofu Industry Revenue (Million), by Country 2024 & 2032
- Figure 44: Asia Pacific US Tofu Industry Volume (K Tons), by Country 2024 & 2032
- Figure 45: Asia Pacific US Tofu Industry Revenue Share (%), by Country 2024 & 2032
- Figure 46: Asia Pacific US Tofu Industry Volume Share (%), by Country 2024 & 2032
List of Tables
- Table 1: Global US Tofu Industry Revenue Million Forecast, by Region 2019 & 2032
- Table 2: Global US Tofu Industry Volume K Tons Forecast, by Region 2019 & 2032
- Table 3: Global US Tofu Industry Revenue Million Forecast, by Distribution Channel 2019 & 2032
- Table 4: Global US Tofu Industry Volume K Tons Forecast, by Distribution Channel 2019 & 2032
- Table 5: Global US Tofu Industry Revenue Million Forecast, by Region 2019 & 2032
- Table 6: Global US Tofu Industry Volume K Tons Forecast, by Region 2019 & 2032
- Table 7: Global US Tofu Industry Revenue Million Forecast, by Country 2019 & 2032
- Table 8: Global US Tofu Industry Volume K Tons Forecast, by Country 2019 & 2032
- Table 9: Northeast US Tofu Industry Revenue (Million) Forecast, by Application 2019 & 2032
- Table 10: Northeast US Tofu Industry Volume (K Tons) Forecast, by Application 2019 & 2032
- Table 11: Southeast US Tofu Industry Revenue (Million) Forecast, by Application 2019 & 2032
- Table 12: Southeast US Tofu Industry Volume (K Tons) Forecast, by Application 2019 & 2032
- Table 13: Midwest US Tofu Industry Revenue (Million) Forecast, by Application 2019 & 2032
- Table 14: Midwest US Tofu Industry Volume (K Tons) Forecast, by Application 2019 & 2032
- Table 15: Southwest US Tofu Industry Revenue (Million) Forecast, by Application 2019 & 2032
- Table 16: Southwest US Tofu Industry Volume (K Tons) Forecast, by Application 2019 & 2032
- Table 17: West US Tofu Industry Revenue (Million) Forecast, by Application 2019 & 2032
- Table 18: West US Tofu Industry Volume (K Tons) Forecast, by Application 2019 & 2032
- Table 19: Global US Tofu Industry Revenue Million Forecast, by Distribution Channel 2019 & 2032
- Table 20: Global US Tofu Industry Volume K Tons Forecast, by Distribution Channel 2019 & 2032
- Table 21: Global US Tofu Industry Revenue Million Forecast, by Country 2019 & 2032
- Table 22: Global US Tofu Industry Volume K Tons Forecast, by Country 2019 & 2032
- Table 23: United States US Tofu Industry Revenue (Million) Forecast, by Application 2019 & 2032
- Table 24: United States US Tofu Industry Volume (K Tons) Forecast, by Application 2019 & 2032
- Table 25: Canada US Tofu Industry Revenue (Million) Forecast, by Application 2019 & 2032
- Table 26: Canada US Tofu Industry Volume (K Tons) Forecast, by Application 2019 & 2032
- Table 27: Mexico US Tofu Industry Revenue (Million) Forecast, by Application 2019 & 2032
- Table 28: Mexico US Tofu Industry Volume (K Tons) Forecast, by Application 2019 & 2032
- Table 29: Global US Tofu Industry Revenue Million Forecast, by Distribution Channel 2019 & 2032
- Table 30: Global US Tofu Industry Volume K Tons Forecast, by Distribution Channel 2019 & 2032
- Table 31: Global US Tofu Industry Revenue Million Forecast, by Country 2019 & 2032
- Table 32: Global US Tofu Industry Volume K Tons Forecast, by Country 2019 & 2032
- Table 33: Brazil US Tofu Industry Revenue (Million) Forecast, by Application 2019 & 2032
- Table 34: Brazil US Tofu Industry Volume (K Tons) Forecast, by Application 2019 & 2032
- Table 35: Argentina US Tofu Industry Revenue (Million) Forecast, by Application 2019 & 2032
- Table 36: Argentina US Tofu Industry Volume (K Tons) Forecast, by Application 2019 & 2032
- Table 37: Rest of South America US Tofu Industry Revenue (Million) Forecast, by Application 2019 & 2032
- Table 38: Rest of South America US Tofu Industry Volume (K Tons) Forecast, by Application 2019 & 2032
- Table 39: Global US Tofu Industry Revenue Million Forecast, by Distribution Channel 2019 & 2032
- Table 40: Global US Tofu Industry Volume K Tons Forecast, by Distribution Channel 2019 & 2032
- Table 41: Global US Tofu Industry Revenue Million Forecast, by Country 2019 & 2032
- Table 42: Global US Tofu Industry Volume K Tons Forecast, by Country 2019 & 2032
- Table 43: United Kingdom US Tofu Industry Revenue (Million) Forecast, by Application 2019 & 2032
- Table 44: United Kingdom US Tofu Industry Volume (K Tons) Forecast, by Application 2019 & 2032
- Table 45: Germany US Tofu Industry Revenue (Million) Forecast, by Application 2019 & 2032
- Table 46: Germany US Tofu Industry Volume (K Tons) Forecast, by Application 2019 & 2032
- Table 47: France US Tofu Industry Revenue (Million) Forecast, by Application 2019 & 2032
- Table 48: France US Tofu Industry Volume (K Tons) Forecast, by Application 2019 & 2032
- Table 49: Italy US Tofu Industry Revenue (Million) Forecast, by Application 2019 & 2032
- Table 50: Italy US Tofu Industry Volume (K Tons) Forecast, by Application 2019 & 2032
- Table 51: Spain US Tofu Industry Revenue (Million) Forecast, by Application 2019 & 2032
- Table 52: Spain US Tofu Industry Volume (K Tons) Forecast, by Application 2019 & 2032
- Table 53: Russia US Tofu Industry Revenue (Million) Forecast, by Application 2019 & 2032
- Table 54: Russia US Tofu Industry Volume (K Tons) Forecast, by Application 2019 & 2032
- Table 55: Benelux US Tofu Industry Revenue (Million) Forecast, by Application 2019 & 2032
- Table 56: Benelux US Tofu Industry Volume (K Tons) Forecast, by Application 2019 & 2032
- Table 57: Nordics US Tofu Industry Revenue (Million) Forecast, by Application 2019 & 2032
- Table 58: Nordics US Tofu Industry Volume (K Tons) Forecast, by Application 2019 & 2032
- Table 59: Rest of Europe US Tofu Industry Revenue (Million) Forecast, by Application 2019 & 2032
- Table 60: Rest of Europe US Tofu Industry Volume (K Tons) Forecast, by Application 2019 & 2032
- Table 61: Global US Tofu Industry Revenue Million Forecast, by Distribution Channel 2019 & 2032
- Table 62: Global US Tofu Industry Volume K Tons Forecast, by Distribution Channel 2019 & 2032
- Table 63: Global US Tofu Industry Revenue Million Forecast, by Country 2019 & 2032
- Table 64: Global US Tofu Industry Volume K Tons Forecast, by Country 2019 & 2032
- Table 65: Turkey US Tofu Industry Revenue (Million) Forecast, by Application 2019 & 2032
- Table 66: Turkey US Tofu Industry Volume (K Tons) Forecast, by Application 2019 & 2032
- Table 67: Israel US Tofu Industry Revenue (Million) Forecast, by Application 2019 & 2032
- Table 68: Israel US Tofu Industry Volume (K Tons) Forecast, by Application 2019 & 2032
- Table 69: GCC US Tofu Industry Revenue (Million) Forecast, by Application 2019 & 2032
- Table 70: GCC US Tofu Industry Volume (K Tons) Forecast, by Application 2019 & 2032
- Table 71: North Africa US Tofu Industry Revenue (Million) Forecast, by Application 2019 & 2032
- Table 72: North Africa US Tofu Industry Volume (K Tons) Forecast, by Application 2019 & 2032
- Table 73: South Africa US Tofu Industry Revenue (Million) Forecast, by Application 2019 & 2032
- Table 74: South Africa US Tofu Industry Volume (K Tons) Forecast, by Application 2019 & 2032
- Table 75: Rest of Middle East & Africa US Tofu Industry Revenue (Million) Forecast, by Application 2019 & 2032
- Table 76: Rest of Middle East & Africa US Tofu Industry Volume (K Tons) Forecast, by Application 2019 & 2032
- Table 77: Global US Tofu Industry Revenue Million Forecast, by Distribution Channel 2019 & 2032
- Table 78: Global US Tofu Industry Volume K Tons Forecast, by Distribution Channel 2019 & 2032
- Table 79: Global US Tofu Industry Revenue Million Forecast, by Country 2019 & 2032
- Table 80: Global US Tofu Industry Volume K Tons Forecast, by Country 2019 & 2032
- Table 81: China US Tofu Industry Revenue (Million) Forecast, by Application 2019 & 2032
- Table 82: China US Tofu Industry Volume (K Tons) Forecast, by Application 2019 & 2032
- Table 83: India US Tofu Industry Revenue (Million) Forecast, by Application 2019 & 2032
- Table 84: India US Tofu Industry Volume (K Tons) Forecast, by Application 2019 & 2032
- Table 85: Japan US Tofu Industry Revenue (Million) Forecast, by Application 2019 & 2032
- Table 86: Japan US Tofu Industry Volume (K Tons) Forecast, by Application 2019 & 2032
- Table 87: South Korea US Tofu Industry Revenue (Million) Forecast, by Application 2019 & 2032
- Table 88: South Korea US Tofu Industry Volume (K Tons) Forecast, by Application 2019 & 2032
- Table 89: ASEAN US Tofu Industry Revenue (Million) Forecast, by Application 2019 & 2032
- Table 90: ASEAN US Tofu Industry Volume (K Tons) Forecast, by Application 2019 & 2032
- Table 91: Oceania US Tofu Industry Revenue (Million) Forecast, by Application 2019 & 2032
- Table 92: Oceania US Tofu Industry Volume (K Tons) Forecast, by Application 2019 & 2032
- Table 93: Rest of Asia Pacific US Tofu Industry Revenue (Million) Forecast, by Application 2019 & 2032
- Table 94: Rest of Asia Pacific US Tofu Industry Volume (K Tons) Forecast, by Application 2019 & 2032
Frequently Asked Questions
1. What is the projected Compound Annual Growth Rate (CAGR) of the US Tofu Industry?
The projected CAGR is approximately 4.20%.
2. Which companies are prominent players in the US Tofu Industry?
Key companies in the market include American Food Company, Superior Natural LLC, The Hain Celestial Group Inc, Albertsons Companies, Hodo Inc, Pulmuone Corporate, House Foods Group Inc, Morinaga Milk Industry Co Ltd.
3. What are the main segments of the US Tofu Industry?
The market segments include Distribution Channel.
4. Can you provide details about the market size?
The market size is estimated to be USD 421.19 Million as of 2022.
5. What are some drivers contributing to market growth?
Escalating Demand for Processed Poultry Products; Favorable Government Initiatives to Boost Production.
6. What are the notable trends driving market growth?
Increasing demand for new variants in the tofu market through the expanded e-commerce channels drives the market.
7. Are there any restraints impacting market growth?
Rising Vegan Trend among Young Consumers; Deeper Penetration of Red Meat Across Saudi Arabia.
8. Can you provide examples of recent developments in the market?
March 2023: Hodo launched two new block tofus with vibrant global flavors which include Miso Tofu and Indian Spiced Tofu.February 2023: Morinaga Nutritional Foods acquired US plant-based company, Tofurky and its sister brand Moocho. Morinaga has been a tofu supplier for Tofurky products for 17 years. The acquisition of Tofurky and Moocho will help the company to strengthen the integrated supply chain and category growth for the brands.June 2022: Morinaga Nutritional Foods launched Mori-Nu Yuzu Flavored Silken Tofu, known for its velvety smooth texture. The product has a firm texture, is versatile, and can be added to desserts or blended for preparation.
9. What pricing options are available for accessing the report?
Pricing options include single-user, multi-user, and enterprise licenses priced at USD 3800, USD 4500, and USD 5800 respectively.
10. Is the market size provided in terms of value or volume?
The market size is provided in terms of value, measured in Million and volume, measured in K Tons.
11. Are there any specific market keywords associated with the report?
Yes, the market keyword associated with the report is "US Tofu Industry," which aids in identifying and referencing the specific market segment covered.
12. How do I determine which pricing option suits my needs best?
The pricing options vary based on user requirements and access needs. Individual users may opt for single-user licenses, while businesses requiring broader access may choose multi-user or enterprise licenses for cost-effective access to the report.
13. Are there any additional resources or data provided in the US Tofu Industry report?
While the report offers comprehensive insights, it's advisable to review the specific contents or supplementary materials provided to ascertain if additional resources or data are available.
14. How can I stay updated on further developments or reports in the US Tofu Industry?
To stay informed about further developments, trends, and reports in the US Tofu Industry, consider subscribing to industry newsletters, following relevant companies and organizations, or regularly checking reputable industry news sources and publications.
Methodology
Step 1 - Identification of Relevant Samples Size from Population Database


Step 2 - Approaches for Defining Global Market Size (Value, Volume* & Price*)

Note*: In applicable scenarios
Step 3 - Data Sources
Primary Research
- Web Analytics
- Survey Reports
- Research Institute
- Latest Research Reports
- Opinion Leaders
Secondary Research
- Annual Reports
- White Paper
- Latest Press Release
- Industry Association
- Paid Database
- Investor Presentations

Step 4 - Data Triangulation
Involves using different sources of information in order to increase the validity of a study
These sources are likely to be stakeholders in a program - participants, other researchers, program staff, other community members, and so on.
Then we put all data in single framework & apply various statistical tools to find out the dynamic on the market.
During the analysis stage, feedback from the stakeholder groups would be compared to determine areas of agreement as well as areas of divergence
