

Key Insights
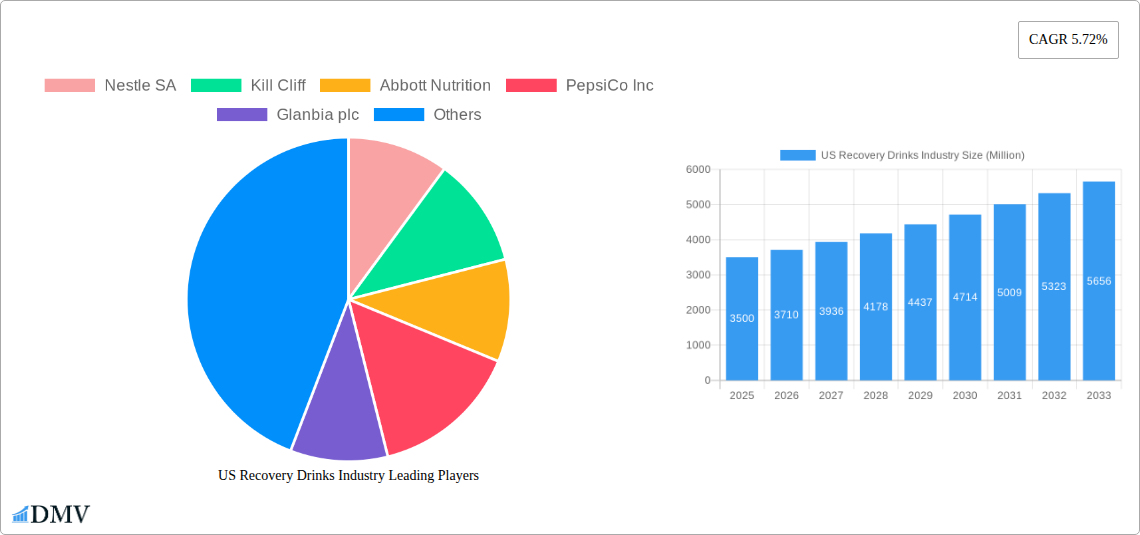
The US recovery drinks market, valued at approximately $3.5 billion in 2025, is projected to experience robust growth, exhibiting a compound annual growth rate (CAGR) of 5.72% from 2025 to 2033. This expansion is fueled by several key drivers. The rising popularity of fitness and athletic activities, coupled with increased consumer awareness of the importance of post-workout recovery, significantly boosts demand. The market's diversification into convenient ready-to-drink (RTD) formats alongside traditional powder options caters to evolving consumer preferences. Furthermore, strategic partnerships between beverage companies and sports nutrition brands create wider product accessibility through diverse distribution channels including supermarkets, specialty stores, convenience stores, and online retailers, driving market penetration. The increasing prevalence of e-commerce further enhances market access, expanding the reach to a broader customer base. However, the market also faces challenges, including ingredient sourcing and fluctuations in raw material costs. The intense competition among established players and emerging brands can also pose hurdles for market expansion.
Segment-wise, the RTD segment is expected to hold a significant market share, driven by its ease of consumption and convenience. Among distribution channels, online retail stores are likely to witness substantial growth, underpinned by the increasing adoption of e-commerce and the convenience of home delivery. Geographically, the Northeast and West regions of the United States are projected to contribute substantially to overall market revenue given their higher population density and strong fitness culture. Key players like Nestle SA, PepsiCo Inc., and Glanbia plc are actively engaged in product innovation and strategic acquisitions to strengthen their market positions. The ongoing research and development efforts focused on creating novel formulations with enhanced functionalities will further invigorate market growth in the coming years.
US Recovery Drinks Industry: Market Analysis & Forecast 2019-2033
This comprehensive report provides an in-depth analysis of the US recovery drinks market, offering crucial insights for stakeholders seeking to navigate this dynamic sector. Valued at $XX Million in 2025, the market is projected to reach $XX Million by 2033, exhibiting a robust CAGR of XX% during the forecast period (2025-2033). The study covers the historical period (2019-2024) and utilizes 2025 as the base year.
US Recovery Drinks Industry Market Composition & Trends
This section dissects the competitive landscape, innovation drivers, and regulatory environment influencing the US recovery drinks market. Market concentration is analyzed, revealing the market share distribution among key players like Nestle SA, PepsiCo Inc, Abbott Nutrition, Glanbia plc, and Danone SA, along with emerging players such as Kill Cliff and Energy Lab Nutrition. The report further examines the impact of mergers and acquisitions (M&A) activity, quantifying deal values and their implications for market consolidation. Innovation is explored through the lens of product diversification, technological advancements in formulation and packaging, and the ongoing evolution of consumer preferences. The regulatory landscape, including labeling requirements and health claims regulations, is critically assessed for its impact on market growth. Finally, the report examines substitute products and their competitive threat, alongside detailed end-user profiles and emerging trends within the market.
- Market Concentration: XX% controlled by top 5 players in 2025.
- M&A Activity (2019-2024): Total deal value estimated at $XX Million.
- Key Innovation Catalysts: Functional ingredients, personalized nutrition, sustainable packaging.
- Regulatory Landscape: Focus on transparency in labeling and health claims substantiation.
US Recovery Drinks Industry Industry Evolution
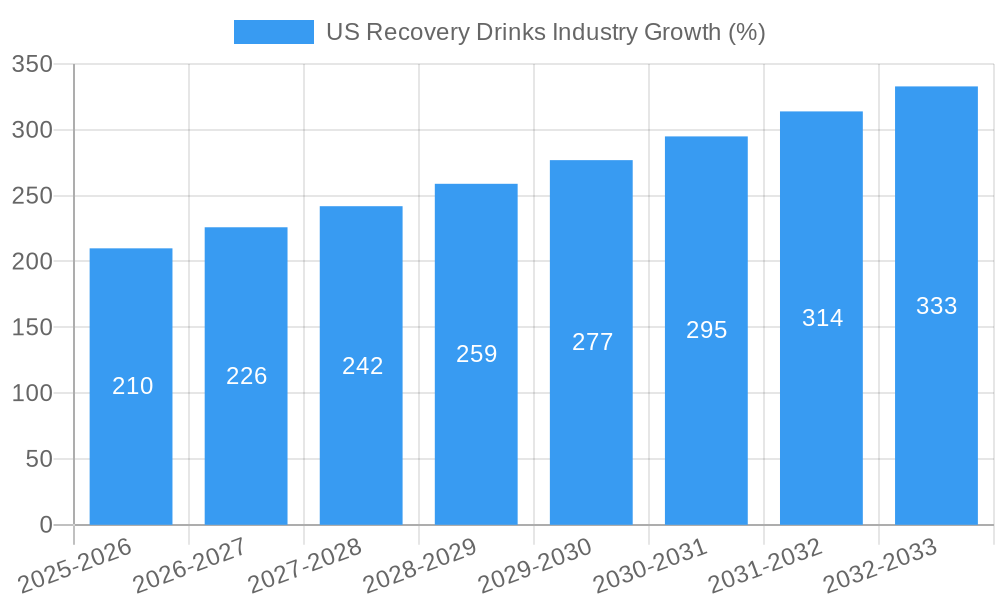
This section traces the evolution of the US recovery drinks market from 2019 to 2033, examining growth trajectories, technological advancements, and the changing demands of health-conscious consumers. Detailed analysis of market growth rates reveals significant expansion driven by factors such as rising health awareness, increasing participation in fitness activities, and the growing popularity of functional beverages. The report explores the adoption of novel technologies in production, packaging, and marketing, highlighting their impact on product innovation and market penetration. Consumer preferences are analyzed, pinpointing the shift towards natural ingredients, clean labels, and personalized nutrition solutions. The impact of these trends on product formulation, distribution strategies, and marketing campaigns is thoroughly examined.
Leading Regions, Countries, or Segments in US Recovery Drinks Industry
This section identifies the leading segments within the US recovery drinks market, analyzing dominance in both product types (RTD, Powder) and distribution channels (Supermarkets/Hypermarkets, Specialty Stores/Health Stores, Convenience Stores, Online Retail Stores, Others).
- Dominant Segment (By Product Type): RTD drinks, fueled by convenience and immediate consumption.
- Dominant Segment (By Distribution Channel): Supermarkets/Hypermarkets, driven by wide reach and established distribution networks.
- Key Drivers (RTD): Consumer preference for convenience, wide availability.
- Key Drivers (Powder): Cost-effectiveness, portability, longer shelf life.
- Key Drivers (Supermarkets/Hypermarkets): High consumer traffic, established infrastructure.
- Key Drivers (Specialty Stores/Health Stores): Focus on health and wellness, specialized product offerings.
US Recovery Drinks Industry Product Innovations
The US recovery drinks market witnesses continuous innovation, driven by advancements in functional ingredients, enhanced taste profiles, and innovative packaging solutions. Companies are focusing on unique selling propositions such as natural ingredients, organic certifications, and tailored formulations for specific athletic activities or dietary needs. Technological advancements, like improved extraction techniques for functional ingredients and advanced packaging materials that enhance shelf life and maintain product quality, are reshaping the market dynamics.
Propelling Factors for US Recovery Drinks Industry Growth
Growth in the US recovery drinks market is propelled by several factors. Increasing health awareness among consumers is driving demand for functional beverages that support athletic performance and recovery. Technological advancements in ingredient sourcing, product formulation, and packaging contribute to innovation and enhanced consumer appeal. Favorable regulatory environments, promoting transparency and responsible labeling, also support market expansion. Further, economic growth and rising disposable incomes contribute to increased spending on premium health and wellness products.
Obstacles in the US Recovery Drinks Industry Market
Despite positive growth trends, the US recovery drinks market faces certain challenges. Intense competition from established and emerging players leads to price pressure and necessitates continuous innovation. Supply chain disruptions, impacting ingredient availability and production costs, can hinder market growth. Strict regulatory landscapes, including stringent labeling requirements and health claims substantiation, add complexities and costs to product development and market entry.
Future Opportunities in US Recovery Drinks Industry
The future of the US recovery drinks market holds significant opportunities. Expanding into niche segments, such as plant-based and personalized nutrition formulations, presents considerable potential. The integration of technology, including personalized nutrition apps and smart packaging, offers scope for enhanced consumer engagement and brand loyalty. Furthermore, tapping into emerging markets and exploring novel distribution channels can unlock new growth avenues.
Major Players in the US Recovery Drinks Industry Ecosystem
- Nestle SA
- Kill Cliff
- Abbott Nutrition
- PepsiCo Inc
- Glanbia plc
- Energy Lab Nutrition
- Fluid Sports Nutrition
- Danone SA
Key Developments in US Recovery Drinks Industry Industry
- 2022-Q4: Nestle SA launches a new line of plant-based recovery drinks.
- 2023-Q1: PepsiCo Inc acquires a smaller recovery drink brand, expanding its portfolio.
- 2023-Q2: New regulations on health claims implemented in California.
Strategic US Recovery Drinks Industry Market Forecast
The US recovery drinks market is poised for continued growth, fueled by ongoing innovation, increasing health consciousness, and expanding distribution channels. Emerging opportunities in personalized nutrition and plant-based formulations will drive future expansion. Strategic partnerships, technological advancements, and effective marketing campaigns will be crucial for success in this competitive market. The market's strong fundamentals and underlying growth drivers indicate substantial potential for expansion over the forecast period.
US Recovery Drinks Industry Segmentation
-
1. Product Type
- 1.1. RTD
- 1.2. Powder
-
2. Distribution Channel
- 2.1. Supermarkets/ Hypermarkets
- 2.2. Specialty Stores/Health Stores
- 2.3. Convenience Stores
- 2.4. Online Retail Stores
- 2.5. Others
US Recovery Drinks Industry Segmentation By Geography
-
1. North America
- 1.1. United States
- 1.2. Canada
- 1.3. Mexico
-
2. South America
- 2.1. Brazil
- 2.2. Argentina
- 2.3. Rest of South America
-
3. Europe
- 3.1. United Kingdom
- 3.2. Germany
- 3.3. France
- 3.4. Italy
- 3.5. Spain
- 3.6. Russia
- 3.7. Benelux
- 3.8. Nordics
- 3.9. Rest of Europe
-
4. Middle East & Africa
- 4.1. Turkey
- 4.2. Israel
- 4.3. GCC
- 4.4. North Africa
- 4.5. South Africa
- 4.6. Rest of Middle East & Africa
-
5. Asia Pacific
- 5.1. China
- 5.2. India
- 5.3. Japan
- 5.4. South Korea
- 5.5. ASEAN
- 5.6. Oceania
- 5.7. Rest of Asia Pacific

US Recovery Drinks Industry REPORT HIGHLIGHTS
| Aspects | Details |
|---|---|
| Study Period | 2019-2033 |
| Base Year | 2024 |
| Estimated Year | 2025 |
| Forecast Period | 2025-2033 |
| Historical Period | 2019-2024 |
| Growth Rate | CAGR of 5.72% from 2019-2033 |
| Segmentation |
|
Table of Contents
- 1. Introduction
- 1.1. Research Scope
- 1.2. Market Segmentation
- 1.3. Research Methodology
- 1.4. Definitions and Assumptions
- 2. Executive Summary
- 2.1. Introduction
- 3. Market Dynamics
- 3.1. Introduction
- 3.2. Market Drivers
- 3.2.1. Demand for specialty and organic coffee pods and capsules; Innovations in packaging formats
- 3.3. Market Restrains
- 3.3.1. Availability of counterfeit products
- 3.4. Market Trends
- 3.4.1 Growing Physical Activity Participation Rate
- 3.4.2 Coupled With Marketing Campaigns
- 4. Market Factor Analysis
- 4.1. Porters Five Forces
- 4.2. Supply/Value Chain
- 4.3. PESTEL analysis
- 4.4. Market Entropy
- 4.5. Patent/Trademark Analysis
- 5. Global US Recovery Drinks Industry Analysis, Insights and Forecast, 2019-2031
- 5.1. Market Analysis, Insights and Forecast - by Product Type
- 5.1.1. RTD
- 5.1.2. Powder
- 5.2. Market Analysis, Insights and Forecast - by Distribution Channel
- 5.2.1. Supermarkets/ Hypermarkets
- 5.2.2. Specialty Stores/Health Stores
- 5.2.3. Convenience Stores
- 5.2.4. Online Retail Stores
- 5.2.5. Others
- 5.3. Market Analysis, Insights and Forecast - by Region
- 5.3.1. North America
- 5.3.2. South America
- 5.3.3. Europe
- 5.3.4. Middle East & Africa
- 5.3.5. Asia Pacific
- 5.1. Market Analysis, Insights and Forecast - by Product Type
- 6. North America US Recovery Drinks Industry Analysis, Insights and Forecast, 2019-2031
- 6.1. Market Analysis, Insights and Forecast - by Product Type
- 6.1.1. RTD
- 6.1.2. Powder
- 6.2. Market Analysis, Insights and Forecast - by Distribution Channel
- 6.2.1. Supermarkets/ Hypermarkets
- 6.2.2. Specialty Stores/Health Stores
- 6.2.3. Convenience Stores
- 6.2.4. Online Retail Stores
- 6.2.5. Others
- 6.1. Market Analysis, Insights and Forecast - by Product Type
- 7. South America US Recovery Drinks Industry Analysis, Insights and Forecast, 2019-2031
- 7.1. Market Analysis, Insights and Forecast - by Product Type
- 7.1.1. RTD
- 7.1.2. Powder
- 7.2. Market Analysis, Insights and Forecast - by Distribution Channel
- 7.2.1. Supermarkets/ Hypermarkets
- 7.2.2. Specialty Stores/Health Stores
- 7.2.3. Convenience Stores
- 7.2.4. Online Retail Stores
- 7.2.5. Others
- 7.1. Market Analysis, Insights and Forecast - by Product Type
- 8. Europe US Recovery Drinks Industry Analysis, Insights and Forecast, 2019-2031
- 8.1. Market Analysis, Insights and Forecast - by Product Type
- 8.1.1. RTD
- 8.1.2. Powder
- 8.2. Market Analysis, Insights and Forecast - by Distribution Channel
- 8.2.1. Supermarkets/ Hypermarkets
- 8.2.2. Specialty Stores/Health Stores
- 8.2.3. Convenience Stores
- 8.2.4. Online Retail Stores
- 8.2.5. Others
- 8.1. Market Analysis, Insights and Forecast - by Product Type
- 9. Middle East & Africa US Recovery Drinks Industry Analysis, Insights and Forecast, 2019-2031
- 9.1. Market Analysis, Insights and Forecast - by Product Type
- 9.1.1. RTD
- 9.1.2. Powder
- 9.2. Market Analysis, Insights and Forecast - by Distribution Channel
- 9.2.1. Supermarkets/ Hypermarkets
- 9.2.2. Specialty Stores/Health Stores
- 9.2.3. Convenience Stores
- 9.2.4. Online Retail Stores
- 9.2.5. Others
- 9.1. Market Analysis, Insights and Forecast - by Product Type
- 10. Asia Pacific US Recovery Drinks Industry Analysis, Insights and Forecast, 2019-2031
- 10.1. Market Analysis, Insights and Forecast - by Product Type
- 10.1.1. RTD
- 10.1.2. Powder
- 10.2. Market Analysis, Insights and Forecast - by Distribution Channel
- 10.2.1. Supermarkets/ Hypermarkets
- 10.2.2. Specialty Stores/Health Stores
- 10.2.3. Convenience Stores
- 10.2.4. Online Retail Stores
- 10.2.5. Others
- 10.1. Market Analysis, Insights and Forecast - by Product Type
- 11. Northeast US Recovery Drinks Industry Analysis, Insights and Forecast, 2019-2031
- 12. Southeast US Recovery Drinks Industry Analysis, Insights and Forecast, 2019-2031
- 13. Midwest US Recovery Drinks Industry Analysis, Insights and Forecast, 2019-2031
- 14. Southwest US Recovery Drinks Industry Analysis, Insights and Forecast, 2019-2031
- 15. West US Recovery Drinks Industry Analysis, Insights and Forecast, 2019-2031
- 16. Competitive Analysis
- 16.1. Global Market Share Analysis 2024
- 16.2. Company Profiles
- 16.2.1 Nestle SA
- 16.2.1.1. Overview
- 16.2.1.2. Products
- 16.2.1.3. SWOT Analysis
- 16.2.1.4. Recent Developments
- 16.2.1.5. Financials (Based on Availability)
- 16.2.2 Kill Cliff
- 16.2.2.1. Overview
- 16.2.2.2. Products
- 16.2.2.3. SWOT Analysis
- 16.2.2.4. Recent Developments
- 16.2.2.5. Financials (Based on Availability)
- 16.2.3 Abbott Nutrition
- 16.2.3.1. Overview
- 16.2.3.2. Products
- 16.2.3.3. SWOT Analysis
- 16.2.3.4. Recent Developments
- 16.2.3.5. Financials (Based on Availability)
- 16.2.4 PepsiCo Inc
- 16.2.4.1. Overview
- 16.2.4.2. Products
- 16.2.4.3. SWOT Analysis
- 16.2.4.4. Recent Developments
- 16.2.4.5. Financials (Based on Availability)
- 16.2.5 Glanbia plc
- 16.2.5.1. Overview
- 16.2.5.2. Products
- 16.2.5.3. SWOT Analysis
- 16.2.5.4. Recent Developments
- 16.2.5.5. Financials (Based on Availability)
- 16.2.6 Energy Lab Nutrition
- 16.2.6.1. Overview
- 16.2.6.2. Products
- 16.2.6.3. SWOT Analysis
- 16.2.6.4. Recent Developments
- 16.2.6.5. Financials (Based on Availability)
- 16.2.7 Fluid Sports Nutrition*List Not Exhaustive
- 16.2.7.1. Overview
- 16.2.7.2. Products
- 16.2.7.3. SWOT Analysis
- 16.2.7.4. Recent Developments
- 16.2.7.5. Financials (Based on Availability)
- 16.2.8 Danone SA
- 16.2.8.1. Overview
- 16.2.8.2. Products
- 16.2.8.3. SWOT Analysis
- 16.2.8.4. Recent Developments
- 16.2.8.5. Financials (Based on Availability)
- 16.2.1 Nestle SA
List of Figures
- Figure 1: Global US Recovery Drinks Industry Revenue Breakdown (Million, %) by Region 2024 & 2032
- Figure 2: United states US Recovery Drinks Industry Revenue (Million), by Country 2024 & 2032
- Figure 3: United states US Recovery Drinks Industry Revenue Share (%), by Country 2024 & 2032
- Figure 4: North America US Recovery Drinks Industry Revenue (Million), by Product Type 2024 & 2032
- Figure 5: North America US Recovery Drinks Industry Revenue Share (%), by Product Type 2024 & 2032
- Figure 6: North America US Recovery Drinks Industry Revenue (Million), by Distribution Channel 2024 & 2032
- Figure 7: North America US Recovery Drinks Industry Revenue Share (%), by Distribution Channel 2024 & 2032
- Figure 8: North America US Recovery Drinks Industry Revenue (Million), by Country 2024 & 2032
- Figure 9: North America US Recovery Drinks Industry Revenue Share (%), by Country 2024 & 2032
- Figure 10: South America US Recovery Drinks Industry Revenue (Million), by Product Type 2024 & 2032
- Figure 11: South America US Recovery Drinks Industry Revenue Share (%), by Product Type 2024 & 2032
- Figure 12: South America US Recovery Drinks Industry Revenue (Million), by Distribution Channel 2024 & 2032
- Figure 13: South America US Recovery Drinks Industry Revenue Share (%), by Distribution Channel 2024 & 2032
- Figure 14: South America US Recovery Drinks Industry Revenue (Million), by Country 2024 & 2032
- Figure 15: South America US Recovery Drinks Industry Revenue Share (%), by Country 2024 & 2032
- Figure 16: Europe US Recovery Drinks Industry Revenue (Million), by Product Type 2024 & 2032
- Figure 17: Europe US Recovery Drinks Industry Revenue Share (%), by Product Type 2024 & 2032
- Figure 18: Europe US Recovery Drinks Industry Revenue (Million), by Distribution Channel 2024 & 2032
- Figure 19: Europe US Recovery Drinks Industry Revenue Share (%), by Distribution Channel 2024 & 2032
- Figure 20: Europe US Recovery Drinks Industry Revenue (Million), by Country 2024 & 2032
- Figure 21: Europe US Recovery Drinks Industry Revenue Share (%), by Country 2024 & 2032
- Figure 22: Middle East & Africa US Recovery Drinks Industry Revenue (Million), by Product Type 2024 & 2032
- Figure 23: Middle East & Africa US Recovery Drinks Industry Revenue Share (%), by Product Type 2024 & 2032
- Figure 24: Middle East & Africa US Recovery Drinks Industry Revenue (Million), by Distribution Channel 2024 & 2032
- Figure 25: Middle East & Africa US Recovery Drinks Industry Revenue Share (%), by Distribution Channel 2024 & 2032
- Figure 26: Middle East & Africa US Recovery Drinks Industry Revenue (Million), by Country 2024 & 2032
- Figure 27: Middle East & Africa US Recovery Drinks Industry Revenue Share (%), by Country 2024 & 2032
- Figure 28: Asia Pacific US Recovery Drinks Industry Revenue (Million), by Product Type 2024 & 2032
- Figure 29: Asia Pacific US Recovery Drinks Industry Revenue Share (%), by Product Type 2024 & 2032
- Figure 30: Asia Pacific US Recovery Drinks Industry Revenue (Million), by Distribution Channel 2024 & 2032
- Figure 31: Asia Pacific US Recovery Drinks Industry Revenue Share (%), by Distribution Channel 2024 & 2032
- Figure 32: Asia Pacific US Recovery Drinks Industry Revenue (Million), by Country 2024 & 2032
- Figure 33: Asia Pacific US Recovery Drinks Industry Revenue Share (%), by Country 2024 & 2032
List of Tables
- Table 1: Global US Recovery Drinks Industry Revenue Million Forecast, by Region 2019 & 2032
- Table 2: Global US Recovery Drinks Industry Revenue Million Forecast, by Product Type 2019 & 2032
- Table 3: Global US Recovery Drinks Industry Revenue Million Forecast, by Distribution Channel 2019 & 2032
- Table 4: Global US Recovery Drinks Industry Revenue Million Forecast, by Region 2019 & 2032
- Table 5: Global US Recovery Drinks Industry Revenue Million Forecast, by Country 2019 & 2032
- Table 6: Northeast US Recovery Drinks Industry Revenue (Million) Forecast, by Application 2019 & 2032
- Table 7: Southeast US Recovery Drinks Industry Revenue (Million) Forecast, by Application 2019 & 2032
- Table 8: Midwest US Recovery Drinks Industry Revenue (Million) Forecast, by Application 2019 & 2032
- Table 9: Southwest US Recovery Drinks Industry Revenue (Million) Forecast, by Application 2019 & 2032
- Table 10: West US Recovery Drinks Industry Revenue (Million) Forecast, by Application 2019 & 2032
- Table 11: Global US Recovery Drinks Industry Revenue Million Forecast, by Product Type 2019 & 2032
- Table 12: Global US Recovery Drinks Industry Revenue Million Forecast, by Distribution Channel 2019 & 2032
- Table 13: Global US Recovery Drinks Industry Revenue Million Forecast, by Country 2019 & 2032
- Table 14: United States US Recovery Drinks Industry Revenue (Million) Forecast, by Application 2019 & 2032
- Table 15: Canada US Recovery Drinks Industry Revenue (Million) Forecast, by Application 2019 & 2032
- Table 16: Mexico US Recovery Drinks Industry Revenue (Million) Forecast, by Application 2019 & 2032
- Table 17: Global US Recovery Drinks Industry Revenue Million Forecast, by Product Type 2019 & 2032
- Table 18: Global US Recovery Drinks Industry Revenue Million Forecast, by Distribution Channel 2019 & 2032
- Table 19: Global US Recovery Drinks Industry Revenue Million Forecast, by Country 2019 & 2032
- Table 20: Brazil US Recovery Drinks Industry Revenue (Million) Forecast, by Application 2019 & 2032
- Table 21: Argentina US Recovery Drinks Industry Revenue (Million) Forecast, by Application 2019 & 2032
- Table 22: Rest of South America US Recovery Drinks Industry Revenue (Million) Forecast, by Application 2019 & 2032
- Table 23: Global US Recovery Drinks Industry Revenue Million Forecast, by Product Type 2019 & 2032
- Table 24: Global US Recovery Drinks Industry Revenue Million Forecast, by Distribution Channel 2019 & 2032
- Table 25: Global US Recovery Drinks Industry Revenue Million Forecast, by Country 2019 & 2032
- Table 26: United Kingdom US Recovery Drinks Industry Revenue (Million) Forecast, by Application 2019 & 2032
- Table 27: Germany US Recovery Drinks Industry Revenue (Million) Forecast, by Application 2019 & 2032
- Table 28: France US Recovery Drinks Industry Revenue (Million) Forecast, by Application 2019 & 2032
- Table 29: Italy US Recovery Drinks Industry Revenue (Million) Forecast, by Application 2019 & 2032
- Table 30: Spain US Recovery Drinks Industry Revenue (Million) Forecast, by Application 2019 & 2032
- Table 31: Russia US Recovery Drinks Industry Revenue (Million) Forecast, by Application 2019 & 2032
- Table 32: Benelux US Recovery Drinks Industry Revenue (Million) Forecast, by Application 2019 & 2032
- Table 33: Nordics US Recovery Drinks Industry Revenue (Million) Forecast, by Application 2019 & 2032
- Table 34: Rest of Europe US Recovery Drinks Industry Revenue (Million) Forecast, by Application 2019 & 2032
- Table 35: Global US Recovery Drinks Industry Revenue Million Forecast, by Product Type 2019 & 2032
- Table 36: Global US Recovery Drinks Industry Revenue Million Forecast, by Distribution Channel 2019 & 2032
- Table 37: Global US Recovery Drinks Industry Revenue Million Forecast, by Country 2019 & 2032
- Table 38: Turkey US Recovery Drinks Industry Revenue (Million) Forecast, by Application 2019 & 2032
- Table 39: Israel US Recovery Drinks Industry Revenue (Million) Forecast, by Application 2019 & 2032
- Table 40: GCC US Recovery Drinks Industry Revenue (Million) Forecast, by Application 2019 & 2032
- Table 41: North Africa US Recovery Drinks Industry Revenue (Million) Forecast, by Application 2019 & 2032
- Table 42: South Africa US Recovery Drinks Industry Revenue (Million) Forecast, by Application 2019 & 2032
- Table 43: Rest of Middle East & Africa US Recovery Drinks Industry Revenue (Million) Forecast, by Application 2019 & 2032
- Table 44: Global US Recovery Drinks Industry Revenue Million Forecast, by Product Type 2019 & 2032
- Table 45: Global US Recovery Drinks Industry Revenue Million Forecast, by Distribution Channel 2019 & 2032
- Table 46: Global US Recovery Drinks Industry Revenue Million Forecast, by Country 2019 & 2032
- Table 47: China US Recovery Drinks Industry Revenue (Million) Forecast, by Application 2019 & 2032
- Table 48: India US Recovery Drinks Industry Revenue (Million) Forecast, by Application 2019 & 2032
- Table 49: Japan US Recovery Drinks Industry Revenue (Million) Forecast, by Application 2019 & 2032
- Table 50: South Korea US Recovery Drinks Industry Revenue (Million) Forecast, by Application 2019 & 2032
- Table 51: ASEAN US Recovery Drinks Industry Revenue (Million) Forecast, by Application 2019 & 2032
- Table 52: Oceania US Recovery Drinks Industry Revenue (Million) Forecast, by Application 2019 & 2032
- Table 53: Rest of Asia Pacific US Recovery Drinks Industry Revenue (Million) Forecast, by Application 2019 & 2032
Frequently Asked Questions
1. What is the projected Compound Annual Growth Rate (CAGR) of the US Recovery Drinks Industry?
The projected CAGR is approximately 5.72%.
2. Which companies are prominent players in the US Recovery Drinks Industry?
Key companies in the market include Nestle SA, Kill Cliff, Abbott Nutrition, PepsiCo Inc, Glanbia plc, Energy Lab Nutrition, Fluid Sports Nutrition*List Not Exhaustive, Danone SA.
3. What are the main segments of the US Recovery Drinks Industry?
The market segments include Product Type, Distribution Channel.
4. Can you provide details about the market size?
The market size is estimated to be USD XX Million as of 2022.
5. What are some drivers contributing to market growth?
Demand for specialty and organic coffee pods and capsules; Innovations in packaging formats.
6. What are the notable trends driving market growth?
Growing Physical Activity Participation Rate. Coupled With Marketing Campaigns.
7. Are there any restraints impacting market growth?
Availability of counterfeit products.
8. Can you provide examples of recent developments in the market?
N/A
9. What pricing options are available for accessing the report?
Pricing options include single-user, multi-user, and enterprise licenses priced at USD 3800, USD 4500, and USD 5800 respectively.
10. Is the market size provided in terms of value or volume?
The market size is provided in terms of value, measured in Million.
11. Are there any specific market keywords associated with the report?
Yes, the market keyword associated with the report is "US Recovery Drinks Industry," which aids in identifying and referencing the specific market segment covered.
12. How do I determine which pricing option suits my needs best?
The pricing options vary based on user requirements and access needs. Individual users may opt for single-user licenses, while businesses requiring broader access may choose multi-user or enterprise licenses for cost-effective access to the report.
13. Are there any additional resources or data provided in the US Recovery Drinks Industry report?
While the report offers comprehensive insights, it's advisable to review the specific contents or supplementary materials provided to ascertain if additional resources or data are available.
14. How can I stay updated on further developments or reports in the US Recovery Drinks Industry?
To stay informed about further developments, trends, and reports in the US Recovery Drinks Industry, consider subscribing to industry newsletters, following relevant companies and organizations, or regularly checking reputable industry news sources and publications.
Methodology
Step 1 - Identification of Relevant Samples Size from Population Database


Step 2 - Approaches for Defining Global Market Size (Value, Volume* & Price*)

Note*: In applicable scenarios
Step 3 - Data Sources
Primary Research
- Web Analytics
- Survey Reports
- Research Institute
- Latest Research Reports
- Opinion Leaders
Secondary Research
- Annual Reports
- White Paper
- Latest Press Release
- Industry Association
- Paid Database
- Investor Presentations

Step 4 - Data Triangulation
Involves using different sources of information in order to increase the validity of a study
These sources are likely to be stakeholders in a program - participants, other researchers, program staff, other community members, and so on.
Then we put all data in single framework & apply various statistical tools to find out the dynamic on the market.
During the analysis stage, feedback from the stakeholder groups would be compared to determine areas of agreement as well as areas of divergence
