

Key Insights
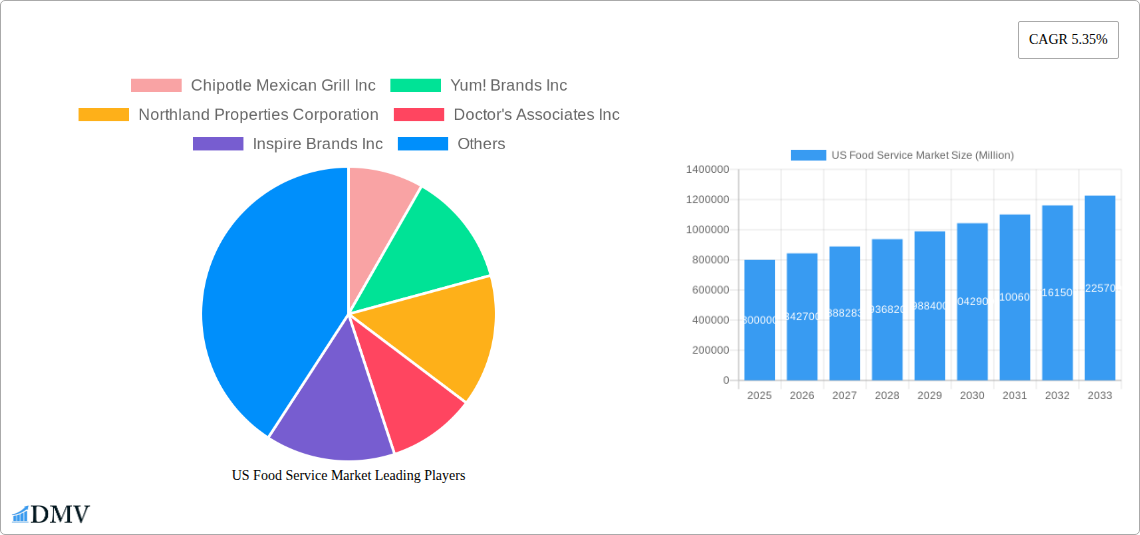
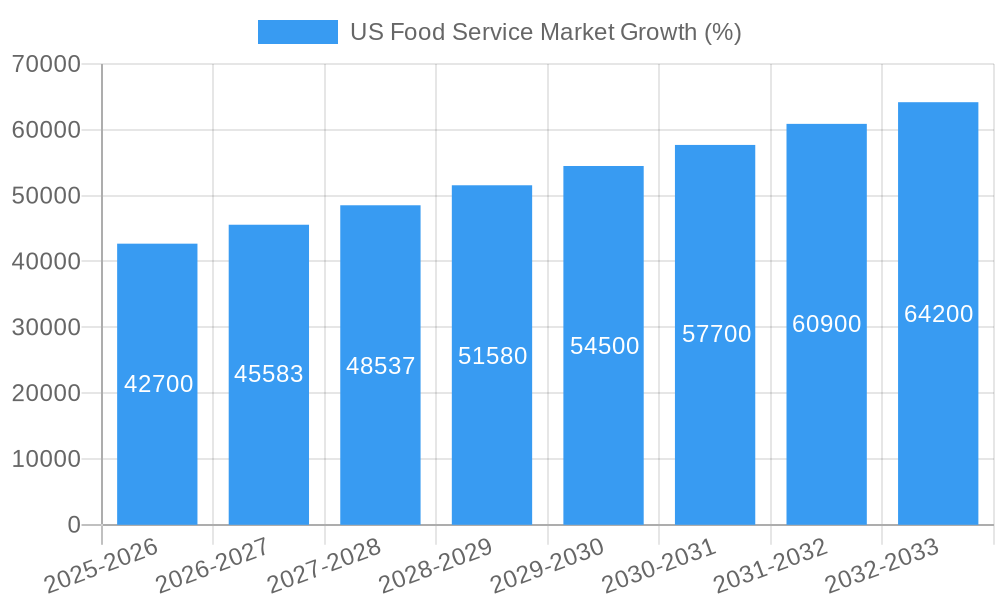
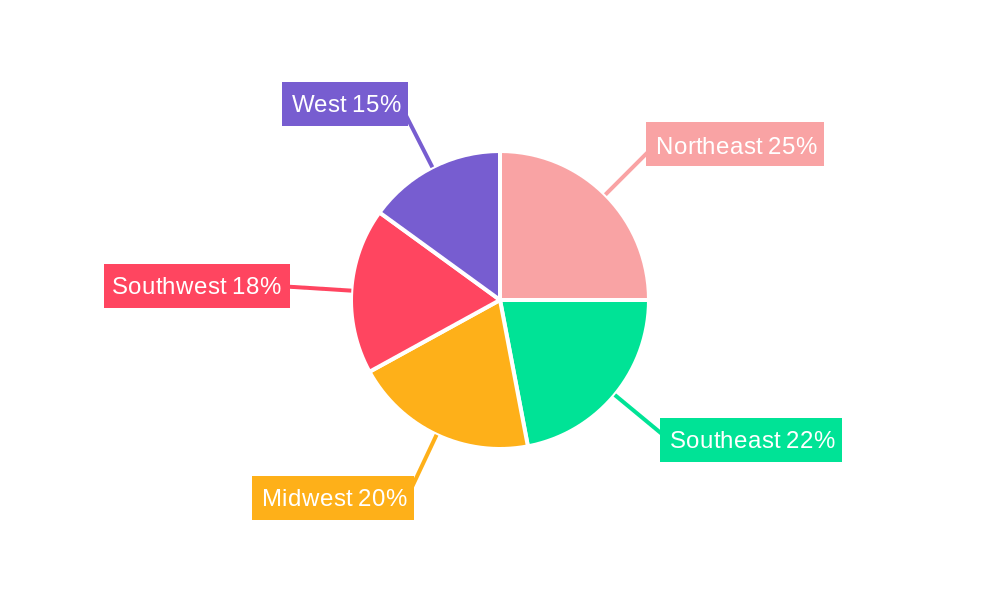
The US food service market, a dynamic and expansive sector, is projected to experience robust growth throughout the forecast period (2025-2033). With a current market size estimated at $800 billion in 2025 and a compound annual growth rate (CAGR) of 5.35%, the market is expected to exceed $1.2 trillion by 2033. This growth is fueled by several key drivers: increasing disposable incomes, changing consumer preferences towards convenience and diverse culinary experiences, and a rise in food delivery services. The shift towards healthier eating options and sustainable practices is also influencing market trends, leading to increased demand for organic and locally sourced ingredients. However, the market faces challenges, including rising labor costs, supply chain disruptions, and increased competition from both established and emerging players. Segmentation analysis reveals significant opportunities within specific areas such as chained outlets, which leverage economies of scale and brand recognition, and the cafes & bars segment, benefitting from evolving social trends and consumer preferences for unique dining experiences. Regional variations exist, with the Northeast and West potentially exhibiting higher growth rates compared to other regions due to higher population densities and robust tourism.
The competitive landscape is highly fragmented, with both large multinational corporations like McDonald's and Yum! Brands and smaller regional chains vying for market share. Success will depend on adapting to evolving consumer demands, embracing technological advancements, and implementing effective marketing strategies. Companies are investing heavily in digital technologies, loyalty programs, and personalized customer experiences to enhance customer engagement and boost sales. The growing popularity of ghost kitchens and cloud kitchens presents both opportunities and challenges, requiring established players to adapt their strategies for effective competition in a rapidly evolving market. Furthermore, understanding consumer preferences based on factors such as age, demographics, and location will be crucial for optimizing marketing strategies and product development. Sustained growth will require continuous innovation, strategic partnerships, and a deep understanding of the changing dynamics within the US food service sector.
US Food Service Market Report: 2019-2033
This comprehensive report provides an in-depth analysis of the US food service market, offering invaluable insights for stakeholders seeking to navigate this dynamic sector. Covering the period from 2019 to 2033, with a focus on 2025, this report unveils key trends, growth drivers, and challenges shaping the future of the industry. The report uses a combination of historical data (2019-2024), estimated data (2025), and forecast data (2025-2033) to provide a complete picture.
US Food Service Market Composition & Trends
This section delves into the competitive landscape of the US food service market, evaluating market concentration, innovation drivers, regulatory influences, substitute products, end-user preferences, and mergers & acquisitions (M&A) activity. The market is characterized by a mix of large multinational corporations and smaller, independent players. Market share distribution reveals a highly fragmented landscape, with the top 5 players accounting for approximately xx% of the total market revenue in 2024, estimated to grow to xx% by 2033. Innovation in areas like technology-driven ordering, personalized experiences, and sustainable practices fuels growth. Strict regulations concerning food safety and labor laws create a complex regulatory landscape. Substitute products, such as meal kits and home-cooked meals, pose an ongoing competitive challenge. End-users are increasingly seeking convenience, value, and healthier options.
- Market Concentration: High fragmentation with a significant presence of both large chains and independent outlets.
- Innovation Catalysts: Technological advancements in ordering systems, kitchen automation, and personalized offerings.
- Regulatory Landscape: Stringent food safety and labor regulations impacting operational costs and strategies.
- Substitute Products: Growing popularity of meal kits and home-cooked meals, impacting demand for some segments.
- End-User Profiles: Diverse customer base seeking convenience, value, healthy options, and unique experiences.
- M&A Activities: Significant M&A activity in recent years, valued at approximately $xx Million in 2024, projected to reach $xx Million by 2033, driven by consolidation and expansion efforts. Examples include MTY Food Group's acquisition of Wetzel’s Pretzels and ongoing strategic partnerships.
US Food Service Market Industry Evolution
This section analyzes the evolving dynamics of the US food service market. The market has witnessed robust growth over the historical period (2019-2024), with a Compound Annual Growth Rate (CAGR) of approximately xx%, driven by factors such as rising disposable incomes, changing consumer preferences, and technological advancements. The market is expected to maintain a healthy growth trajectory during the forecast period (2025-2033), with a projected CAGR of xx%. Technological advancements, including online ordering platforms, delivery services, and mobile payment systems, have significantly altered consumer behavior and operational efficiencies. The increasing demand for healthier, ethically sourced, and sustainable food options has also played a major role in shaping the industry. Furthermore, changing demographic trends and shifting consumer lifestyles continue to reshape the landscape. The adoption of contactless technologies surged significantly post-pandemic, showcasing the industry's adaptability.
Leading Regions, Countries, or Segments in US Food Service Market
This section pinpoints the leading segments and regions within the US food service market.
- Outlet Type: Chained outlets dominate the market, benefiting from brand recognition, economies of scale, and standardized operations. However, independent outlets retain a significant presence, offering unique culinary experiences and localized appeal.
- Location: Standalone restaurants lead in market share, followed by retail locations. The leisure and travel segments exhibit high growth potential, driven by tourism and leisure activities.
- Foodservice Type: Quick Service Restaurants (QSR) and Cafes & Bars represent major segments, with specific cuisines within each category driving variations in market performance. Other QSR cuisines are showing strong growth, reflecting diversified consumer preferences.
Key Drivers:
- Investment Trends: Significant investments in technological infrastructure and expansion of locations in high-growth areas.
- Regulatory Support: Favorable regulatory frameworks in specific regions promoting business growth.
- Consumer Preferences: Growing demand for convenience, health-conscious options, and unique culinary experiences.
US Food Service Market Product Innovations
The US food service market showcases continuous product innovation, focusing on improved food quality, convenience, and customization. Restaurant chains are incorporating technology-driven solutions, such as AI-powered menu recommendations and personalized ordering experiences, to enhance customer engagement. The introduction of plant-based alternatives and healthier menu options reflects a response to changing consumer preferences. Innovation in delivery and packaging solutions strives to optimize speed and sustainability. These innovations aim to provide unique selling propositions, differentiate brands, and increase customer loyalty.
Propelling Factors for US Food Service Market Growth
Several factors propel the growth of the US food service market. Technological advancements, including online ordering and delivery platforms, significantly boost convenience and reach. The rise in disposable incomes increases consumer spending on dining out. Government regulations and initiatives focused on promoting food safety and healthy eating influence market dynamics. The increasing popularity of diverse cuisines and culinary trends fuels demand for variety and unique experiences.
Obstacles in the US Food Service Market
The US food service market faces certain challenges. Strict regulations and compliance costs can impact profitability. Supply chain disruptions, particularly concerning food sourcing and labor availability, pose significant risks. Intense competition and fluctuating input costs create pricing pressures. These factors collectively impact operational efficiency and market stability.
Future Opportunities in US Food Service Market
Emerging opportunities exist within the US food service market. Expansion into underserved regions and demographics holds potential for growth. The adoption of sustainable and eco-friendly practices presents a competitive advantage and appeals to environmentally conscious consumers. Technological innovations, such as automation and AI-powered solutions, offer avenues for enhanced efficiency and cost reduction. Adapting to evolving consumer preferences regarding health, convenience, and personalization unlocks significant opportunities.
Major Players in the US Food Service Market Ecosystem
- Chipotle Mexican Grill Inc
- Yum! Brands Inc
- Northland Properties Corporation
- Doctor's Associates Inc
- Inspire Brands Inc
- Seven & I Holdings Co Ltd
- Brinker International Inc
- Darden Restaurants Inc
- The Wendy's Company
- Domino's Pizza Inc
- Starbucks Corporation
- Papa John's International Inc
- Restaurant Brands International Inc
- McDonald's Corporation
- Bloomin' Brands Inc
- MTY Food Group Inc
Key Developments in US Food Service Market Industry
- November 2022: Papa John's opened its 500th restaurant with a Chipotlane®, expanding its digital order and pick-up capabilities. This demonstrates the increasing importance of digital ordering and convenience in the QSR segment.
- December 2022: MTY Food Group Inc. acquired Wetzel’s Pretzels, expanding its portfolio and market presence in the fast-casual segment. This acquisition signals a trend towards consolidation within the food service industry.
- January 2023: Bloomin' Brands' Outback Steakhouse opened redesigned stores, focusing on enhanced customer experience and ambiance. This reflects the ongoing efforts to upgrade restaurant concepts and enhance customer loyalty.
Strategic US Food Service Market Forecast
The US food service market is poised for continued growth, driven by several factors. Technological advancements, evolving consumer preferences, and strategic acquisitions will shape the industry. Growth will be concentrated in segments focusing on convenience, customization, and health-conscious options. The market presents significant opportunities for players who can effectively adapt to changing consumer demands and leverage technological innovations. The forecast period should see continued expansion, propelled by strong demand and strategic investments.
US Food Service Market Segmentation
-
1. Foodservice Type
-
1.1. Cafes & Bars
-
1.1.1. By Cuisine
- 1.1.1.1. Bars & Pubs
- 1.1.1.2. Juice/Smoothie/Desserts Bars
- 1.1.1.3. Specialist Coffee & Tea Shops
-
1.1.1. By Cuisine
- 1.2. Cloud Kitchen
-
1.3. Full Service Restaurants
- 1.3.1. Asian
- 1.3.2. European
- 1.3.3. Latin American
- 1.3.4. Middle Eastern
- 1.3.5. North American
- 1.3.6. Other FSR Cuisines
-
1.4. Quick Service Restaurants
- 1.4.1. Bakeries
- 1.4.2. Burger
- 1.4.3. Ice Cream
- 1.4.4. Meat-based Cuisines
- 1.4.5. Pizza
- 1.4.6. Other QSR Cuisines
-
1.1. Cafes & Bars
-
2. Outlet
- 2.1. Chained Outlets
- 2.2. Independent Outlets
-
3. Location
- 3.1. Leisure
- 3.2. Lodging
- 3.3. Retail
- 3.4. Standalone
- 3.5. Travel
US Food Service Market Segmentation By Geography
-
1. North America
- 1.1. United States
- 1.2. Canada
- 1.3. Mexico
-
2. South America
- 2.1. Brazil
- 2.2. Argentina
- 2.3. Rest of South America
-
3. Europe
- 3.1. United Kingdom
- 3.2. Germany
- 3.3. France
- 3.4. Italy
- 3.5. Spain
- 3.6. Russia
- 3.7. Benelux
- 3.8. Nordics
- 3.9. Rest of Europe
-
4. Middle East & Africa
- 4.1. Turkey
- 4.2. Israel
- 4.3. GCC
- 4.4. North Africa
- 4.5. South Africa
- 4.6. Rest of Middle East & Africa
-
5. Asia Pacific
- 5.1. China
- 5.2. India
- 5.3. Japan
- 5.4. South Korea
- 5.5. ASEAN
- 5.6. Oceania
- 5.7. Rest of Asia Pacific
US Food Service Market REPORT HIGHLIGHTS
| Aspects | Details |
|---|---|
| Study Period | 2019-2033 |
| Base Year | 2024 |
| Estimated Year | 2025 |
| Forecast Period | 2025-2033 |
| Historical Period | 2019-2024 |
| Growth Rate | CAGR of 5.35% from 2019-2033 |
| Segmentation |
|
Table of Contents
- 1. Introduction
- 1.1. Research Scope
- 1.2. Market Segmentation
- 1.3. Research Methodology
- 1.4. Definitions and Assumptions
- 2. Executive Summary
- 2.1. Introduction
- 3. Market Dynamics
- 3.1. Introduction
- 3.2. Market Drivers
- 3.2.1. Growing Inclination Towards Vegan/Plant-based Protein Sources; Increasing Demand for Functional Protein Beverages
- 3.3. Market Restrains
- 3.3.1. Competition from Substitute Products
- 3.4. Market Trends
- 3.4.1 The introduction of vegan
- 3.4.2 low-sugar
- 3.4.3 and gluten-free options has fuelled the full-service restaurant's growth
- 4. Market Factor Analysis
- 4.1. Porters Five Forces
- 4.2. Supply/Value Chain
- 4.3. PESTEL analysis
- 4.4. Market Entropy
- 4.5. Patent/Trademark Analysis
- 5. Global US Food Service Market Analysis, Insights and Forecast, 2019-2031
- 5.1. Market Analysis, Insights and Forecast - by Foodservice Type
- 5.1.1. Cafes & Bars
- 5.1.1.1. By Cuisine
- 5.1.1.1.1. Bars & Pubs
- 5.1.1.1.2. Juice/Smoothie/Desserts Bars
- 5.1.1.1.3. Specialist Coffee & Tea Shops
- 5.1.1.1. By Cuisine
- 5.1.2. Cloud Kitchen
- 5.1.3. Full Service Restaurants
- 5.1.3.1. Asian
- 5.1.3.2. European
- 5.1.3.3. Latin American
- 5.1.3.4. Middle Eastern
- 5.1.3.5. North American
- 5.1.3.6. Other FSR Cuisines
- 5.1.4. Quick Service Restaurants
- 5.1.4.1. Bakeries
- 5.1.4.2. Burger
- 5.1.4.3. Ice Cream
- 5.1.4.4. Meat-based Cuisines
- 5.1.4.5. Pizza
- 5.1.4.6. Other QSR Cuisines
- 5.1.1. Cafes & Bars
- 5.2. Market Analysis, Insights and Forecast - by Outlet
- 5.2.1. Chained Outlets
- 5.2.2. Independent Outlets
- 5.3. Market Analysis, Insights and Forecast - by Location
- 5.3.1. Leisure
- 5.3.2. Lodging
- 5.3.3. Retail
- 5.3.4. Standalone
- 5.3.5. Travel
- 5.4. Market Analysis, Insights and Forecast - by Region
- 5.4.1. North America
- 5.4.2. South America
- 5.4.3. Europe
- 5.4.4. Middle East & Africa
- 5.4.5. Asia Pacific
- 5.1. Market Analysis, Insights and Forecast - by Foodservice Type
- 6. North America US Food Service Market Analysis, Insights and Forecast, 2019-2031
- 6.1. Market Analysis, Insights and Forecast - by Foodservice Type
- 6.1.1. Cafes & Bars
- 6.1.1.1. By Cuisine
- 6.1.1.1.1. Bars & Pubs
- 6.1.1.1.2. Juice/Smoothie/Desserts Bars
- 6.1.1.1.3. Specialist Coffee & Tea Shops
- 6.1.1.1. By Cuisine
- 6.1.2. Cloud Kitchen
- 6.1.3. Full Service Restaurants
- 6.1.3.1. Asian
- 6.1.3.2. European
- 6.1.3.3. Latin American
- 6.1.3.4. Middle Eastern
- 6.1.3.5. North American
- 6.1.3.6. Other FSR Cuisines
- 6.1.4. Quick Service Restaurants
- 6.1.4.1. Bakeries
- 6.1.4.2. Burger
- 6.1.4.3. Ice Cream
- 6.1.4.4. Meat-based Cuisines
- 6.1.4.5. Pizza
- 6.1.4.6. Other QSR Cuisines
- 6.1.1. Cafes & Bars
- 6.2. Market Analysis, Insights and Forecast - by Outlet
- 6.2.1. Chained Outlets
- 6.2.2. Independent Outlets
- 6.3. Market Analysis, Insights and Forecast - by Location
- 6.3.1. Leisure
- 6.3.2. Lodging
- 6.3.3. Retail
- 6.3.4. Standalone
- 6.3.5. Travel
- 6.1. Market Analysis, Insights and Forecast - by Foodservice Type
- 7. South America US Food Service Market Analysis, Insights and Forecast, 2019-2031
- 7.1. Market Analysis, Insights and Forecast - by Foodservice Type
- 7.1.1. Cafes & Bars
- 7.1.1.1. By Cuisine
- 7.1.1.1.1. Bars & Pubs
- 7.1.1.1.2. Juice/Smoothie/Desserts Bars
- 7.1.1.1.3. Specialist Coffee & Tea Shops
- 7.1.1.1. By Cuisine
- 7.1.2. Cloud Kitchen
- 7.1.3. Full Service Restaurants
- 7.1.3.1. Asian
- 7.1.3.2. European
- 7.1.3.3. Latin American
- 7.1.3.4. Middle Eastern
- 7.1.3.5. North American
- 7.1.3.6. Other FSR Cuisines
- 7.1.4. Quick Service Restaurants
- 7.1.4.1. Bakeries
- 7.1.4.2. Burger
- 7.1.4.3. Ice Cream
- 7.1.4.4. Meat-based Cuisines
- 7.1.4.5. Pizza
- 7.1.4.6. Other QSR Cuisines
- 7.1.1. Cafes & Bars
- 7.2. Market Analysis, Insights and Forecast - by Outlet
- 7.2.1. Chained Outlets
- 7.2.2. Independent Outlets
- 7.3. Market Analysis, Insights and Forecast - by Location
- 7.3.1. Leisure
- 7.3.2. Lodging
- 7.3.3. Retail
- 7.3.4. Standalone
- 7.3.5. Travel
- 7.1. Market Analysis, Insights and Forecast - by Foodservice Type
- 8. Europe US Food Service Market Analysis, Insights and Forecast, 2019-2031
- 8.1. Market Analysis, Insights and Forecast - by Foodservice Type
- 8.1.1. Cafes & Bars
- 8.1.1.1. By Cuisine
- 8.1.1.1.1. Bars & Pubs
- 8.1.1.1.2. Juice/Smoothie/Desserts Bars
- 8.1.1.1.3. Specialist Coffee & Tea Shops
- 8.1.1.1. By Cuisine
- 8.1.2. Cloud Kitchen
- 8.1.3. Full Service Restaurants
- 8.1.3.1. Asian
- 8.1.3.2. European
- 8.1.3.3. Latin American
- 8.1.3.4. Middle Eastern
- 8.1.3.5. North American
- 8.1.3.6. Other FSR Cuisines
- 8.1.4. Quick Service Restaurants
- 8.1.4.1. Bakeries
- 8.1.4.2. Burger
- 8.1.4.3. Ice Cream
- 8.1.4.4. Meat-based Cuisines
- 8.1.4.5. Pizza
- 8.1.4.6. Other QSR Cuisines
- 8.1.1. Cafes & Bars
- 8.2. Market Analysis, Insights and Forecast - by Outlet
- 8.2.1. Chained Outlets
- 8.2.2. Independent Outlets
- 8.3. Market Analysis, Insights and Forecast - by Location
- 8.3.1. Leisure
- 8.3.2. Lodging
- 8.3.3. Retail
- 8.3.4. Standalone
- 8.3.5. Travel
- 8.1. Market Analysis, Insights and Forecast - by Foodservice Type
- 9. Middle East & Africa US Food Service Market Analysis, Insights and Forecast, 2019-2031
- 9.1. Market Analysis, Insights and Forecast - by Foodservice Type
- 9.1.1. Cafes & Bars
- 9.1.1.1. By Cuisine
- 9.1.1.1.1. Bars & Pubs
- 9.1.1.1.2. Juice/Smoothie/Desserts Bars
- 9.1.1.1.3. Specialist Coffee & Tea Shops
- 9.1.1.1. By Cuisine
- 9.1.2. Cloud Kitchen
- 9.1.3. Full Service Restaurants
- 9.1.3.1. Asian
- 9.1.3.2. European
- 9.1.3.3. Latin American
- 9.1.3.4. Middle Eastern
- 9.1.3.5. North American
- 9.1.3.6. Other FSR Cuisines
- 9.1.4. Quick Service Restaurants
- 9.1.4.1. Bakeries
- 9.1.4.2. Burger
- 9.1.4.3. Ice Cream
- 9.1.4.4. Meat-based Cuisines
- 9.1.4.5. Pizza
- 9.1.4.6. Other QSR Cuisines
- 9.1.1. Cafes & Bars
- 9.2. Market Analysis, Insights and Forecast - by Outlet
- 9.2.1. Chained Outlets
- 9.2.2. Independent Outlets
- 9.3. Market Analysis, Insights and Forecast - by Location
- 9.3.1. Leisure
- 9.3.2. Lodging
- 9.3.3. Retail
- 9.3.4. Standalone
- 9.3.5. Travel
- 9.1. Market Analysis, Insights and Forecast - by Foodservice Type
- 10. Asia Pacific US Food Service Market Analysis, Insights and Forecast, 2019-2031
- 10.1. Market Analysis, Insights and Forecast - by Foodservice Type
- 10.1.1. Cafes & Bars
- 10.1.1.1. By Cuisine
- 10.1.1.1.1. Bars & Pubs
- 10.1.1.1.2. Juice/Smoothie/Desserts Bars
- 10.1.1.1.3. Specialist Coffee & Tea Shops
- 10.1.1.1. By Cuisine
- 10.1.2. Cloud Kitchen
- 10.1.3. Full Service Restaurants
- 10.1.3.1. Asian
- 10.1.3.2. European
- 10.1.3.3. Latin American
- 10.1.3.4. Middle Eastern
- 10.1.3.5. North American
- 10.1.3.6. Other FSR Cuisines
- 10.1.4. Quick Service Restaurants
- 10.1.4.1. Bakeries
- 10.1.4.2. Burger
- 10.1.4.3. Ice Cream
- 10.1.4.4. Meat-based Cuisines
- 10.1.4.5. Pizza
- 10.1.4.6. Other QSR Cuisines
- 10.1.1. Cafes & Bars
- 10.2. Market Analysis, Insights and Forecast - by Outlet
- 10.2.1. Chained Outlets
- 10.2.2. Independent Outlets
- 10.3. Market Analysis, Insights and Forecast - by Location
- 10.3.1. Leisure
- 10.3.2. Lodging
- 10.3.3. Retail
- 10.3.4. Standalone
- 10.3.5. Travel
- 10.1. Market Analysis, Insights and Forecast - by Foodservice Type
- 11. Northeast US Food Service Market Analysis, Insights and Forecast, 2019-2031
- 12. Southeast US Food Service Market Analysis, Insights and Forecast, 2019-2031
- 13. Midwest US Food Service Market Analysis, Insights and Forecast, 2019-2031
- 14. Southwest US Food Service Market Analysis, Insights and Forecast, 2019-2031
- 15. West US Food Service Market Analysis, Insights and Forecast, 2019-2031
- 16. Competitive Analysis
- 16.1. Global Market Share Analysis 2024
- 16.2. Company Profiles
- 16.2.1 Chipotle Mexican Grill Inc
- 16.2.1.1. Overview
- 16.2.1.2. Products
- 16.2.1.3. SWOT Analysis
- 16.2.1.4. Recent Developments
- 16.2.1.5. Financials (Based on Availability)
- 16.2.2 Yum! Brands Inc
- 16.2.2.1. Overview
- 16.2.2.2. Products
- 16.2.2.3. SWOT Analysis
- 16.2.2.4. Recent Developments
- 16.2.2.5. Financials (Based on Availability)
- 16.2.3 Northland Properties Corporation
- 16.2.3.1. Overview
- 16.2.3.2. Products
- 16.2.3.3. SWOT Analysis
- 16.2.3.4. Recent Developments
- 16.2.3.5. Financials (Based on Availability)
- 16.2.4 Doctor's Associates Inc
- 16.2.4.1. Overview
- 16.2.4.2. Products
- 16.2.4.3. SWOT Analysis
- 16.2.4.4. Recent Developments
- 16.2.4.5. Financials (Based on Availability)
- 16.2.5 Inspire Brands Inc
- 16.2.5.1. Overview
- 16.2.5.2. Products
- 16.2.5.3. SWOT Analysis
- 16.2.5.4. Recent Developments
- 16.2.5.5. Financials (Based on Availability)
- 16.2.6 Seven & I Holdings Co Ltd
- 16.2.6.1. Overview
- 16.2.6.2. Products
- 16.2.6.3. SWOT Analysis
- 16.2.6.4. Recent Developments
- 16.2.6.5. Financials (Based on Availability)
- 16.2.7 Brinker International Inc
- 16.2.7.1. Overview
- 16.2.7.2. Products
- 16.2.7.3. SWOT Analysis
- 16.2.7.4. Recent Developments
- 16.2.7.5. Financials (Based on Availability)
- 16.2.8 Darden Restaurants Inc
- 16.2.8.1. Overview
- 16.2.8.2. Products
- 16.2.8.3. SWOT Analysis
- 16.2.8.4. Recent Developments
- 16.2.8.5. Financials (Based on Availability)
- 16.2.9 The Wendy's Company
- 16.2.9.1. Overview
- 16.2.9.2. Products
- 16.2.9.3. SWOT Analysis
- 16.2.9.4. Recent Developments
- 16.2.9.5. Financials (Based on Availability)
- 16.2.10 Domino's Pizza Inc
- 16.2.10.1. Overview
- 16.2.10.2. Products
- 16.2.10.3. SWOT Analysis
- 16.2.10.4. Recent Developments
- 16.2.10.5. Financials (Based on Availability)
- 16.2.11 Starbucks Corporation
- 16.2.11.1. Overview
- 16.2.11.2. Products
- 16.2.11.3. SWOT Analysis
- 16.2.11.4. Recent Developments
- 16.2.11.5. Financials (Based on Availability)
- 16.2.12 Papa John's International Inc
- 16.2.12.1. Overview
- 16.2.12.2. Products
- 16.2.12.3. SWOT Analysis
- 16.2.12.4. Recent Developments
- 16.2.12.5. Financials (Based on Availability)
- 16.2.13 Restaurant Brands International Inc
- 16.2.13.1. Overview
- 16.2.13.2. Products
- 16.2.13.3. SWOT Analysis
- 16.2.13.4. Recent Developments
- 16.2.13.5. Financials (Based on Availability)
- 16.2.14 McDonald's Corporation
- 16.2.14.1. Overview
- 16.2.14.2. Products
- 16.2.14.3. SWOT Analysis
- 16.2.14.4. Recent Developments
- 16.2.14.5. Financials (Based on Availability)
- 16.2.15 Bloomin' Brands Inc
- 16.2.15.1. Overview
- 16.2.15.2. Products
- 16.2.15.3. SWOT Analysis
- 16.2.15.4. Recent Developments
- 16.2.15.5. Financials (Based on Availability)
- 16.2.16 MTY Food Group Inc
- 16.2.16.1. Overview
- 16.2.16.2. Products
- 16.2.16.3. SWOT Analysis
- 16.2.16.4. Recent Developments
- 16.2.16.5. Financials (Based on Availability)
- 16.2.1 Chipotle Mexican Grill Inc
List of Figures
- Figure 1: Global US Food Service Market Revenue Breakdown (Million, %) by Region 2024 & 2032
- Figure 2: United states US Food Service Market Revenue (Million), by Country 2024 & 2032
- Figure 3: United states US Food Service Market Revenue Share (%), by Country 2024 & 2032
- Figure 4: North America US Food Service Market Revenue (Million), by Foodservice Type 2024 & 2032
- Figure 5: North America US Food Service Market Revenue Share (%), by Foodservice Type 2024 & 2032
- Figure 6: North America US Food Service Market Revenue (Million), by Outlet 2024 & 2032
- Figure 7: North America US Food Service Market Revenue Share (%), by Outlet 2024 & 2032
- Figure 8: North America US Food Service Market Revenue (Million), by Location 2024 & 2032
- Figure 9: North America US Food Service Market Revenue Share (%), by Location 2024 & 2032
- Figure 10: North America US Food Service Market Revenue (Million), by Country 2024 & 2032
- Figure 11: North America US Food Service Market Revenue Share (%), by Country 2024 & 2032
- Figure 12: South America US Food Service Market Revenue (Million), by Foodservice Type 2024 & 2032
- Figure 13: South America US Food Service Market Revenue Share (%), by Foodservice Type 2024 & 2032
- Figure 14: South America US Food Service Market Revenue (Million), by Outlet 2024 & 2032
- Figure 15: South America US Food Service Market Revenue Share (%), by Outlet 2024 & 2032
- Figure 16: South America US Food Service Market Revenue (Million), by Location 2024 & 2032
- Figure 17: South America US Food Service Market Revenue Share (%), by Location 2024 & 2032
- Figure 18: South America US Food Service Market Revenue (Million), by Country 2024 & 2032
- Figure 19: South America US Food Service Market Revenue Share (%), by Country 2024 & 2032
- Figure 20: Europe US Food Service Market Revenue (Million), by Foodservice Type 2024 & 2032
- Figure 21: Europe US Food Service Market Revenue Share (%), by Foodservice Type 2024 & 2032
- Figure 22: Europe US Food Service Market Revenue (Million), by Outlet 2024 & 2032
- Figure 23: Europe US Food Service Market Revenue Share (%), by Outlet 2024 & 2032
- Figure 24: Europe US Food Service Market Revenue (Million), by Location 2024 & 2032
- Figure 25: Europe US Food Service Market Revenue Share (%), by Location 2024 & 2032
- Figure 26: Europe US Food Service Market Revenue (Million), by Country 2024 & 2032
- Figure 27: Europe US Food Service Market Revenue Share (%), by Country 2024 & 2032
- Figure 28: Middle East & Africa US Food Service Market Revenue (Million), by Foodservice Type 2024 & 2032
- Figure 29: Middle East & Africa US Food Service Market Revenue Share (%), by Foodservice Type 2024 & 2032
- Figure 30: Middle East & Africa US Food Service Market Revenue (Million), by Outlet 2024 & 2032
- Figure 31: Middle East & Africa US Food Service Market Revenue Share (%), by Outlet 2024 & 2032
- Figure 32: Middle East & Africa US Food Service Market Revenue (Million), by Location 2024 & 2032
- Figure 33: Middle East & Africa US Food Service Market Revenue Share (%), by Location 2024 & 2032
- Figure 34: Middle East & Africa US Food Service Market Revenue (Million), by Country 2024 & 2032
- Figure 35: Middle East & Africa US Food Service Market Revenue Share (%), by Country 2024 & 2032
- Figure 36: Asia Pacific US Food Service Market Revenue (Million), by Foodservice Type 2024 & 2032
- Figure 37: Asia Pacific US Food Service Market Revenue Share (%), by Foodservice Type 2024 & 2032
- Figure 38: Asia Pacific US Food Service Market Revenue (Million), by Outlet 2024 & 2032
- Figure 39: Asia Pacific US Food Service Market Revenue Share (%), by Outlet 2024 & 2032
- Figure 40: Asia Pacific US Food Service Market Revenue (Million), by Location 2024 & 2032
- Figure 41: Asia Pacific US Food Service Market Revenue Share (%), by Location 2024 & 2032
- Figure 42: Asia Pacific US Food Service Market Revenue (Million), by Country 2024 & 2032
- Figure 43: Asia Pacific US Food Service Market Revenue Share (%), by Country 2024 & 2032
List of Tables
- Table 1: Global US Food Service Market Revenue Million Forecast, by Region 2019 & 2032
- Table 2: Global US Food Service Market Revenue Million Forecast, by Foodservice Type 2019 & 2032
- Table 3: Global US Food Service Market Revenue Million Forecast, by Outlet 2019 & 2032
- Table 4: Global US Food Service Market Revenue Million Forecast, by Location 2019 & 2032
- Table 5: Global US Food Service Market Revenue Million Forecast, by Region 2019 & 2032
- Table 6: Global US Food Service Market Revenue Million Forecast, by Country 2019 & 2032
- Table 7: Northeast US Food Service Market Revenue (Million) Forecast, by Application 2019 & 2032
- Table 8: Southeast US Food Service Market Revenue (Million) Forecast, by Application 2019 & 2032
- Table 9: Midwest US Food Service Market Revenue (Million) Forecast, by Application 2019 & 2032
- Table 10: Southwest US Food Service Market Revenue (Million) Forecast, by Application 2019 & 2032
- Table 11: West US Food Service Market Revenue (Million) Forecast, by Application 2019 & 2032
- Table 12: Global US Food Service Market Revenue Million Forecast, by Foodservice Type 2019 & 2032
- Table 13: Global US Food Service Market Revenue Million Forecast, by Outlet 2019 & 2032
- Table 14: Global US Food Service Market Revenue Million Forecast, by Location 2019 & 2032
- Table 15: Global US Food Service Market Revenue Million Forecast, by Country 2019 & 2032
- Table 16: United States US Food Service Market Revenue (Million) Forecast, by Application 2019 & 2032
- Table 17: Canada US Food Service Market Revenue (Million) Forecast, by Application 2019 & 2032
- Table 18: Mexico US Food Service Market Revenue (Million) Forecast, by Application 2019 & 2032
- Table 19: Global US Food Service Market Revenue Million Forecast, by Foodservice Type 2019 & 2032
- Table 20: Global US Food Service Market Revenue Million Forecast, by Outlet 2019 & 2032
- Table 21: Global US Food Service Market Revenue Million Forecast, by Location 2019 & 2032
- Table 22: Global US Food Service Market Revenue Million Forecast, by Country 2019 & 2032
- Table 23: Brazil US Food Service Market Revenue (Million) Forecast, by Application 2019 & 2032
- Table 24: Argentina US Food Service Market Revenue (Million) Forecast, by Application 2019 & 2032
- Table 25: Rest of South America US Food Service Market Revenue (Million) Forecast, by Application 2019 & 2032
- Table 26: Global US Food Service Market Revenue Million Forecast, by Foodservice Type 2019 & 2032
- Table 27: Global US Food Service Market Revenue Million Forecast, by Outlet 2019 & 2032
- Table 28: Global US Food Service Market Revenue Million Forecast, by Location 2019 & 2032
- Table 29: Global US Food Service Market Revenue Million Forecast, by Country 2019 & 2032
- Table 30: United Kingdom US Food Service Market Revenue (Million) Forecast, by Application 2019 & 2032
- Table 31: Germany US Food Service Market Revenue (Million) Forecast, by Application 2019 & 2032
- Table 32: France US Food Service Market Revenue (Million) Forecast, by Application 2019 & 2032
- Table 33: Italy US Food Service Market Revenue (Million) Forecast, by Application 2019 & 2032
- Table 34: Spain US Food Service Market Revenue (Million) Forecast, by Application 2019 & 2032
- Table 35: Russia US Food Service Market Revenue (Million) Forecast, by Application 2019 & 2032
- Table 36: Benelux US Food Service Market Revenue (Million) Forecast, by Application 2019 & 2032
- Table 37: Nordics US Food Service Market Revenue (Million) Forecast, by Application 2019 & 2032
- Table 38: Rest of Europe US Food Service Market Revenue (Million) Forecast, by Application 2019 & 2032
- Table 39: Global US Food Service Market Revenue Million Forecast, by Foodservice Type 2019 & 2032
- Table 40: Global US Food Service Market Revenue Million Forecast, by Outlet 2019 & 2032
- Table 41: Global US Food Service Market Revenue Million Forecast, by Location 2019 & 2032
- Table 42: Global US Food Service Market Revenue Million Forecast, by Country 2019 & 2032
- Table 43: Turkey US Food Service Market Revenue (Million) Forecast, by Application 2019 & 2032
- Table 44: Israel US Food Service Market Revenue (Million) Forecast, by Application 2019 & 2032
- Table 45: GCC US Food Service Market Revenue (Million) Forecast, by Application 2019 & 2032
- Table 46: North Africa US Food Service Market Revenue (Million) Forecast, by Application 2019 & 2032
- Table 47: South Africa US Food Service Market Revenue (Million) Forecast, by Application 2019 & 2032
- Table 48: Rest of Middle East & Africa US Food Service Market Revenue (Million) Forecast, by Application 2019 & 2032
- Table 49: Global US Food Service Market Revenue Million Forecast, by Foodservice Type 2019 & 2032
- Table 50: Global US Food Service Market Revenue Million Forecast, by Outlet 2019 & 2032
- Table 51: Global US Food Service Market Revenue Million Forecast, by Location 2019 & 2032
- Table 52: Global US Food Service Market Revenue Million Forecast, by Country 2019 & 2032
- Table 53: China US Food Service Market Revenue (Million) Forecast, by Application 2019 & 2032
- Table 54: India US Food Service Market Revenue (Million) Forecast, by Application 2019 & 2032
- Table 55: Japan US Food Service Market Revenue (Million) Forecast, by Application 2019 & 2032
- Table 56: South Korea US Food Service Market Revenue (Million) Forecast, by Application 2019 & 2032
- Table 57: ASEAN US Food Service Market Revenue (Million) Forecast, by Application 2019 & 2032
- Table 58: Oceania US Food Service Market Revenue (Million) Forecast, by Application 2019 & 2032
- Table 59: Rest of Asia Pacific US Food Service Market Revenue (Million) Forecast, by Application 2019 & 2032
Frequently Asked Questions
1. What is the projected Compound Annual Growth Rate (CAGR) of the US Food Service Market?
The projected CAGR is approximately 5.35%.
2. Which companies are prominent players in the US Food Service Market?
Key companies in the market include Chipotle Mexican Grill Inc, Yum! Brands Inc, Northland Properties Corporation, Doctor's Associates Inc, Inspire Brands Inc, Seven & I Holdings Co Ltd, Brinker International Inc, Darden Restaurants Inc, The Wendy's Company, Domino's Pizza Inc, Starbucks Corporation, Papa John's International Inc, Restaurant Brands International Inc, McDonald's Corporation, Bloomin' Brands Inc, MTY Food Group Inc.
3. What are the main segments of the US Food Service Market?
The market segments include Foodservice Type, Outlet, Location.
4. Can you provide details about the market size?
The market size is estimated to be USD XX Million as of 2022.
5. What are some drivers contributing to market growth?
Growing Inclination Towards Vegan/Plant-based Protein Sources; Increasing Demand for Functional Protein Beverages.
6. What are the notable trends driving market growth?
The introduction of vegan. low-sugar. and gluten-free options has fuelled the full-service restaurant's growth.
7. Are there any restraints impacting market growth?
Competition from Substitute Products.
8. Can you provide examples of recent developments in the market?
January 2023: Bloomin' Brands declared that its brand Outback Steakhouse opened its redesigned stores in Spring's Grand Parkway Marketplace.December 2022: MTY Food Group Inc., one of its wholly owned subsidiaries, acquired all of the issued and outstanding shares of COP WP Parent Inc. (Wetzel’s Pretzels) from CenterOak Partners. Wetzel’s Pretzels is an American chain of fast-food restaurants specializing in pretzels and hot dogs, operating in the United States, Canada, and Central America.November 2022: Papa John's opened its 500th restaurant with a Chipotlane®, the brand's digital order drive-thru pick-up lane in Louisville, United States.
9. What pricing options are available for accessing the report?
Pricing options include single-user, multi-user, and enterprise licenses priced at USD 3800, USD 4500, and USD 5800 respectively.
10. Is the market size provided in terms of value or volume?
The market size is provided in terms of value, measured in Million.
11. Are there any specific market keywords associated with the report?
Yes, the market keyword associated with the report is "US Food Service Market," which aids in identifying and referencing the specific market segment covered.
12. How do I determine which pricing option suits my needs best?
The pricing options vary based on user requirements and access needs. Individual users may opt for single-user licenses, while businesses requiring broader access may choose multi-user or enterprise licenses for cost-effective access to the report.
13. Are there any additional resources or data provided in the US Food Service Market report?
While the report offers comprehensive insights, it's advisable to review the specific contents or supplementary materials provided to ascertain if additional resources or data are available.
14. How can I stay updated on further developments or reports in the US Food Service Market?
To stay informed about further developments, trends, and reports in the US Food Service Market, consider subscribing to industry newsletters, following relevant companies and organizations, or regularly checking reputable industry news sources and publications.
Methodology
Step 1 - Identification of Relevant Samples Size from Population Database


Step 2 - Approaches for Defining Global Market Size (Value, Volume* & Price*)

Note*: In applicable scenarios
Step 3 - Data Sources
Primary Research
- Web Analytics
- Survey Reports
- Research Institute
- Latest Research Reports
- Opinion Leaders
Secondary Research
- Annual Reports
- White Paper
- Latest Press Release
- Industry Association
- Paid Database
- Investor Presentations

Step 4 - Data Triangulation
Involves using different sources of information in order to increase the validity of a study
These sources are likely to be stakeholders in a program - participants, other researchers, program staff, other community members, and so on.
Then we put all data in single framework & apply various statistical tools to find out the dynamic on the market.
During the analysis stage, feedback from the stakeholder groups would be compared to determine areas of agreement as well as areas of divergence
