

Key Insights
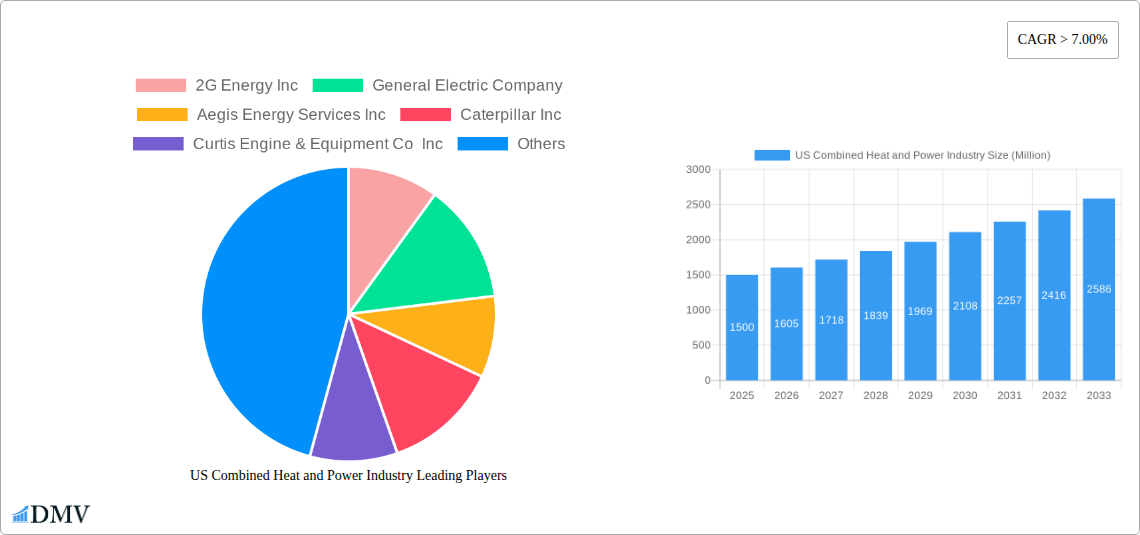
The US Combined Heat and Power (CHP) industry is experiencing robust growth, projected to maintain a Compound Annual Growth Rate (CAGR) exceeding 7% from 2025 to 2033. This expansion is driven by several key factors. Increasing energy costs and the urgent need for enhanced energy efficiency are compelling businesses and municipalities to adopt CHP systems. These systems offer significant cost savings by simultaneously generating electricity and heat, reducing reliance on separate energy sources. Furthermore, growing environmental concerns and stringent emission regulations are propelling the adoption of cleaner CHP technologies, such as those fueled by natural gas and renewable sources. Government incentives and policies aimed at promoting energy independence and reducing carbon footprints also contribute significantly to the market's positive trajectory. The market segmentation is likely diverse, encompassing various CHP system sizes and technologies tailored to specific applications across different sectors, including industrial, commercial, and institutional facilities. Leading players like General Electric, Caterpillar, and 2G Energy are actively involved in developing and supplying advanced CHP systems, fostering competition and innovation within the industry.
The forecast period of 2025-2033 shows considerable potential for growth, especially in sectors prioritizing sustainability and operational efficiency. However, potential restraints include high upfront capital costs associated with CHP system installation, which may deter smaller businesses. Technological advancements and increased availability of financing options will likely mitigate this barrier. Regional variations in market penetration exist, with densely populated areas and regions with robust industrial activity experiencing higher adoption rates. As technological advancements continue to enhance the efficiency and reduce the environmental impact of CHP systems, the US market is poised for further expansion, with significant opportunities for both established players and emerging technology providers. The market's future growth is strongly linked to continued policy support for renewable energy integration and sustained focus on energy efficiency improvements across various sectors.
US Combined Heat and Power (CHP) Industry Market Report: 2019-2033
This comprehensive report provides a detailed analysis of the US Combined Heat and Power (CHP) industry, offering invaluable insights for stakeholders seeking to understand market dynamics, growth opportunities, and competitive landscapes. Covering the period from 2019 to 2033, with a focus on 2025, this report is essential for strategic decision-making within the CHP sector. The market is projected to reach xx Million by 2033, exhibiting significant growth potential.
US Combined Heat and Power Industry Market Composition & Trends
This section dives deep into the competitive landscape of the US CHP market, examining market concentration, technological innovation drivers, regulatory frameworks, substitute product analysis, end-user behavior, and mergers and acquisitions (M&A) activity. We analyze market share distribution amongst key players, revealing the dominance of certain companies and identifying emerging competitors. Furthermore, the report quantifies the impact of M&A activity, analyzing deal values and their influence on market consolidation. The historical period (2019-2024) provides a benchmark for understanding current trends and future projections. The estimated market size in 2025 is projected to be xx Million.
- Market Concentration: Analysis of market share held by top players, including General Electric Company, Caterpillar Inc, and others. We will quantify the market share distribution and identify any significant shifts.
- Innovation Catalysts: Detailed examination of technological advancements driving CHP market growth, such as advancements in energy efficiency and renewable energy integration.
- Regulatory Landscape: Assessment of the impact of federal and state regulations on CHP market development, including incentives and emission standards.
- Substitute Products: Analysis of alternative energy solutions and their competitive impact on the CHP market.
- End-User Profiles: Segmentation of end-users based on industry, size, and energy consumption patterns, highlighting specific needs and adoption rates of CHP technologies.
- M&A Activities: Comprehensive overview of recent mergers and acquisitions, including deal values and their implications for market consolidation and competitive dynamics. Total M&A deal value during the study period is estimated at xx Million.
US Combined Heat and Power Industry Industry Evolution
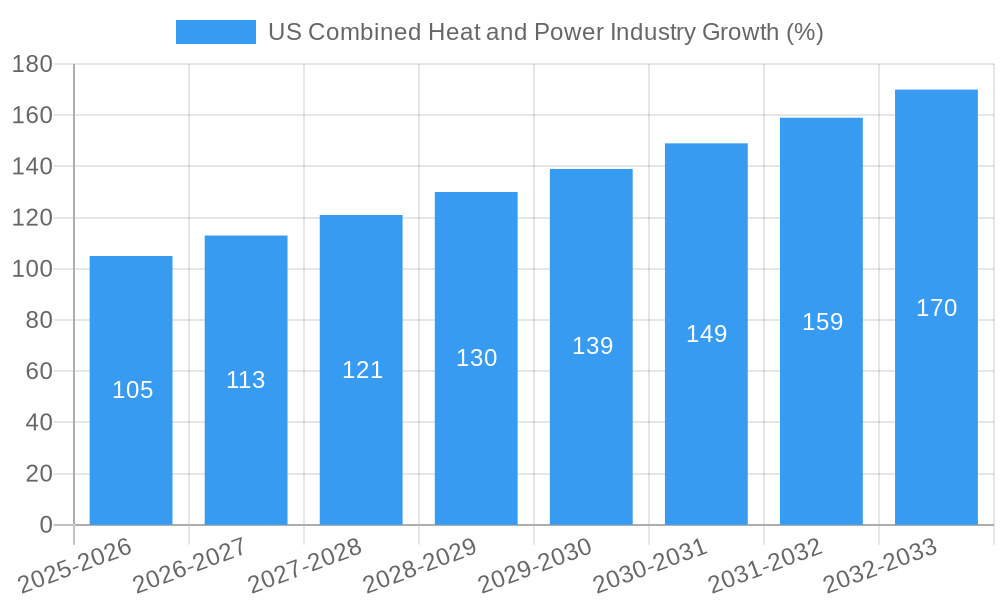
This section meticulously charts the evolution of the US CHP industry, tracing market growth trajectories, highlighting technological advancements that have reshaped the sector, and analyzing the changing demands of consumers. We present a detailed picture of market growth rates and technology adoption metrics over the historical period (2019-2024) and project these trends into the forecast period (2025-2033). The analysis considers factors such as regulatory changes, technological breakthroughs, and evolving energy needs across diverse end-user sectors. Specific data points on growth rates and adoption of new CHP technologies will be presented. For example, the adoption rate of x technology is predicted to increase by xx% between 2025 and 2033.
Leading Regions, Countries, or Segments in US Combined Heat and Power Industry
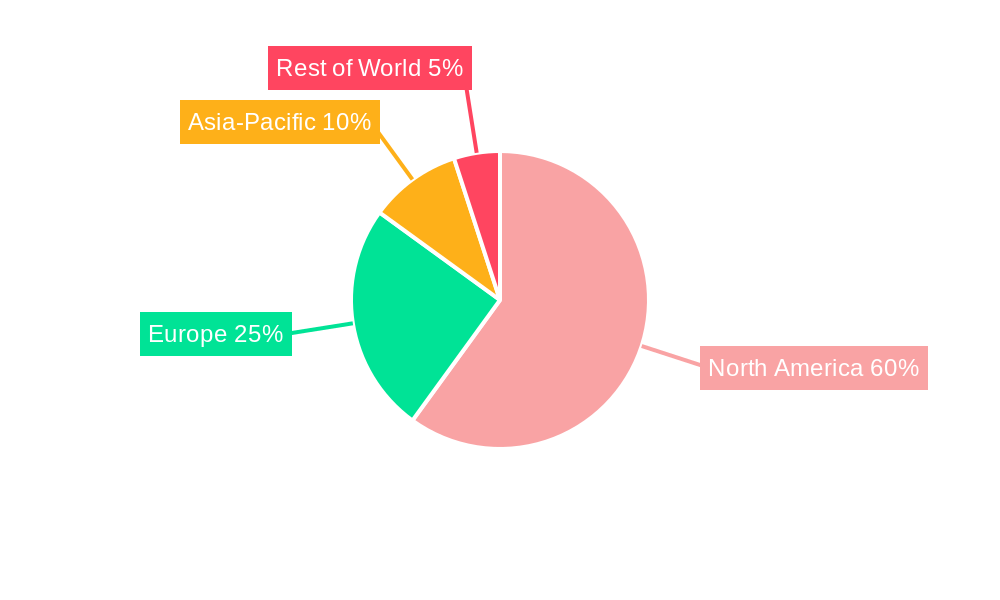
This section pinpoints the dominant regions, countries, or segments within the US CHP market. We conduct a detailed analysis of the factors driving the dominance of these specific areas. Using both paragraphs and bullet points, this segment provides a granular understanding of investment trends, regulatory frameworks, and market specific dynamics. The reasons behind market leadership are meticulously analyzed and illustrated with concrete examples.
- Key Drivers:
- Investment trends in specific regions (e.g., government incentives, private investment).
- Regulatory support and policies favoring CHP development in certain areas.
- Presence of key players and their strategic focus.
- Abundance of resources and infrastructure.
US Combined Heat and Power Industry Product Innovations
This section details the latest product innovations, applications, and performance metrics within the US CHP industry. We highlight the unique selling propositions of new products and technologies, focusing on key advancements driving market growth. Specific examples of innovative CHP systems and their efficiency improvements will be provided.
Propelling Factors for US Combined Heat and Power Industry Growth
This section identifies and analyzes the key drivers stimulating growth within the US CHP market. We will focus on technological advancements, economic incentives, and favorable regulatory environments, providing specific examples to illustrate their impact. Factors such as decreasing costs of CHP technologies, increasing energy prices, and government incentives promoting energy efficiency will be examined.
Obstacles in the US Combined Heat and Power Industry Market
This section identifies and evaluates the major barriers and restraints hindering growth in the US CHP market. We analyze the quantifiable impact of regulatory challenges, supply chain vulnerabilities, and competitive pressures. Specific examples of these obstacles and their effect on market expansion will be given.
Future Opportunities in US Combined Heat and Power Industry
This section highlights emerging opportunities for growth within the US CHP market. We focus on new market segments, technological advancements, and evolving consumer trends that promise significant future potential. We'll look at areas such as integration with renewable energy sources, expansion into new application areas, and advancements in energy storage.
Major Players in the US Combined Heat and Power Industry Ecosystem
- 2G Energy Inc
- General Electric Company
- Aegis Energy Services Inc
- Caterpillar Inc
- Curtis Engine & Equipment Co Inc
- Yanmar America Corp
Key Developments in US Combined Heat and Power Industry Industry
This section presents a timeline of key developments, including product launches, mergers, and acquisitions, along with their impact on market dynamics. Each bullet point will include the year and month of the development.
Strategic US Combined Heat and Power Industry Market Forecast
This concluding section summarizes the key growth catalysts identified in the report and provides a concise outlook on the future of the US CHP market. We will emphasize the potential for expansion and the opportunities available to industry stakeholders. We will also reiterate the projected market size of xx Million by 2033.
US Combined Heat and Power Industry Segmentation
-
1. Applicaton
- 1.1. Commercial
- 1.2. Industrial
-
2. Fuel Type
- 2.1. Natural Gas
- 2.2. Renewable
- 2.3. Coal
- 2.4. Other Fuel Types
US Combined Heat and Power Industry Segmentation By Geography
-
1. North America
- 1.1. United States
- 1.2. Canada
- 1.3. Mexico
-
2. South America
- 2.1. Brazil
- 2.2. Argentina
- 2.3. Rest of South America
-
3. Europe
- 3.1. United Kingdom
- 3.2. Germany
- 3.3. France
- 3.4. Italy
- 3.5. Spain
- 3.6. Russia
- 3.7. Benelux
- 3.8. Nordics
- 3.9. Rest of Europe
-
4. Middle East & Africa
- 4.1. Turkey
- 4.2. Israel
- 4.3. GCC
- 4.4. North Africa
- 4.5. South Africa
- 4.6. Rest of Middle East & Africa
-
5. Asia Pacific
- 5.1. China
- 5.2. India
- 5.3. Japan
- 5.4. South Korea
- 5.5. ASEAN
- 5.6. Oceania
- 5.7. Rest of Asia Pacific
US Combined Heat and Power Industry REPORT HIGHLIGHTS
| Aspects | Details |
|---|---|
| Study Period | 2019-2033 |
| Base Year | 2024 |
| Estimated Year | 2025 |
| Forecast Period | 2025-2033 |
| Historical Period | 2019-2024 |
| Growth Rate | CAGR of > 7.00% from 2019-2033 |
| Segmentation |
|
Table of Contents
- 1. Introduction
- 1.1. Research Scope
- 1.2. Market Segmentation
- 1.3. Research Methodology
- 1.4. Definitions and Assumptions
- 2. Executive Summary
- 2.1. Introduction
- 3. Market Dynamics
- 3.1. Introduction
- 3.2. Market Drivers
- 3.3. Market Restrains
- 3.4. Market Trends
- 3.4.1. Natural Gas-based CHP is Expected to Dominate the Market
- 4. Market Factor Analysis
- 4.1. Porters Five Forces
- 4.2. Supply/Value Chain
- 4.3. PESTEL analysis
- 4.4. Market Entropy
- 4.5. Patent/Trademark Analysis
- 5. Global US Combined Heat and Power Industry Analysis, Insights and Forecast, 2019-2031
- 5.1. Market Analysis, Insights and Forecast - by Applicaton
- 5.1.1. Commercial
- 5.1.2. Industrial
- 5.2. Market Analysis, Insights and Forecast - by Fuel Type
- 5.2.1. Natural Gas
- 5.2.2. Renewable
- 5.2.3. Coal
- 5.2.4. Other Fuel Types
- 5.3. Market Analysis, Insights and Forecast - by Region
- 5.3.1. North America
- 5.3.2. South America
- 5.3.3. Europe
- 5.3.4. Middle East & Africa
- 5.3.5. Asia Pacific
- 5.1. Market Analysis, Insights and Forecast - by Applicaton
- 6. North America US Combined Heat and Power Industry Analysis, Insights and Forecast, 2019-2031
- 6.1. Market Analysis, Insights and Forecast - by Applicaton
- 6.1.1. Commercial
- 6.1.2. Industrial
- 6.2. Market Analysis, Insights and Forecast - by Fuel Type
- 6.2.1. Natural Gas
- 6.2.2. Renewable
- 6.2.3. Coal
- 6.2.4. Other Fuel Types
- 6.1. Market Analysis, Insights and Forecast - by Applicaton
- 7. South America US Combined Heat and Power Industry Analysis, Insights and Forecast, 2019-2031
- 7.1. Market Analysis, Insights and Forecast - by Applicaton
- 7.1.1. Commercial
- 7.1.2. Industrial
- 7.2. Market Analysis, Insights and Forecast - by Fuel Type
- 7.2.1. Natural Gas
- 7.2.2. Renewable
- 7.2.3. Coal
- 7.2.4. Other Fuel Types
- 7.1. Market Analysis, Insights and Forecast - by Applicaton
- 8. Europe US Combined Heat and Power Industry Analysis, Insights and Forecast, 2019-2031
- 8.1. Market Analysis, Insights and Forecast - by Applicaton
- 8.1.1. Commercial
- 8.1.2. Industrial
- 8.2. Market Analysis, Insights and Forecast - by Fuel Type
- 8.2.1. Natural Gas
- 8.2.2. Renewable
- 8.2.3. Coal
- 8.2.4. Other Fuel Types
- 8.1. Market Analysis, Insights and Forecast - by Applicaton
- 9. Middle East & Africa US Combined Heat and Power Industry Analysis, Insights and Forecast, 2019-2031
- 9.1. Market Analysis, Insights and Forecast - by Applicaton
- 9.1.1. Commercial
- 9.1.2. Industrial
- 9.2. Market Analysis, Insights and Forecast - by Fuel Type
- 9.2.1. Natural Gas
- 9.2.2. Renewable
- 9.2.3. Coal
- 9.2.4. Other Fuel Types
- 9.1. Market Analysis, Insights and Forecast - by Applicaton
- 10. Asia Pacific US Combined Heat and Power Industry Analysis, Insights and Forecast, 2019-2031
- 10.1. Market Analysis, Insights and Forecast - by Applicaton
- 10.1.1. Commercial
- 10.1.2. Industrial
- 10.2. Market Analysis, Insights and Forecast - by Fuel Type
- 10.2.1. Natural Gas
- 10.2.2. Renewable
- 10.2.3. Coal
- 10.2.4. Other Fuel Types
- 10.1. Market Analysis, Insights and Forecast - by Applicaton
- 11. Competitive Analysis
- 11.1. Global Market Share Analysis 2024
- 11.2. Company Profiles
- 11.2.1 2G Energy Inc
- 11.2.1.1. Overview
- 11.2.1.2. Products
- 11.2.1.3. SWOT Analysis
- 11.2.1.4. Recent Developments
- 11.2.1.5. Financials (Based on Availability)
- 11.2.2 General Electric Company
- 11.2.2.1. Overview
- 11.2.2.2. Products
- 11.2.2.3. SWOT Analysis
- 11.2.2.4. Recent Developments
- 11.2.2.5. Financials (Based on Availability)
- 11.2.3 Aegis Energy Services Inc
- 11.2.3.1. Overview
- 11.2.3.2. Products
- 11.2.3.3. SWOT Analysis
- 11.2.3.4. Recent Developments
- 11.2.3.5. Financials (Based on Availability)
- 11.2.4 Caterpillar Inc
- 11.2.4.1. Overview
- 11.2.4.2. Products
- 11.2.4.3. SWOT Analysis
- 11.2.4.4. Recent Developments
- 11.2.4.5. Financials (Based on Availability)
- 11.2.5 Curtis Engine & Equipment Co Inc
- 11.2.5.1. Overview
- 11.2.5.2. Products
- 11.2.5.3. SWOT Analysis
- 11.2.5.4. Recent Developments
- 11.2.5.5. Financials (Based on Availability)
- 11.2.6 Yanmar America Corp
- 11.2.6.1. Overview
- 11.2.6.2. Products
- 11.2.6.3. SWOT Analysis
- 11.2.6.4. Recent Developments
- 11.2.6.5. Financials (Based on Availability)
- 11.2.1 2G Energy Inc
List of Figures
- Figure 1: Global US Combined Heat and Power Industry Revenue Breakdown (Million, %) by Region 2024 & 2032
- Figure 2: North America US Combined Heat and Power Industry Revenue (Million), by Applicaton 2024 & 2032
- Figure 3: North America US Combined Heat and Power Industry Revenue Share (%), by Applicaton 2024 & 2032
- Figure 4: North America US Combined Heat and Power Industry Revenue (Million), by Fuel Type 2024 & 2032
- Figure 5: North America US Combined Heat and Power Industry Revenue Share (%), by Fuel Type 2024 & 2032
- Figure 6: North America US Combined Heat and Power Industry Revenue (Million), by Country 2024 & 2032
- Figure 7: North America US Combined Heat and Power Industry Revenue Share (%), by Country 2024 & 2032
- Figure 8: South America US Combined Heat and Power Industry Revenue (Million), by Applicaton 2024 & 2032
- Figure 9: South America US Combined Heat and Power Industry Revenue Share (%), by Applicaton 2024 & 2032
- Figure 10: South America US Combined Heat and Power Industry Revenue (Million), by Fuel Type 2024 & 2032
- Figure 11: South America US Combined Heat and Power Industry Revenue Share (%), by Fuel Type 2024 & 2032
- Figure 12: South America US Combined Heat and Power Industry Revenue (Million), by Country 2024 & 2032
- Figure 13: South America US Combined Heat and Power Industry Revenue Share (%), by Country 2024 & 2032
- Figure 14: Europe US Combined Heat and Power Industry Revenue (Million), by Applicaton 2024 & 2032
- Figure 15: Europe US Combined Heat and Power Industry Revenue Share (%), by Applicaton 2024 & 2032
- Figure 16: Europe US Combined Heat and Power Industry Revenue (Million), by Fuel Type 2024 & 2032
- Figure 17: Europe US Combined Heat and Power Industry Revenue Share (%), by Fuel Type 2024 & 2032
- Figure 18: Europe US Combined Heat and Power Industry Revenue (Million), by Country 2024 & 2032
- Figure 19: Europe US Combined Heat and Power Industry Revenue Share (%), by Country 2024 & 2032
- Figure 20: Middle East & Africa US Combined Heat and Power Industry Revenue (Million), by Applicaton 2024 & 2032
- Figure 21: Middle East & Africa US Combined Heat and Power Industry Revenue Share (%), by Applicaton 2024 & 2032
- Figure 22: Middle East & Africa US Combined Heat and Power Industry Revenue (Million), by Fuel Type 2024 & 2032
- Figure 23: Middle East & Africa US Combined Heat and Power Industry Revenue Share (%), by Fuel Type 2024 & 2032
- Figure 24: Middle East & Africa US Combined Heat and Power Industry Revenue (Million), by Country 2024 & 2032
- Figure 25: Middle East & Africa US Combined Heat and Power Industry Revenue Share (%), by Country 2024 & 2032
- Figure 26: Asia Pacific US Combined Heat and Power Industry Revenue (Million), by Applicaton 2024 & 2032
- Figure 27: Asia Pacific US Combined Heat and Power Industry Revenue Share (%), by Applicaton 2024 & 2032
- Figure 28: Asia Pacific US Combined Heat and Power Industry Revenue (Million), by Fuel Type 2024 & 2032
- Figure 29: Asia Pacific US Combined Heat and Power Industry Revenue Share (%), by Fuel Type 2024 & 2032
- Figure 30: Asia Pacific US Combined Heat and Power Industry Revenue (Million), by Country 2024 & 2032
- Figure 31: Asia Pacific US Combined Heat and Power Industry Revenue Share (%), by Country 2024 & 2032
List of Tables
- Table 1: Global US Combined Heat and Power Industry Revenue Million Forecast, by Region 2019 & 2032
- Table 2: Global US Combined Heat and Power Industry Revenue Million Forecast, by Applicaton 2019 & 2032
- Table 3: Global US Combined Heat and Power Industry Revenue Million Forecast, by Fuel Type 2019 & 2032
- Table 4: Global US Combined Heat and Power Industry Revenue Million Forecast, by Region 2019 & 2032
- Table 5: Global US Combined Heat and Power Industry Revenue Million Forecast, by Applicaton 2019 & 2032
- Table 6: Global US Combined Heat and Power Industry Revenue Million Forecast, by Fuel Type 2019 & 2032
- Table 7: Global US Combined Heat and Power Industry Revenue Million Forecast, by Country 2019 & 2032
- Table 8: United States US Combined Heat and Power Industry Revenue (Million) Forecast, by Application 2019 & 2032
- Table 9: Canada US Combined Heat and Power Industry Revenue (Million) Forecast, by Application 2019 & 2032
- Table 10: Mexico US Combined Heat and Power Industry Revenue (Million) Forecast, by Application 2019 & 2032
- Table 11: Global US Combined Heat and Power Industry Revenue Million Forecast, by Applicaton 2019 & 2032
- Table 12: Global US Combined Heat and Power Industry Revenue Million Forecast, by Fuel Type 2019 & 2032
- Table 13: Global US Combined Heat and Power Industry Revenue Million Forecast, by Country 2019 & 2032
- Table 14: Brazil US Combined Heat and Power Industry Revenue (Million) Forecast, by Application 2019 & 2032
- Table 15: Argentina US Combined Heat and Power Industry Revenue (Million) Forecast, by Application 2019 & 2032
- Table 16: Rest of South America US Combined Heat and Power Industry Revenue (Million) Forecast, by Application 2019 & 2032
- Table 17: Global US Combined Heat and Power Industry Revenue Million Forecast, by Applicaton 2019 & 2032
- Table 18: Global US Combined Heat and Power Industry Revenue Million Forecast, by Fuel Type 2019 & 2032
- Table 19: Global US Combined Heat and Power Industry Revenue Million Forecast, by Country 2019 & 2032
- Table 20: United Kingdom US Combined Heat and Power Industry Revenue (Million) Forecast, by Application 2019 & 2032
- Table 21: Germany US Combined Heat and Power Industry Revenue (Million) Forecast, by Application 2019 & 2032
- Table 22: France US Combined Heat and Power Industry Revenue (Million) Forecast, by Application 2019 & 2032
- Table 23: Italy US Combined Heat and Power Industry Revenue (Million) Forecast, by Application 2019 & 2032
- Table 24: Spain US Combined Heat and Power Industry Revenue (Million) Forecast, by Application 2019 & 2032
- Table 25: Russia US Combined Heat and Power Industry Revenue (Million) Forecast, by Application 2019 & 2032
- Table 26: Benelux US Combined Heat and Power Industry Revenue (Million) Forecast, by Application 2019 & 2032
- Table 27: Nordics US Combined Heat and Power Industry Revenue (Million) Forecast, by Application 2019 & 2032
- Table 28: Rest of Europe US Combined Heat and Power Industry Revenue (Million) Forecast, by Application 2019 & 2032
- Table 29: Global US Combined Heat and Power Industry Revenue Million Forecast, by Applicaton 2019 & 2032
- Table 30: Global US Combined Heat and Power Industry Revenue Million Forecast, by Fuel Type 2019 & 2032
- Table 31: Global US Combined Heat and Power Industry Revenue Million Forecast, by Country 2019 & 2032
- Table 32: Turkey US Combined Heat and Power Industry Revenue (Million) Forecast, by Application 2019 & 2032
- Table 33: Israel US Combined Heat and Power Industry Revenue (Million) Forecast, by Application 2019 & 2032
- Table 34: GCC US Combined Heat and Power Industry Revenue (Million) Forecast, by Application 2019 & 2032
- Table 35: North Africa US Combined Heat and Power Industry Revenue (Million) Forecast, by Application 2019 & 2032
- Table 36: South Africa US Combined Heat and Power Industry Revenue (Million) Forecast, by Application 2019 & 2032
- Table 37: Rest of Middle East & Africa US Combined Heat and Power Industry Revenue (Million) Forecast, by Application 2019 & 2032
- Table 38: Global US Combined Heat and Power Industry Revenue Million Forecast, by Applicaton 2019 & 2032
- Table 39: Global US Combined Heat and Power Industry Revenue Million Forecast, by Fuel Type 2019 & 2032
- Table 40: Global US Combined Heat and Power Industry Revenue Million Forecast, by Country 2019 & 2032
- Table 41: China US Combined Heat and Power Industry Revenue (Million) Forecast, by Application 2019 & 2032
- Table 42: India US Combined Heat and Power Industry Revenue (Million) Forecast, by Application 2019 & 2032
- Table 43: Japan US Combined Heat and Power Industry Revenue (Million) Forecast, by Application 2019 & 2032
- Table 44: South Korea US Combined Heat and Power Industry Revenue (Million) Forecast, by Application 2019 & 2032
- Table 45: ASEAN US Combined Heat and Power Industry Revenue (Million) Forecast, by Application 2019 & 2032
- Table 46: Oceania US Combined Heat and Power Industry Revenue (Million) Forecast, by Application 2019 & 2032
- Table 47: Rest of Asia Pacific US Combined Heat and Power Industry Revenue (Million) Forecast, by Application 2019 & 2032
Frequently Asked Questions
1. What is the projected Compound Annual Growth Rate (CAGR) of the US Combined Heat and Power Industry?
The projected CAGR is approximately > 7.00%.
2. Which companies are prominent players in the US Combined Heat and Power Industry?
Key companies in the market include 2G Energy Inc, General Electric Company, Aegis Energy Services Inc, Caterpillar Inc, Curtis Engine & Equipment Co Inc, Yanmar America Corp.
3. What are the main segments of the US Combined Heat and Power Industry?
The market segments include Applicaton, Fuel Type.
4. Can you provide details about the market size?
The market size is estimated to be USD XX Million as of 2022.
5. What are some drivers contributing to market growth?
N/A
6. What are the notable trends driving market growth?
Natural Gas-based CHP is Expected to Dominate the Market.
7. Are there any restraints impacting market growth?
N/A
8. Can you provide examples of recent developments in the market?
N/A
9. What pricing options are available for accessing the report?
Pricing options include single-user, multi-user, and enterprise licenses priced at USD 3800, USD 4500, and USD 5800 respectively.
10. Is the market size provided in terms of value or volume?
The market size is provided in terms of value, measured in Million.
11. Are there any specific market keywords associated with the report?
Yes, the market keyword associated with the report is "US Combined Heat and Power Industry," which aids in identifying and referencing the specific market segment covered.
12. How do I determine which pricing option suits my needs best?
The pricing options vary based on user requirements and access needs. Individual users may opt for single-user licenses, while businesses requiring broader access may choose multi-user or enterprise licenses for cost-effective access to the report.
13. Are there any additional resources or data provided in the US Combined Heat and Power Industry report?
While the report offers comprehensive insights, it's advisable to review the specific contents or supplementary materials provided to ascertain if additional resources or data are available.
14. How can I stay updated on further developments or reports in the US Combined Heat and Power Industry?
To stay informed about further developments, trends, and reports in the US Combined Heat and Power Industry, consider subscribing to industry newsletters, following relevant companies and organizations, or regularly checking reputable industry news sources and publications.
Methodology
Step 1 - Identification of Relevant Samples Size from Population Database


Step 2 - Approaches for Defining Global Market Size (Value, Volume* & Price*)

Note*: In applicable scenarios
Step 3 - Data Sources
Primary Research
- Web Analytics
- Survey Reports
- Research Institute
- Latest Research Reports
- Opinion Leaders
Secondary Research
- Annual Reports
- White Paper
- Latest Press Release
- Industry Association
- Paid Database
- Investor Presentations

Step 4 - Data Triangulation
Involves using different sources of information in order to increase the validity of a study
These sources are likely to be stakeholders in a program - participants, other researchers, program staff, other community members, and so on.
Then we put all data in single framework & apply various statistical tools to find out the dynamic on the market.
During the analysis stage, feedback from the stakeholder groups would be compared to determine areas of agreement as well as areas of divergence
