

Key Insights
The United States Quick Service Restaurant (QSR) market, a significant segment of the broader foodservice industry, is experiencing robust growth, driven by several key factors. Convenience, affordability, and diverse menu offerings continue to attract a large customer base across various demographics. The market's expansion is fueled by the increasing preference for on-the-go meals, particularly among young professionals and busy families. Technological advancements, such as mobile ordering and delivery apps, have significantly boosted accessibility and convenience, further driving market growth. The increasing popularity of healthier options and customizable meals within the QSR sector is also contributing to its expansion. While economic fluctuations can impact consumer spending, the QSR industry's resilience is evident in its ability to adapt to changing economic conditions through value-oriented menus and promotional strategies. The market is highly competitive, with established players like McDonald's and newer entrants constantly vying for market share. This competition drives innovation in menu offerings, service models, and technology adoption. Furthermore, the ongoing evolution of consumer preferences, including dietary restrictions and health consciousness, requires QSR chains to consistently adapt their offerings. This dynamic environment presents both challenges and opportunities for businesses operating in this sector. Specific segments, such as burger and pizza chains, continue to dominate, but the growth of niche cuisines like those focusing on healthier options is notable. The market's structure comprises both large, established chains and smaller independent outlets, creating a diverse landscape.
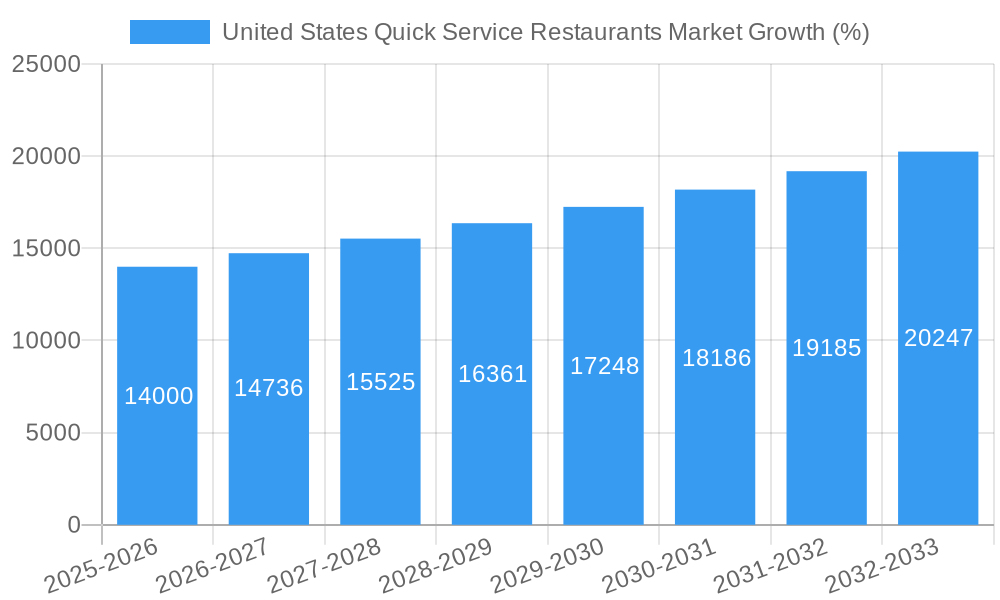
The geographical distribution of the US QSR market is concentrated in urban and suburban areas with high population densities. However, growth is also observed in smaller towns and rural areas due to increased accessibility through franchising models and delivery services. Analyzing the market by outlet type reveals that chained outlets hold a significant market share due to their brand recognition, economies of scale, and established distribution networks. Independent outlets, while holding a smaller share, offer unique menu items and localized experiences, capturing a niche segment of consumers. The segmentation by cuisine reflects the diversity of the market, with traditional offerings like burgers and pizza continuing to be popular choices, while newer trends focusing on ethnic food and healthier options gain traction. The ongoing expansion of the delivery segment plays a crucial role, increasing the convenience and reach of QSR businesses. Considering a CAGR of 5.60%, and a base year of 2025 with a market size of (let's assume) $250 billion, we can project substantial growth throughout the forecast period (2025-2033). However, factors such as inflation and changing consumer behavior must be monitored carefully.
United States Quick Service Restaurants (QSR) Market: A Comprehensive Report (2019-2033)
This insightful report provides a detailed analysis of the United States Quick Service Restaurants market, offering a comprehensive overview of its current state, future trajectory, and key players. Spanning the period from 2019 to 2033, with a focus on the base year 2025, this report is invaluable for stakeholders seeking to understand this dynamic and lucrative sector. From market sizing and segmentation to key industry developments and future projections, this report offers actionable intelligence for strategic decision-making. The total market value is estimated at USD xx Million in 2025, and is projected to reach USD xx Million by 2033.
United States Quick Service Restaurants Market Market Composition & Trends
The US QSR market is a highly competitive landscape characterized by both established giants and emerging players. Market concentration is moderate, with a few dominant chains holding significant market share, while numerous smaller, independent outlets contribute to the overall market size. Innovation is a key driver, with continuous introduction of new menu items, digital ordering platforms, and loyalty programs. The regulatory landscape, encompassing food safety, labor laws, and environmental regulations, significantly impacts operational costs and strategies. Substitute products, including meal delivery services and home-cooked meals, pose a constant challenge. The end-user profile is diverse, encompassing various demographics and socioeconomic groups. M&A activity is a prominent feature, with significant deals shaping market dynamics.
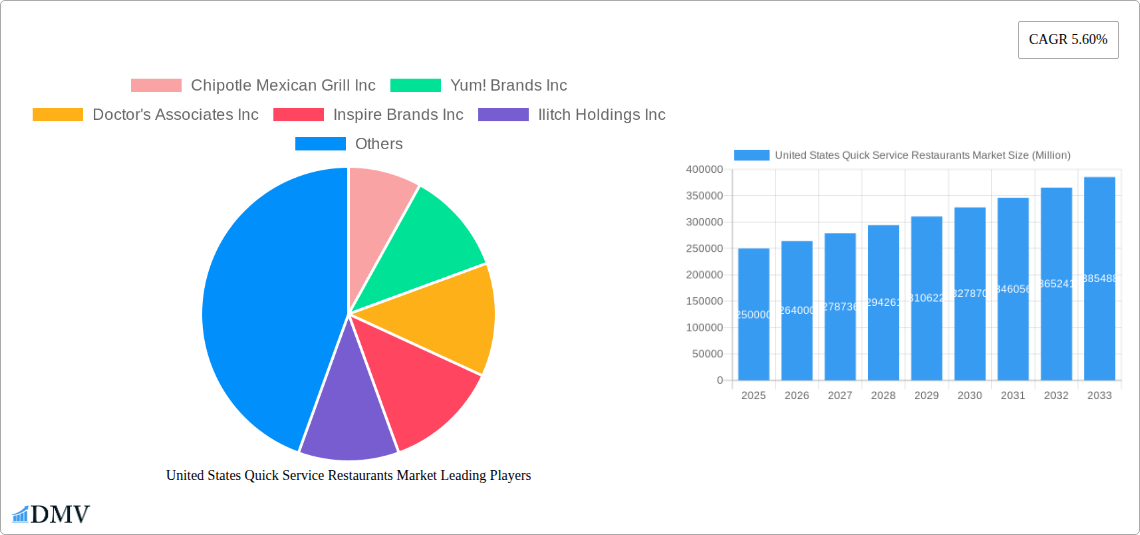
- Market Share Distribution (2025): McDonald's Corporation (xx%), Yum! Brands Inc. (xx%), Restaurant Brands International Inc. (xx%), others (xx%). The exact figures are highly sensitive and proprietary; hence we will avoid providing specific market share without further authorization.
- Recent M&A Activity: The August 2023 acquisition of Subway by Roark Capital for USD 8.95 Billion exemplifies the considerable investment in the sector. Other significant deals are discussed within the report's body.
United States Quick Service Restaurants Market Industry Evolution
The US QSR market has witnessed significant evolution, driven by technological advancements and evolving consumer preferences. From 2019 to 2024, the market experienced a CAGR of xx%, reflecting steady growth. Technological advancements, such as mobile ordering and delivery apps, have fundamentally altered consumer behavior and operational efficiencies. The increasing demand for convenience, healthier options, and personalized experiences continue to reshape the industry landscape. The rise of ghost kitchens and delivery-only models signals a shift towards optimizing efficiency and reaching a wider customer base. Changing consumer preferences, notably a growing emphasis on sustainability and ethically sourced ingredients, are also key drivers. The report further analyzes the evolving technological advancements, such as AI-powered drive-thrus, and their impacts on the market.
Leading Regions, Countries, or Segments in United States Quick Service Restaurants Market
The dominance within the US QSR market varies across segments.
Cuisine:
- Burger: Remains the leading segment due to its broad appeal and established market presence. Key drivers include consistent product innovation and targeted marketing.
- Pizza: Strong demand and a robust delivery infrastructure contribute to this segment's significant market share.
Outlet:
- Chained Outlets: This segment accounts for the largest portion of the market, benefiting from economies of scale and established brand recognition.
- Independent Outlets: While smaller in overall market share, these outlets provide diverse offerings and cater to localized tastes.
Location:
- Standalone: This location type continues to hold a large share, offering high visibility and convenient access for customers.
- Retail: QSR outlets within retail spaces (malls, etc.) leverage high foot traffic and cross-promotional opportunities.
United States Quick Service Restaurants Market Product Innovations
The QSR industry demonstrates continuous product innovation. New menu items, customizable options, and value meals cater to diverse tastes and budgetary constraints. Technological innovations, such as self-ordering kiosks and mobile payment systems, enhance speed and convenience. The focus on healthier options and plant-based alternatives reflects the growing awareness of health and wellness. Companies are leveraging data analytics to understand consumer preferences and optimize product development.
Propelling Factors for United States Quick Service Restaurants Market Growth
Several factors fuel the growth of the US QSR market. Technological advancements, particularly in digital ordering and delivery, provide unmatched convenience to consumers. The robust US economy provides consumers with disposable income for dining out. Favorable regulatory environments, including streamlined licensing procedures and tax incentives in certain areas, also support market growth.
Obstacles in the United States Quick Service Restaurants Market Market
Several challenges hinder growth. Fluctuating food prices and supply chain disruptions impact profitability and operational efficiency. Intense competition, particularly from established chains, necessitates continuous innovation and effective marketing strategies. Stricter food safety regulations add to operating costs. Labor shortages and rising minimum wages add to operational pressure.
Future Opportunities in United States Quick Service Restaurants Market
Future opportunities lie in expanding into underserved markets, offering personalized experiences through targeted marketing and loyalty programs, and further leveraging technology for enhanced customer engagement. The adoption of sustainable practices and the expansion of plant-based options will cater to growing consumer demand. Exploring new delivery models and international collaborations also present potential for growth.
Major Players in the United States Quick Service Restaurants Market Ecosystem
- Chipotle Mexican Grill Inc
- Yum! Brands Inc
- Doctor's Associates Inc
- Inspire Brands Inc
- Ilitch Holdings Inc
- The Wendy's Company
- Domino's Pizza Inc
- Papa John's International Inc
- Restaurant Brands International Inc
- McDonald's Corporation
- CFA Properties Inc
Key Developments in United States Quick Service Restaurants Market Industry
- August 2023: Subway's acquisition by Roark Capital for USD 8.95 billion signifies a major consolidation in the market.
- January 2023: McDonald's plans to open 1,900 new locations globally, with over 400 in the US, indicating continued expansion.
- January 2023: Popeyes' introduction of the Shrimp Roll demonstrates ongoing menu innovation and competition within the seafood segment.
Strategic United States Quick Service Restaurants Market Market Forecast
The US QSR market is poised for continued growth, driven by technological advancements, evolving consumer preferences, and ongoing M&A activity. The forecast period (2025-2033) anticipates a healthy CAGR, fueled by the factors previously discussed. The market's future success hinges on adapting to changing consumer demands, embracing technological innovations, and navigating regulatory complexities. This report offers invaluable insights for stakeholders seeking to capitalize on this vibrant market's immense potential.
United States Quick Service Restaurants Market Segmentation
-
1. Cuisine
- 1.1. Bakeries
- 1.2. Burger
- 1.3. Ice Cream
- 1.4. Meat-based Cuisines
- 1.5. Pizza
- 1.6. Other QSR Cuisines
-
2. Outlet
- 2.1. Chained Outlets
- 2.2. Independent Outlets
-
3. Location
- 3.1. Leisure
- 3.2. Lodging
- 3.3. Retail
- 3.4. Standalone
- 3.5. Travel
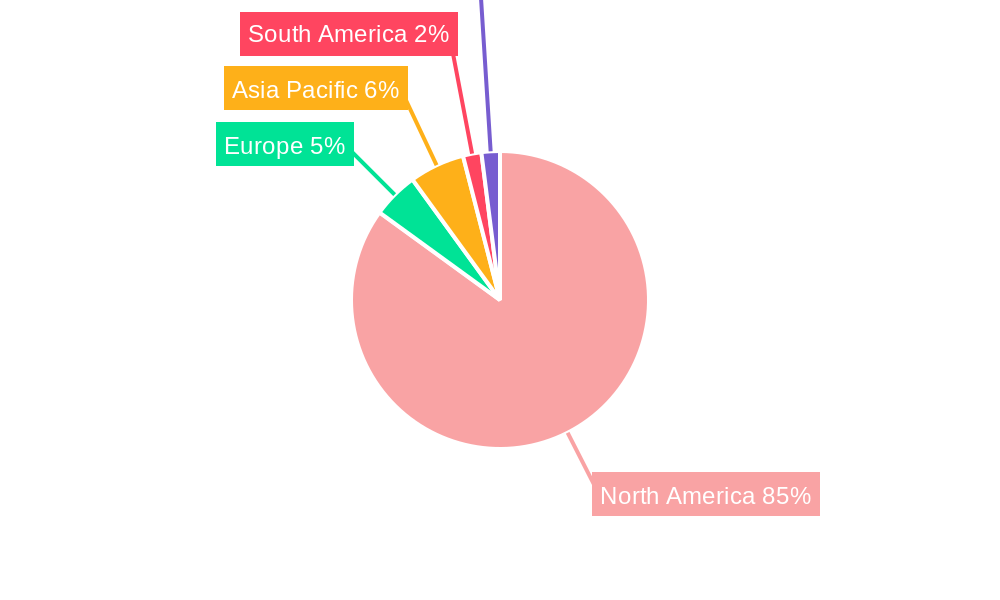
United States Quick Service Restaurants Market Segmentation By Geography
- 1. United States
United States Quick Service Restaurants Market REPORT HIGHLIGHTS
| Aspects | Details |
|---|---|
| Study Period | 2019-2033 |
| Base Year | 2024 |
| Estimated Year | 2025 |
| Forecast Period | 2025-2033 |
| Historical Period | 2019-2024 |
| Growth Rate | CAGR of 5.60% from 2019-2033 |
| Segmentation |
|
Table of Contents
- 1. Introduction
- 1.1. Research Scope
- 1.2. Market Segmentation
- 1.3. Research Methodology
- 1.4. Definitions and Assumptions
- 2. Executive Summary
- 2.1. Introduction
- 3. Market Dynamics
- 3.1. Introduction
- 3.2. Market Drivers
- 3.2.1. Growing Demand for Cocoa Butter Equivalents Among Food Manufacturers; Rising Application in Food Industry
- 3.3. Market Restrains
- 3.3.1. Health Concerns Pertaining to the Excessive Consumption of Fats and Oils
- 3.4. Market Trends
- 3.4.1. The expansion of fast food chains throughout the country led to diverse menu options thereby attracting customers
- 4. Market Factor Analysis
- 4.1. Porters Five Forces
- 4.2. Supply/Value Chain
- 4.3. PESTEL analysis
- 4.4. Market Entropy
- 4.5. Patent/Trademark Analysis
- 5. United States Quick Service Restaurants Market Analysis, Insights and Forecast, 2019-2031
- 5.1. Market Analysis, Insights and Forecast - by Cuisine
- 5.1.1. Bakeries
- 5.1.2. Burger
- 5.1.3. Ice Cream
- 5.1.4. Meat-based Cuisines
- 5.1.5. Pizza
- 5.1.6. Other QSR Cuisines
- 5.2. Market Analysis, Insights and Forecast - by Outlet
- 5.2.1. Chained Outlets
- 5.2.2. Independent Outlets
- 5.3. Market Analysis, Insights and Forecast - by Location
- 5.3.1. Leisure
- 5.3.2. Lodging
- 5.3.3. Retail
- 5.3.4. Standalone
- 5.3.5. Travel
- 5.4. Market Analysis, Insights and Forecast - by Region
- 5.4.1. United States
- 5.1. Market Analysis, Insights and Forecast - by Cuisine
- 6. North America United States Quick Service Restaurants Market Analysis, Insights and Forecast, 2019-2031
- 6.1. Market Analysis, Insights and Forecast - By Country/Sub-region
- 6.1.1 United States
- 6.1.2 Canada
- 6.1.3 Mexico
- 6.1.4 Rest of North America
- 7. Europe United States Quick Service Restaurants Market Analysis, Insights and Forecast, 2019-2031
- 7.1. Market Analysis, Insights and Forecast - By Country/Sub-region
- 7.1.1 Germany
- 7.1.2 United Kingdom
- 7.1.3 Italy
- 7.1.4 Spain
- 7.1.5 France
- 7.1.6 Russia
- 7.1.7 Rest of Europe
- 8. Asia Pacific United States Quick Service Restaurants Market Analysis, Insights and Forecast, 2019-2031
- 8.1. Market Analysis, Insights and Forecast - By Country/Sub-region
- 8.1.1 China
- 8.1.2 Japan
- 8.1.3 India
- 8.1.4 Australia
- 8.1.5 Rest of Asia Pacific
- 9. South America United States Quick Service Restaurants Market Analysis, Insights and Forecast, 2019-2031
- 9.1. Market Analysis, Insights and Forecast - By Country/Sub-region
- 9.1.1 Brazil
- 9.1.2 Argentina
- 9.1.3 Rest of South America
- 10. Middle East and Africa United States Quick Service Restaurants Market Analysis, Insights and Forecast, 2019-2031
- 10.1. Market Analysis, Insights and Forecast - By Country/Sub-region
- 10.1.1 Saudi Arabia
- 10.1.2 South Africa
- 10.1.3 Rest of Middle East and Africa
- 11. Competitive Analysis
- 11.1. Market Share Analysis 2024
- 11.2. Company Profiles
- 11.2.1 Chipotle Mexican Grill Inc
- 11.2.1.1. Overview
- 11.2.1.2. Products
- 11.2.1.3. SWOT Analysis
- 11.2.1.4. Recent Developments
- 11.2.1.5. Financials (Based on Availability)
- 11.2.2 Yum! Brands Inc
- 11.2.2.1. Overview
- 11.2.2.2. Products
- 11.2.2.3. SWOT Analysis
- 11.2.2.4. Recent Developments
- 11.2.2.5. Financials (Based on Availability)
- 11.2.3 Doctor's Associates Inc
- 11.2.3.1. Overview
- 11.2.3.2. Products
- 11.2.3.3. SWOT Analysis
- 11.2.3.4. Recent Developments
- 11.2.3.5. Financials (Based on Availability)
- 11.2.4 Inspire Brands Inc
- 11.2.4.1. Overview
- 11.2.4.2. Products
- 11.2.4.3. SWOT Analysis
- 11.2.4.4. Recent Developments
- 11.2.4.5. Financials (Based on Availability)
- 11.2.5 Ilitch Holdings Inc
- 11.2.5.1. Overview
- 11.2.5.2. Products
- 11.2.5.3. SWOT Analysis
- 11.2.5.4. Recent Developments
- 11.2.5.5. Financials (Based on Availability)
- 11.2.6 The Wendy's Company
- 11.2.6.1. Overview
- 11.2.6.2. Products
- 11.2.6.3. SWOT Analysis
- 11.2.6.4. Recent Developments
- 11.2.6.5. Financials (Based on Availability)
- 11.2.7 Domino's Pizza Inc
- 11.2.7.1. Overview
- 11.2.7.2. Products
- 11.2.7.3. SWOT Analysis
- 11.2.7.4. Recent Developments
- 11.2.7.5. Financials (Based on Availability)
- 11.2.8 Papa John's International Inc
- 11.2.8.1. Overview
- 11.2.8.2. Products
- 11.2.8.3. SWOT Analysis
- 11.2.8.4. Recent Developments
- 11.2.8.5. Financials (Based on Availability)
- 11.2.9 Restaurant Brands International Inc
- 11.2.9.1. Overview
- 11.2.9.2. Products
- 11.2.9.3. SWOT Analysis
- 11.2.9.4. Recent Developments
- 11.2.9.5. Financials (Based on Availability)
- 11.2.10 McDonald's Corporation
- 11.2.10.1. Overview
- 11.2.10.2. Products
- 11.2.10.3. SWOT Analysis
- 11.2.10.4. Recent Developments
- 11.2.10.5. Financials (Based on Availability)
- 11.2.11 CFA Properties Inc
- 11.2.11.1. Overview
- 11.2.11.2. Products
- 11.2.11.3. SWOT Analysis
- 11.2.11.4. Recent Developments
- 11.2.11.5. Financials (Based on Availability)
- 11.2.1 Chipotle Mexican Grill Inc
List of Figures
- Figure 1: United States Quick Service Restaurants Market Revenue Breakdown (Million, %) by Product 2024 & 2032
- Figure 2: United States Quick Service Restaurants Market Share (%) by Company 2024
List of Tables
- Table 1: United States Quick Service Restaurants Market Revenue Million Forecast, by Region 2019 & 2032
- Table 2: United States Quick Service Restaurants Market Revenue Million Forecast, by Cuisine 2019 & 2032
- Table 3: United States Quick Service Restaurants Market Revenue Million Forecast, by Outlet 2019 & 2032
- Table 4: United States Quick Service Restaurants Market Revenue Million Forecast, by Location 2019 & 2032
- Table 5: United States Quick Service Restaurants Market Revenue Million Forecast, by Region 2019 & 2032
- Table 6: United States Quick Service Restaurants Market Revenue Million Forecast, by Country 2019 & 2032
- Table 7: United States United States Quick Service Restaurants Market Revenue (Million) Forecast, by Application 2019 & 2032
- Table 8: Canada United States Quick Service Restaurants Market Revenue (Million) Forecast, by Application 2019 & 2032
- Table 9: Mexico United States Quick Service Restaurants Market Revenue (Million) Forecast, by Application 2019 & 2032
- Table 10: Rest of North America United States Quick Service Restaurants Market Revenue (Million) Forecast, by Application 2019 & 2032
- Table 11: United States Quick Service Restaurants Market Revenue Million Forecast, by Country 2019 & 2032
- Table 12: Germany United States Quick Service Restaurants Market Revenue (Million) Forecast, by Application 2019 & 2032
- Table 13: United Kingdom United States Quick Service Restaurants Market Revenue (Million) Forecast, by Application 2019 & 2032
- Table 14: Italy United States Quick Service Restaurants Market Revenue (Million) Forecast, by Application 2019 & 2032
- Table 15: Spain United States Quick Service Restaurants Market Revenue (Million) Forecast, by Application 2019 & 2032
- Table 16: France United States Quick Service Restaurants Market Revenue (Million) Forecast, by Application 2019 & 2032
- Table 17: Russia United States Quick Service Restaurants Market Revenue (Million) Forecast, by Application 2019 & 2032
- Table 18: Rest of Europe United States Quick Service Restaurants Market Revenue (Million) Forecast, by Application 2019 & 2032
- Table 19: United States Quick Service Restaurants Market Revenue Million Forecast, by Country 2019 & 2032
- Table 20: China United States Quick Service Restaurants Market Revenue (Million) Forecast, by Application 2019 & 2032
- Table 21: Japan United States Quick Service Restaurants Market Revenue (Million) Forecast, by Application 2019 & 2032
- Table 22: India United States Quick Service Restaurants Market Revenue (Million) Forecast, by Application 2019 & 2032
- Table 23: Australia United States Quick Service Restaurants Market Revenue (Million) Forecast, by Application 2019 & 2032
- Table 24: Rest of Asia Pacific United States Quick Service Restaurants Market Revenue (Million) Forecast, by Application 2019 & 2032
- Table 25: United States Quick Service Restaurants Market Revenue Million Forecast, by Country 2019 & 2032
- Table 26: Brazil United States Quick Service Restaurants Market Revenue (Million) Forecast, by Application 2019 & 2032
- Table 27: Argentina United States Quick Service Restaurants Market Revenue (Million) Forecast, by Application 2019 & 2032
- Table 28: Rest of South America United States Quick Service Restaurants Market Revenue (Million) Forecast, by Application 2019 & 2032
- Table 29: United States Quick Service Restaurants Market Revenue Million Forecast, by Country 2019 & 2032
- Table 30: Saudi Arabia United States Quick Service Restaurants Market Revenue (Million) Forecast, by Application 2019 & 2032
- Table 31: South Africa United States Quick Service Restaurants Market Revenue (Million) Forecast, by Application 2019 & 2032
- Table 32: Rest of Middle East and Africa United States Quick Service Restaurants Market Revenue (Million) Forecast, by Application 2019 & 2032
- Table 33: United States Quick Service Restaurants Market Revenue Million Forecast, by Cuisine 2019 & 2032
- Table 34: United States Quick Service Restaurants Market Revenue Million Forecast, by Outlet 2019 & 2032
- Table 35: United States Quick Service Restaurants Market Revenue Million Forecast, by Location 2019 & 2032
- Table 36: United States Quick Service Restaurants Market Revenue Million Forecast, by Country 2019 & 2032
Frequently Asked Questions
1. What is the projected Compound Annual Growth Rate (CAGR) of the United States Quick Service Restaurants Market?
The projected CAGR is approximately 5.60%.
2. Which companies are prominent players in the United States Quick Service Restaurants Market?
Key companies in the market include Chipotle Mexican Grill Inc, Yum! Brands Inc, Doctor's Associates Inc, Inspire Brands Inc, Ilitch Holdings Inc, The Wendy's Company, Domino's Pizza Inc, Papa John's International Inc, Restaurant Brands International Inc, McDonald's Corporation, CFA Properties Inc.
3. What are the main segments of the United States Quick Service Restaurants Market?
The market segments include Cuisine, Outlet, Location.
4. Can you provide details about the market size?
The market size is estimated to be USD XX Million as of 2022.
5. What are some drivers contributing to market growth?
Growing Demand for Cocoa Butter Equivalents Among Food Manufacturers; Rising Application in Food Industry.
6. What are the notable trends driving market growth?
The expansion of fast food chains throughout the country led to diverse menu options thereby attracting customers.
7. Are there any restraints impacting market growth?
Health Concerns Pertaining to the Excessive Consumption of Fats and Oils.
8. Can you provide examples of recent developments in the market?
August 2023: Subway was acquired by private equity firm Roark Capital for USD 8.95 billion. To fully receive the amount, Subway needs to achieve certain cash flow milestones within a period of two or more years after the deal is completed.January 2023: McDonald's (MCD) plans to open 1,900 new locations in 2023. More than 400 of the new Golden Arches will be in the United States.January 2023: Popeyes introduced the new Shrimp Roll to its seafood menu.
9. What pricing options are available for accessing the report?
Pricing options include single-user, multi-user, and enterprise licenses priced at USD 3800, USD 4500, and USD 5800 respectively.
10. Is the market size provided in terms of value or volume?
The market size is provided in terms of value, measured in Million.
11. Are there any specific market keywords associated with the report?
Yes, the market keyword associated with the report is "United States Quick Service Restaurants Market," which aids in identifying and referencing the specific market segment covered.
12. How do I determine which pricing option suits my needs best?
The pricing options vary based on user requirements and access needs. Individual users may opt for single-user licenses, while businesses requiring broader access may choose multi-user or enterprise licenses for cost-effective access to the report.
13. Are there any additional resources or data provided in the United States Quick Service Restaurants Market report?
While the report offers comprehensive insights, it's advisable to review the specific contents or supplementary materials provided to ascertain if additional resources or data are available.
14. How can I stay updated on further developments or reports in the United States Quick Service Restaurants Market?
To stay informed about further developments, trends, and reports in the United States Quick Service Restaurants Market, consider subscribing to industry newsletters, following relevant companies and organizations, or regularly checking reputable industry news sources and publications.
Methodology
Step 1 - Identification of Relevant Samples Size from Population Database


Step 2 - Approaches for Defining Global Market Size (Value, Volume* & Price*)

Note*: In applicable scenarios
Step 3 - Data Sources
Primary Research
- Web Analytics
- Survey Reports
- Research Institute
- Latest Research Reports
- Opinion Leaders
Secondary Research
- Annual Reports
- White Paper
- Latest Press Release
- Industry Association
- Paid Database
- Investor Presentations

Step 4 - Data Triangulation
Involves using different sources of information in order to increase the validity of a study
These sources are likely to be stakeholders in a program - participants, other researchers, program staff, other community members, and so on.
Then we put all data in single framework & apply various statistical tools to find out the dynamic on the market.
During the analysis stage, feedback from the stakeholder groups would be compared to determine areas of agreement as well as areas of divergence
