

Key Insights
The subcloning technology market is experiencing robust growth, driven by the increasing demand for advanced research tools in biotechnology, pharmaceuticals, and academia. The market's expansion is fueled by several key factors, including the rising prevalence of genetic engineering applications, the growing need for personalized medicine, and advancements in gene editing technologies like CRISPR-Cas9. The rising adoption of high-throughput screening methods and the increasing investments in research and development activities further contribute to market growth. Over the forecast period (2025-2033), the market is projected to witness a considerable increase in its value, primarily due to the continuous innovation in subcloning techniques and the expansion of downstream applications across various research domains. This includes the development of more efficient and accurate subcloning methods, along with improved vector systems and supporting reagents. Companies like Promega, Thermo Fisher Scientific, and Genscript Biotech Corp are key players, continuously innovating and expanding their product portfolios to cater to the growing demand for efficient and reliable subcloning solutions. Competitive pressures and strategic collaborations are also shaping the market landscape, leading to improved product offerings and wider accessibility of subcloning technologies.
While the market shows significant promise, challenges remain. The high cost associated with advanced subcloning kits and reagents can limit accessibility, particularly for smaller research institutions and laboratories in developing countries. Furthermore, the complexity of certain subcloning techniques requires specialized expertise, which may pose a barrier to entry for some researchers. However, these challenges are being addressed through the development of more user-friendly kits and streamlined protocols, as well as educational initiatives aimed at improving the training and skill sets of researchers. The market is segmented by technology type, application, and end-user. The continued development and adoption of next-generation sequencing technologies and gene synthesis platforms are expected to further propel the market forward during the forecast period.
Subcloning Technology Market Report: 2019-2033 - A Comprehensive Analysis of a Multi-Million Dollar Industry
This comprehensive report provides a detailed analysis of the global subcloning technology market, projecting a market value exceeding $XX million by 2033. The study period covers 2019-2033, with 2025 serving as the base and estimated year. The forecast period spans 2025-2033, and the historical period encompasses 2019-2024. This report is invaluable for stakeholders seeking to understand market trends, competitive dynamics, and future opportunities within this rapidly evolving sector.
Subcloning Technology Market Composition & Trends
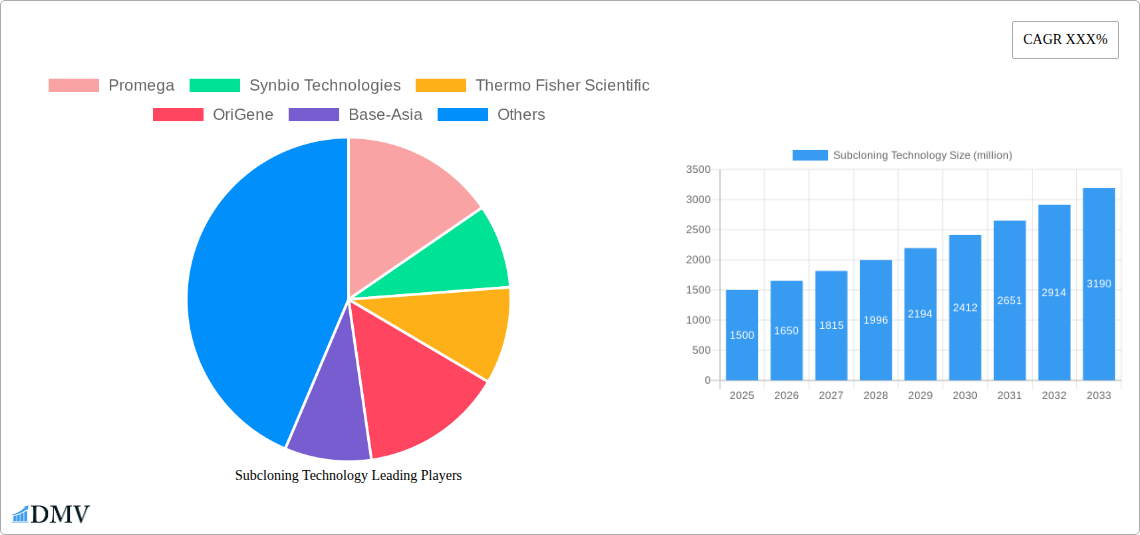
The global subcloning technology market exhibits a moderately concentrated landscape, with key players like Promega, Thermo Fisher Scientific, and Genscript Biotech Corp holding significant market share. However, the market is witnessing increasing participation from smaller, specialized companies, fostering innovation and competition. Market share distribution in 2025 is estimated as follows: Thermo Fisher Scientific (25%), Promega (18%), Genscript Biotech Corp (12%), and others (45%). Innovation is primarily driven by advancements in gene editing technologies like CRISPR-Cas9 and advancements in cloning techniques, leading to improved efficiency and accuracy. Regulatory landscapes vary across regions, impacting market access and product approval timelines. Substitute technologies, such as PCR-based cloning methods, exert some competitive pressure, but subcloning's precision and versatility maintain its dominance. End-users comprise academic research institutions, pharmaceutical companies, and biotechnology firms. Significant M&A activity, with a total deal value exceeding $XX million in the last five years, demonstrates ongoing industry consolidation and expansion. Examples include the acquisition of X company by Y company for $XX million in 2022.
- Market Concentration: Moderately concentrated, with several major players controlling a significant share.
- Innovation Catalysts: CRISPR-Cas9, improved cloning techniques, and automation.
- Regulatory Landscape: Varies regionally, influencing market access and approvals.
- Substitute Products: PCR-based cloning methods present some competition.
- End-User Profile: Primarily academic research, pharmaceuticals, and biotech companies.
- M&A Activity: Significant consolidation observed, with total deal values exceeding $XX million in the last five years.
Subcloning Technology Industry Evolution
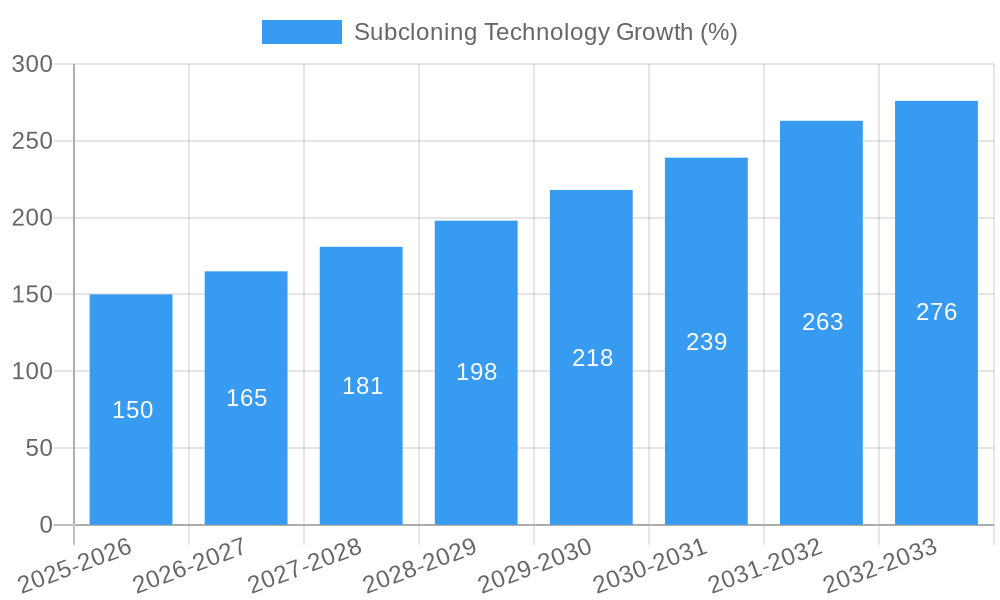
The subcloning technology market has experienced robust growth during the historical period (2019-2024), with a compound annual growth rate (CAGR) of XX%. This growth is attributed to increasing demand for targeted gene manipulation in diverse applications including drug discovery, gene therapy, and synthetic biology. Technological advancements, such as high-throughput screening and automation, have streamlined workflows and reduced costs, boosting market adoption. Consumer demand is shifting towards more efficient, accurate, and cost-effective subcloning solutions, driving innovation in reagents, kits, and instrumentation. We project a CAGR of XX% during the forecast period (2025-2033), driven by continued technological innovation and expanding application areas. Adoption rates are expected to increase significantly, particularly in emerging markets.
Leading Regions, Countries, or Segments in Subcloning Technology
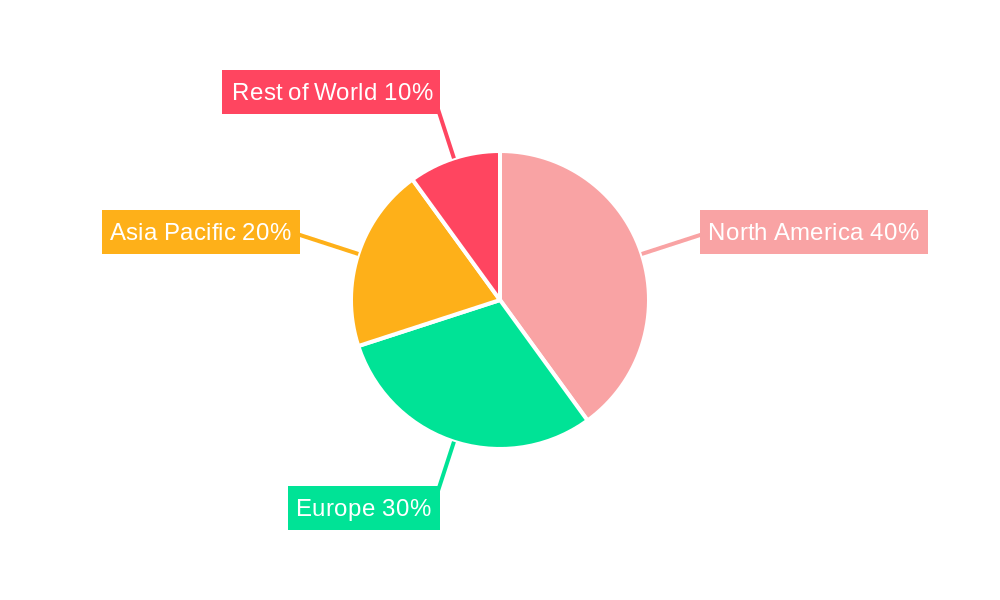
North America currently dominates the subcloning technology market, driven by robust R&D investments, a strong presence of major players, and supportive regulatory frameworks.
- Key Drivers for North American Dominance:
- High R&D spending in the biotechnology and pharmaceutical sectors.
- Presence of major subcloning technology companies (e.g., Promega, Thermo Fisher Scientific).
- Favorable regulatory environment supporting technological advancements.
- Strong academic research infrastructure.
The European market is also significant, showing strong growth due to increasing government funding for life science research and a growing biotechnology sector. The Asia-Pacific region is experiencing rapid expansion, primarily fueled by investments in biotechnology infrastructure and increasing pharmaceutical production. This growth, however, lags behind North America due to regulatory hurdles and limited access to advanced technologies in some regions.
Subcloning Technology Product Innovations
Recent innovations include the development of highly efficient cloning kits, automated subcloning platforms, and novel enzymes optimized for various applications. These innovations enhance the speed, accuracy, and scalability of subcloning procedures. Unique selling propositions focus on improved efficiency, reduced error rates, and simplified workflows. Advancements in next-generation sequencing technologies also enhance downstream applications by allowing for quicker and more accurate verification of clones.
Propelling Factors for Subcloning Technology Growth
Technological advancements, such as high-throughput screening and automation, are significantly driving market expansion. Increased funding for biomedical research, particularly in gene therapy and synthetic biology, fuels demand for subcloning technologies. Supportive regulatory frameworks, including streamlined approval processes for new technologies, further accelerate market growth.
Obstacles in the Subcloning Technology Market
High costs associated with advanced subcloning technologies, particularly automation and specialized reagents, can limit market accessibility, especially for smaller research groups. Supply chain disruptions can impact the availability of crucial reagents and equipment. Intense competition among established players and emerging companies can put pressure on pricing and margins. Regulatory hurdles in certain regions may also delay market entry for new products.
Future Opportunities in Subcloning Technology
Emerging markets, particularly in Asia-Pacific, present significant growth potential. The development of novel cloning strategies and gene editing tools creates opportunities for improved efficiency and cost reduction. Increased integration of subcloning technology with other genomic tools, such as next-generation sequencing, will expand applications and market reach.
Major Players in the Subcloning Technology Ecosystem
- Promega
- Synbio Technologies
- Thermo Fisher Scientific
- OriGene
- Base-Asia
- Kendall Scientific
- Eurofins Scientific
- Merck KGaA
- Genscript Biotech Corp
- Bioneer Corporation
- Bio Basic
Key Developments in Subcloning Technology Industry
- 2022 (Q4): Thermo Fisher Scientific launched a new automated subcloning platform.
- 2023 (Q1): Genscript Biotech Corp announced a strategic partnership for the development of novel subcloning enzymes.
- 2024 (Q2): Promega introduced a next-generation subcloning kit with improved efficiency. (Further developments can be added here as they occur)
Strategic Subcloning Technology Market Forecast
The subcloning technology market is poised for sustained growth driven by technological innovation, expanding applications, and increased investment in life sciences research. Future opportunities lie in developing cost-effective solutions, expanding into emerging markets, and integrating subcloning with other genomic technologies. The market's overall potential is substantial, with continued expansion across various sectors expected throughout the forecast period.
Subcloning Technology Segmentation
-
1. Application
- 1.1. Medical Industry
- 1.2. Biological Research
- 1.3. Others
-
2. Type
- 2.1. Cell Clone
- 2.2. Molecular Cloning
Subcloning Technology Segmentation By Geography
-
1. North America
- 1.1. United States
- 1.2. Canada
- 1.3. Mexico
-
2. South America
- 2.1. Brazil
- 2.2. Argentina
- 2.3. Rest of South America
-
3. Europe
- 3.1. United Kingdom
- 3.2. Germany
- 3.3. France
- 3.4. Italy
- 3.5. Spain
- 3.6. Russia
- 3.7. Benelux
- 3.8. Nordics
- 3.9. Rest of Europe
-
4. Middle East & Africa
- 4.1. Turkey
- 4.2. Israel
- 4.3. GCC
- 4.4. North Africa
- 4.5. South Africa
- 4.6. Rest of Middle East & Africa
-
5. Asia Pacific
- 5.1. China
- 5.2. India
- 5.3. Japan
- 5.4. South Korea
- 5.5. ASEAN
- 5.6. Oceania
- 5.7. Rest of Asia Pacific
Subcloning Technology REPORT HIGHLIGHTS
| Aspects | Details |
|---|---|
| Study Period | 2019-2033 |
| Base Year | 2024 |
| Estimated Year | 2025 |
| Forecast Period | 2025-2033 |
| Historical Period | 2019-2024 |
| Growth Rate | CAGR of XXX% from 2019-2033 |
| Segmentation |
|
Table of Contents
- 1. Introduction
- 1.1. Research Scope
- 1.2. Market Segmentation
- 1.3. Research Methodology
- 1.4. Definitions and Assumptions
- 2. Executive Summary
- 2.1. Introduction
- 3. Market Dynamics
- 3.1. Introduction
- 3.2. Market Drivers
- 3.3. Market Restrains
- 3.4. Market Trends
- 4. Market Factor Analysis
- 4.1. Porters Five Forces
- 4.2. Supply/Value Chain
- 4.3. PESTEL analysis
- 4.4. Market Entropy
- 4.5. Patent/Trademark Analysis
- 5. Global Subcloning Technology Analysis, Insights and Forecast, 2019-2031
- 5.1. Market Analysis, Insights and Forecast - by Application
- 5.1.1. Medical Industry
- 5.1.2. Biological Research
- 5.1.3. Others
- 5.2. Market Analysis, Insights and Forecast - by Type
- 5.2.1. Cell Clone
- 5.2.2. Molecular Cloning
- 5.3. Market Analysis, Insights and Forecast - by Region
- 5.3.1. North America
- 5.3.2. South America
- 5.3.3. Europe
- 5.3.4. Middle East & Africa
- 5.3.5. Asia Pacific
- 5.1. Market Analysis, Insights and Forecast - by Application
- 6. North America Subcloning Technology Analysis, Insights and Forecast, 2019-2031
- 6.1. Market Analysis, Insights and Forecast - by Application
- 6.1.1. Medical Industry
- 6.1.2. Biological Research
- 6.1.3. Others
- 6.2. Market Analysis, Insights and Forecast - by Type
- 6.2.1. Cell Clone
- 6.2.2. Molecular Cloning
- 6.1. Market Analysis, Insights and Forecast - by Application
- 7. South America Subcloning Technology Analysis, Insights and Forecast, 2019-2031
- 7.1. Market Analysis, Insights and Forecast - by Application
- 7.1.1. Medical Industry
- 7.1.2. Biological Research
- 7.1.3. Others
- 7.2. Market Analysis, Insights and Forecast - by Type
- 7.2.1. Cell Clone
- 7.2.2. Molecular Cloning
- 7.1. Market Analysis, Insights and Forecast - by Application
- 8. Europe Subcloning Technology Analysis, Insights and Forecast, 2019-2031
- 8.1. Market Analysis, Insights and Forecast - by Application
- 8.1.1. Medical Industry
- 8.1.2. Biological Research
- 8.1.3. Others
- 8.2. Market Analysis, Insights and Forecast - by Type
- 8.2.1. Cell Clone
- 8.2.2. Molecular Cloning
- 8.1. Market Analysis, Insights and Forecast - by Application
- 9. Middle East & Africa Subcloning Technology Analysis, Insights and Forecast, 2019-2031
- 9.1. Market Analysis, Insights and Forecast - by Application
- 9.1.1. Medical Industry
- 9.1.2. Biological Research
- 9.1.3. Others
- 9.2. Market Analysis, Insights and Forecast - by Type
- 9.2.1. Cell Clone
- 9.2.2. Molecular Cloning
- 9.1. Market Analysis, Insights and Forecast - by Application
- 10. Asia Pacific Subcloning Technology Analysis, Insights and Forecast, 2019-2031
- 10.1. Market Analysis, Insights and Forecast - by Application
- 10.1.1. Medical Industry
- 10.1.2. Biological Research
- 10.1.3. Others
- 10.2. Market Analysis, Insights and Forecast - by Type
- 10.2.1. Cell Clone
- 10.2.2. Molecular Cloning
- 10.1. Market Analysis, Insights and Forecast - by Application
- 11. Competitive Analysis
- 11.1. Global Market Share Analysis 2024
- 11.2. Company Profiles
- 11.2.1 Promega
- 11.2.1.1. Overview
- 11.2.1.2. Products
- 11.2.1.3. SWOT Analysis
- 11.2.1.4. Recent Developments
- 11.2.1.5. Financials (Based on Availability)
- 11.2.2 Synbio Technologies
- 11.2.2.1. Overview
- 11.2.2.2. Products
- 11.2.2.3. SWOT Analysis
- 11.2.2.4. Recent Developments
- 11.2.2.5. Financials (Based on Availability)
- 11.2.3 Thermo Fisher Scientific
- 11.2.3.1. Overview
- 11.2.3.2. Products
- 11.2.3.3. SWOT Analysis
- 11.2.3.4. Recent Developments
- 11.2.3.5. Financials (Based on Availability)
- 11.2.4 OriGene
- 11.2.4.1. Overview
- 11.2.4.2. Products
- 11.2.4.3. SWOT Analysis
- 11.2.4.4. Recent Developments
- 11.2.4.5. Financials (Based on Availability)
- 11.2.5 Base-Asia
- 11.2.5.1. Overview
- 11.2.5.2. Products
- 11.2.5.3. SWOT Analysis
- 11.2.5.4. Recent Developments
- 11.2.5.5. Financials (Based on Availability)
- 11.2.6 Kendall Scientific
- 11.2.6.1. Overview
- 11.2.6.2. Products
- 11.2.6.3. SWOT Analysis
- 11.2.6.4. Recent Developments
- 11.2.6.5. Financials (Based on Availability)
- 11.2.7 Eurofins Scientific
- 11.2.7.1. Overview
- 11.2.7.2. Products
- 11.2.7.3. SWOT Analysis
- 11.2.7.4. Recent Developments
- 11.2.7.5. Financials (Based on Availability)
- 11.2.8 Merck KGaA
- 11.2.8.1. Overview
- 11.2.8.2. Products
- 11.2.8.3. SWOT Analysis
- 11.2.8.4. Recent Developments
- 11.2.8.5. Financials (Based on Availability)
- 11.2.9 Genscript Biotech Corp
- 11.2.9.1. Overview
- 11.2.9.2. Products
- 11.2.9.3. SWOT Analysis
- 11.2.9.4. Recent Developments
- 11.2.9.5. Financials (Based on Availability)
- 11.2.10 Bioneer Corporation
- 11.2.10.1. Overview
- 11.2.10.2. Products
- 11.2.10.3. SWOT Analysis
- 11.2.10.4. Recent Developments
- 11.2.10.5. Financials (Based on Availability)
- 11.2.11 Bio Basic
- 11.2.11.1. Overview
- 11.2.11.2. Products
- 11.2.11.3. SWOT Analysis
- 11.2.11.4. Recent Developments
- 11.2.11.5. Financials (Based on Availability)
- 11.2.1 Promega
List of Figures
- Figure 1: Global Subcloning Technology Revenue Breakdown (million, %) by Region 2024 & 2032
- Figure 2: North America Subcloning Technology Revenue (million), by Application 2024 & 2032
- Figure 3: North America Subcloning Technology Revenue Share (%), by Application 2024 & 2032
- Figure 4: North America Subcloning Technology Revenue (million), by Type 2024 & 2032
- Figure 5: North America Subcloning Technology Revenue Share (%), by Type 2024 & 2032
- Figure 6: North America Subcloning Technology Revenue (million), by Country 2024 & 2032
- Figure 7: North America Subcloning Technology Revenue Share (%), by Country 2024 & 2032
- Figure 8: South America Subcloning Technology Revenue (million), by Application 2024 & 2032
- Figure 9: South America Subcloning Technology Revenue Share (%), by Application 2024 & 2032
- Figure 10: South America Subcloning Technology Revenue (million), by Type 2024 & 2032
- Figure 11: South America Subcloning Technology Revenue Share (%), by Type 2024 & 2032
- Figure 12: South America Subcloning Technology Revenue (million), by Country 2024 & 2032
- Figure 13: South America Subcloning Technology Revenue Share (%), by Country 2024 & 2032
- Figure 14: Europe Subcloning Technology Revenue (million), by Application 2024 & 2032
- Figure 15: Europe Subcloning Technology Revenue Share (%), by Application 2024 & 2032
- Figure 16: Europe Subcloning Technology Revenue (million), by Type 2024 & 2032
- Figure 17: Europe Subcloning Technology Revenue Share (%), by Type 2024 & 2032
- Figure 18: Europe Subcloning Technology Revenue (million), by Country 2024 & 2032
- Figure 19: Europe Subcloning Technology Revenue Share (%), by Country 2024 & 2032
- Figure 20: Middle East & Africa Subcloning Technology Revenue (million), by Application 2024 & 2032
- Figure 21: Middle East & Africa Subcloning Technology Revenue Share (%), by Application 2024 & 2032
- Figure 22: Middle East & Africa Subcloning Technology Revenue (million), by Type 2024 & 2032
- Figure 23: Middle East & Africa Subcloning Technology Revenue Share (%), by Type 2024 & 2032
- Figure 24: Middle East & Africa Subcloning Technology Revenue (million), by Country 2024 & 2032
- Figure 25: Middle East & Africa Subcloning Technology Revenue Share (%), by Country 2024 & 2032
- Figure 26: Asia Pacific Subcloning Technology Revenue (million), by Application 2024 & 2032
- Figure 27: Asia Pacific Subcloning Technology Revenue Share (%), by Application 2024 & 2032
- Figure 28: Asia Pacific Subcloning Technology Revenue (million), by Type 2024 & 2032
- Figure 29: Asia Pacific Subcloning Technology Revenue Share (%), by Type 2024 & 2032
- Figure 30: Asia Pacific Subcloning Technology Revenue (million), by Country 2024 & 2032
- Figure 31: Asia Pacific Subcloning Technology Revenue Share (%), by Country 2024 & 2032
List of Tables
- Table 1: Global Subcloning Technology Revenue million Forecast, by Region 2019 & 2032
- Table 2: Global Subcloning Technology Revenue million Forecast, by Application 2019 & 2032
- Table 3: Global Subcloning Technology Revenue million Forecast, by Type 2019 & 2032
- Table 4: Global Subcloning Technology Revenue million Forecast, by Region 2019 & 2032
- Table 5: Global Subcloning Technology Revenue million Forecast, by Application 2019 & 2032
- Table 6: Global Subcloning Technology Revenue million Forecast, by Type 2019 & 2032
- Table 7: Global Subcloning Technology Revenue million Forecast, by Country 2019 & 2032
- Table 8: United States Subcloning Technology Revenue (million) Forecast, by Application 2019 & 2032
- Table 9: Canada Subcloning Technology Revenue (million) Forecast, by Application 2019 & 2032
- Table 10: Mexico Subcloning Technology Revenue (million) Forecast, by Application 2019 & 2032
- Table 11: Global Subcloning Technology Revenue million Forecast, by Application 2019 & 2032
- Table 12: Global Subcloning Technology Revenue million Forecast, by Type 2019 & 2032
- Table 13: Global Subcloning Technology Revenue million Forecast, by Country 2019 & 2032
- Table 14: Brazil Subcloning Technology Revenue (million) Forecast, by Application 2019 & 2032
- Table 15: Argentina Subcloning Technology Revenue (million) Forecast, by Application 2019 & 2032
- Table 16: Rest of South America Subcloning Technology Revenue (million) Forecast, by Application 2019 & 2032
- Table 17: Global Subcloning Technology Revenue million Forecast, by Application 2019 & 2032
- Table 18: Global Subcloning Technology Revenue million Forecast, by Type 2019 & 2032
- Table 19: Global Subcloning Technology Revenue million Forecast, by Country 2019 & 2032
- Table 20: United Kingdom Subcloning Technology Revenue (million) Forecast, by Application 2019 & 2032
- Table 21: Germany Subcloning Technology Revenue (million) Forecast, by Application 2019 & 2032
- Table 22: France Subcloning Technology Revenue (million) Forecast, by Application 2019 & 2032
- Table 23: Italy Subcloning Technology Revenue (million) Forecast, by Application 2019 & 2032
- Table 24: Spain Subcloning Technology Revenue (million) Forecast, by Application 2019 & 2032
- Table 25: Russia Subcloning Technology Revenue (million) Forecast, by Application 2019 & 2032
- Table 26: Benelux Subcloning Technology Revenue (million) Forecast, by Application 2019 & 2032
- Table 27: Nordics Subcloning Technology Revenue (million) Forecast, by Application 2019 & 2032
- Table 28: Rest of Europe Subcloning Technology Revenue (million) Forecast, by Application 2019 & 2032
- Table 29: Global Subcloning Technology Revenue million Forecast, by Application 2019 & 2032
- Table 30: Global Subcloning Technology Revenue million Forecast, by Type 2019 & 2032
- Table 31: Global Subcloning Technology Revenue million Forecast, by Country 2019 & 2032
- Table 32: Turkey Subcloning Technology Revenue (million) Forecast, by Application 2019 & 2032
- Table 33: Israel Subcloning Technology Revenue (million) Forecast, by Application 2019 & 2032
- Table 34: GCC Subcloning Technology Revenue (million) Forecast, by Application 2019 & 2032
- Table 35: North Africa Subcloning Technology Revenue (million) Forecast, by Application 2019 & 2032
- Table 36: South Africa Subcloning Technology Revenue (million) Forecast, by Application 2019 & 2032
- Table 37: Rest of Middle East & Africa Subcloning Technology Revenue (million) Forecast, by Application 2019 & 2032
- Table 38: Global Subcloning Technology Revenue million Forecast, by Application 2019 & 2032
- Table 39: Global Subcloning Technology Revenue million Forecast, by Type 2019 & 2032
- Table 40: Global Subcloning Technology Revenue million Forecast, by Country 2019 & 2032
- Table 41: China Subcloning Technology Revenue (million) Forecast, by Application 2019 & 2032
- Table 42: India Subcloning Technology Revenue (million) Forecast, by Application 2019 & 2032
- Table 43: Japan Subcloning Technology Revenue (million) Forecast, by Application 2019 & 2032
- Table 44: South Korea Subcloning Technology Revenue (million) Forecast, by Application 2019 & 2032
- Table 45: ASEAN Subcloning Technology Revenue (million) Forecast, by Application 2019 & 2032
- Table 46: Oceania Subcloning Technology Revenue (million) Forecast, by Application 2019 & 2032
- Table 47: Rest of Asia Pacific Subcloning Technology Revenue (million) Forecast, by Application 2019 & 2032
Frequently Asked Questions
1. What is the projected Compound Annual Growth Rate (CAGR) of the Subcloning Technology?
The projected CAGR is approximately XXX%.
2. Which companies are prominent players in the Subcloning Technology?
Key companies in the market include Promega, Synbio Technologies, Thermo Fisher Scientific, OriGene, Base-Asia, Kendall Scientific, Eurofins Scientific, Merck KGaA, Genscript Biotech Corp, Bioneer Corporation, Bio Basic.
3. What are the main segments of the Subcloning Technology?
The market segments include Application, Type.
4. Can you provide details about the market size?
The market size is estimated to be USD XXX million as of 2022.
5. What are some drivers contributing to market growth?
N/A
6. What are the notable trends driving market growth?
N/A
7. Are there any restraints impacting market growth?
N/A
8. Can you provide examples of recent developments in the market?
N/A
9. What pricing options are available for accessing the report?
Pricing options include single-user, multi-user, and enterprise licenses priced at USD 2900.00, USD 4350.00, and USD 5800.00 respectively.
10. Is the market size provided in terms of value or volume?
The market size is provided in terms of value, measured in million.
11. Are there any specific market keywords associated with the report?
Yes, the market keyword associated with the report is "Subcloning Technology," which aids in identifying and referencing the specific market segment covered.
12. How do I determine which pricing option suits my needs best?
The pricing options vary based on user requirements and access needs. Individual users may opt for single-user licenses, while businesses requiring broader access may choose multi-user or enterprise licenses for cost-effective access to the report.
13. Are there any additional resources or data provided in the Subcloning Technology report?
While the report offers comprehensive insights, it's advisable to review the specific contents or supplementary materials provided to ascertain if additional resources or data are available.
14. How can I stay updated on further developments or reports in the Subcloning Technology?
To stay informed about further developments, trends, and reports in the Subcloning Technology, consider subscribing to industry newsletters, following relevant companies and organizations, or regularly checking reputable industry news sources and publications.
Methodology
Step 1 - Identification of Relevant Samples Size from Population Database


Step 2 - Approaches for Defining Global Market Size (Value, Volume* & Price*)

Note*: In applicable scenarios
Step 3 - Data Sources
Primary Research
- Web Analytics
- Survey Reports
- Research Institute
- Latest Research Reports
- Opinion Leaders
Secondary Research
- Annual Reports
- White Paper
- Latest Press Release
- Industry Association
- Paid Database
- Investor Presentations

Step 4 - Data Triangulation
Involves using different sources of information in order to increase the validity of a study
These sources are likely to be stakeholders in a program - participants, other researchers, program staff, other community members, and so on.
Then we put all data in single framework & apply various statistical tools to find out the dynamic on the market.
During the analysis stage, feedback from the stakeholder groups would be compared to determine areas of agreement as well as areas of divergence
