

Key Insights
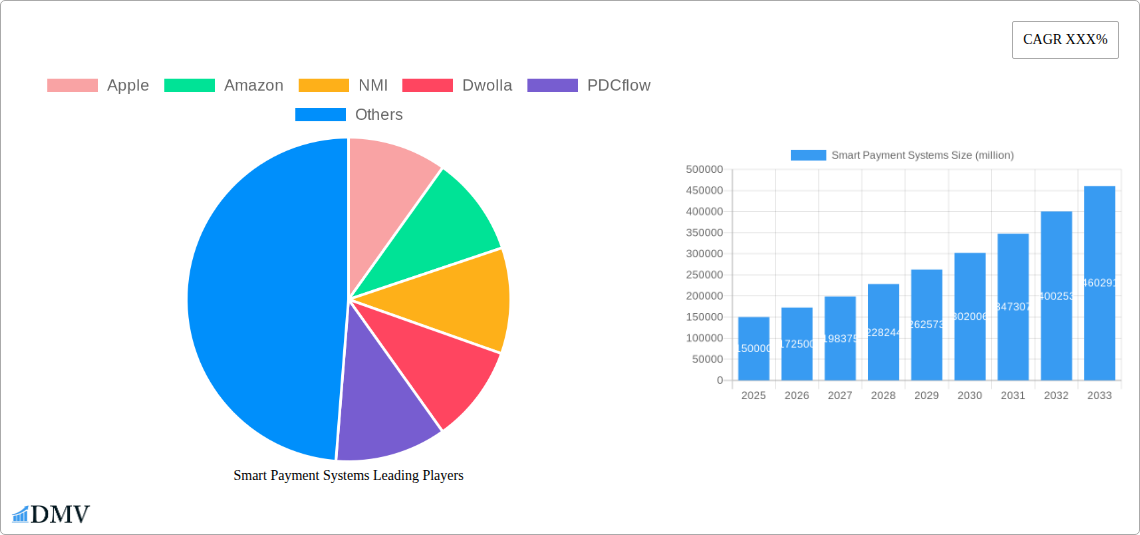
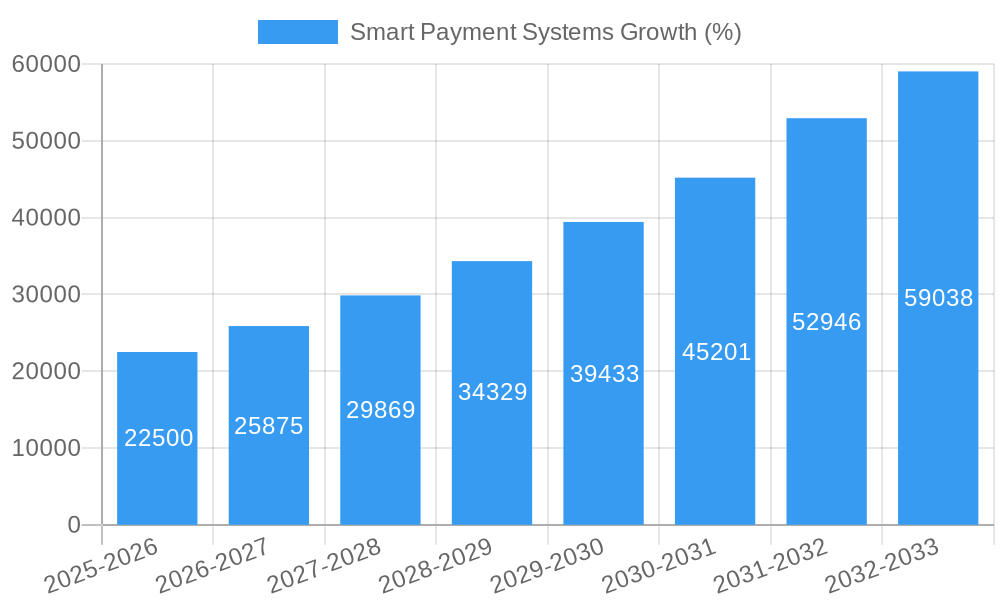
The global smart payment systems market is experiencing robust growth, driven by the increasing adoption of digital technologies and the escalating demand for secure and convenient transaction methods. The market, estimated at $150 billion in 2025, is projected to exhibit a Compound Annual Growth Rate (CAGR) of 15% from 2025 to 2033, reaching approximately $500 billion by 2033. This expansion is fueled by several key factors. The proliferation of smartphones and mobile wallets, coupled with the rising adoption of contactless payment solutions, is significantly boosting market growth. Furthermore, the increasing integration of smart payment systems with Internet of Things (IoT) devices and the growing preference for online shopping are accelerating market penetration. Government initiatives promoting digital financial inclusion and the rising awareness about the security benefits offered by smart payment systems are additional drivers. However, the market faces challenges such as concerns regarding data privacy and security breaches, along with the high initial investment costs associated with implementing smart payment systems, especially for smaller businesses.
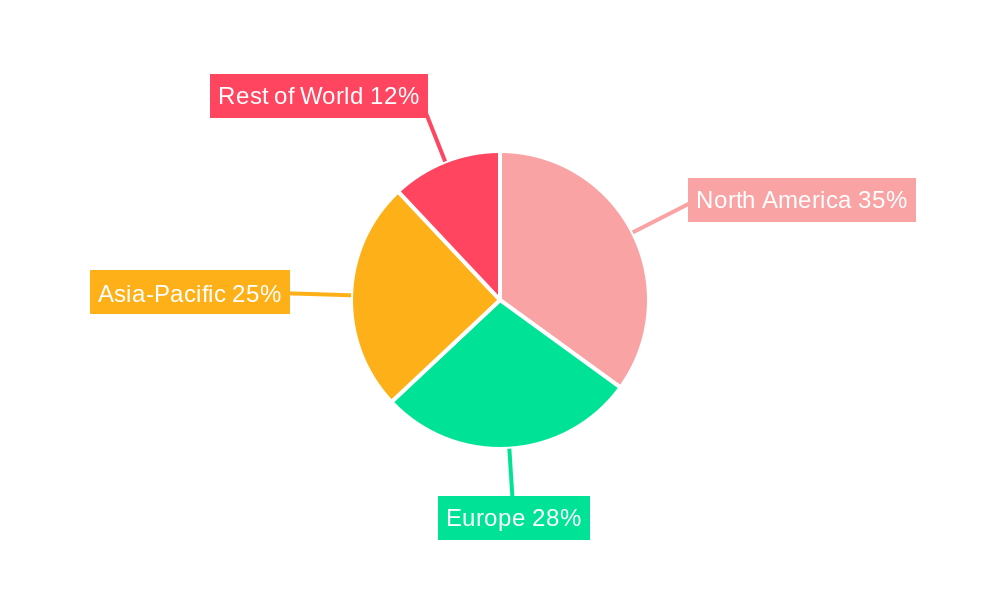
The market segmentation reflects the diverse range of technologies and applications within the smart payment landscape. Key segments include mobile payment systems, contactless payment systems, biometrics-based payment systems, and point-of-sale (POS) systems. Companies such as Apple, Amazon, and established payment processors like FIS and Heartland Payment Systems are leading the market, leveraging their technological expertise and established customer bases. Geographic variations exist, with North America and Europe holding significant market shares, but the Asia-Pacific region is projected to experience the fastest growth due to the rapid expansion of e-commerce and digital financial inclusion initiatives in developing economies. The competitive landscape is characterized by both established players and emerging technology providers vying for market share through strategic partnerships, product innovation, and expansion into new markets. The long-term outlook remains positive, indicating sustained growth propelled by technological advancements and the continuous evolution of consumer preferences towards more seamless and secure payment solutions.
Smart Payment Systems Market Report: A Comprehensive Analysis (2019-2033)
This insightful report provides a comprehensive analysis of the global smart payment systems market, offering invaluable insights for stakeholders seeking to navigate this rapidly evolving landscape. The study period spans from 2019 to 2033, with 2025 serving as both the base and estimated year. The forecast period extends from 2025 to 2033, while the historical period encompasses 2019-2024. The report projects a market valuation exceeding $XX million by 2033, driven by technological advancements and shifting consumer preferences.
Smart Payment Systems Market Composition & Trends
This section delves into the intricate composition of the smart payment systems market, examining market concentration, innovative drivers, regulatory frameworks, substitute products, end-user profiles, and merger & acquisition (M&A) activities. The market exhibits a moderately concentrated landscape with key players like Apple, Amazon, and FIS holding significant market share. However, numerous niche players and startups are also contributing to innovation.
- Market Share Distribution (2025): Apple (xx%), Amazon (xx%), FIS (xx%), NMI (xx%), Others (xx%).
- Innovation Catalysts: The rise of mobile payments, advancements in biometric authentication, and the increasing adoption of blockchain technology are key drivers.
- Regulatory Landscape: Varying regulations across different geographies pose both opportunities and challenges, impacting market penetration and adoption rates. Compliance costs are a significant consideration.
- Substitute Products: Traditional payment methods like cash and checks still hold a presence, posing a competitive pressure. The rise of cryptocurrencies presents an alternative avenue for future market share.
- End-User Profiles: The market caters to a diverse range of end-users, including consumers, businesses of all sizes, and governmental institutions. Consumer adoption is heavily driven by ease-of-use and security.
- M&A Activities (2019-2024): The historical period witnessed over xx M&A deals, totaling approximately $xx million in value, indicating strategic consolidation within the sector.
Smart Payment Systems Industry Evolution
This section provides a detailed analysis of the smart payment systems industry's evolutionary trajectory. From 2019 to 2024, the market experienced a compound annual growth rate (CAGR) of xx%, driven by increasing smartphone penetration, enhanced digital infrastructure, and growing consumer trust in digital payment solutions. Technological advancements, such as the integration of artificial intelligence (AI) and machine learning (ML) for fraud detection and personalized payment experiences, are further propelling market expansion. Consumer demands for seamless, secure, and convenient payment options continue to fuel this growth. The forecast period (2025-2033) anticipates a CAGR of xx%, with the market exceeding $XX million by 2033. Adoption rates of contactless payments are projected to increase by xx% annually.
Leading Regions, Countries, or Segments in Smart Payment Systems
North America currently dominates the smart payment systems market, fueled by high technological adoption rates, robust digital infrastructure, and a favorable regulatory environment. However, the Asia-Pacific region is emerging as a high-growth market, driven by rapid economic expansion and increasing smartphone penetration.
- Key Drivers in North America: High consumer spending, advanced technological infrastructure, and the presence of major technology companies.
- Key Drivers in Asia-Pacific: Rapid economic growth, expanding middle class, increasing smartphone usage, and government initiatives promoting digital payments.
- Dominance Factors: Early adoption of innovative technologies, strong consumer demand for convenience and security, and supportive regulatory frameworks contribute to market leadership.
Smart Payment Systems Product Innovations
Recent innovations in smart payment systems include the integration of biometric authentication (fingerprint, facial recognition), tokenization for enhanced security, and the development of advanced fraud detection systems using AI and ML. These advancements provide enhanced security, improved user experience, and reduced transaction costs. The rise of near-field communication (NFC) technology has further facilitated contactless payments.
Propelling Factors for Smart Payment Systems Growth
Several factors are driving the growth of the smart payment systems market. Technological advancements, such as the development of faster and more secure payment platforms, are a major catalyst. Furthermore, favorable economic conditions and government initiatives promoting digital financial inclusion contribute significantly. The increasing adoption of smartphones and other smart devices also plays a vital role.
Obstacles in the Smart Payment Systems Market
Despite promising growth prospects, the smart payment systems market faces challenges. Stringent regulatory compliance requirements across different jurisdictions create barriers to market entry and increase operational costs. Supply chain disruptions and cybersecurity threats pose significant risks. Intense competition from established players and emerging fintech startups further complicates market dynamics. These obstacles could cumulatively reduce growth by xx% in the forecast period.
Future Opportunities in Smart Payment Systems
Emerging technologies like blockchain and the metaverse offer substantial opportunities for market expansion. The integration of smart payment systems into Internet of Things (IoT) devices and the rise of embedded finance solutions will unlock new revenue streams. Moreover, increasing demand for personalized payment experiences and the expansion into underserved markets will further fuel growth.
Major Players in the Smart Payment Systems Ecosystem
- Apple
- Amazon
- NMI
- Dwolla
- PDCflow
- EBizCharge
- Tipalti
- FIS
- Infineon Technologies
- INSIDE Secure
- Gemalto N.V.
- Giesecke & Devrient GmbH
- Diebold Inc
- Heartland Payment Systems, Inc
- Ingenico Group
Key Developments in Smart Payment Systems Industry
- Jan 2023: Apple Pay expands its reach into a new African market.
- Mar 2022: Amazon announces a new payment solution for small businesses.
- Oct 2021: A major merger between two significant players in the smart payment industry is completed.
Strategic Smart Payment Systems Market Forecast
The smart payment systems market is poised for substantial growth in the coming years. The convergence of technological advancements, favorable economic conditions, and increasing consumer adoption will drive market expansion. Opportunities in emerging markets and the integration of new technologies will further fuel growth, making this sector an attractive investment prospect. The market is predicted to reach a value exceeding $XX million by 2033.
Smart Payment Systems Segmentation
-
1. Application
- 1.1. Retail
- 1.2. Transportation
- 1.3. Hospital
- 1.4. Media & Entertainment
- 1.5. Others
-
2. Type
- 2.1. Internet Payment
- 2.2. Mobile Payment
- 2.3. Phone Payment
Smart Payment Systems Segmentation By Geography
-
1. North America
- 1.1. United States
- 1.2. Canada
- 1.3. Mexico
-
2. South America
- 2.1. Brazil
- 2.2. Argentina
- 2.3. Rest of South America
-
3. Europe
- 3.1. United Kingdom
- 3.2. Germany
- 3.3. France
- 3.4. Italy
- 3.5. Spain
- 3.6. Russia
- 3.7. Benelux
- 3.8. Nordics
- 3.9. Rest of Europe
-
4. Middle East & Africa
- 4.1. Turkey
- 4.2. Israel
- 4.3. GCC
- 4.4. North Africa
- 4.5. South Africa
- 4.6. Rest of Middle East & Africa
-
5. Asia Pacific
- 5.1. China
- 5.2. India
- 5.3. Japan
- 5.4. South Korea
- 5.5. ASEAN
- 5.6. Oceania
- 5.7. Rest of Asia Pacific
Smart Payment Systems REPORT HIGHLIGHTS
| Aspects | Details |
|---|---|
| Study Period | 2019-2033 |
| Base Year | 2024 |
| Estimated Year | 2025 |
| Forecast Period | 2025-2033 |
| Historical Period | 2019-2024 |
| Growth Rate | CAGR of XXX% from 2019-2033 |
| Segmentation |
|
Table of Contents
- 1. Introduction
- 1.1. Research Scope
- 1.2. Market Segmentation
- 1.3. Research Methodology
- 1.4. Definitions and Assumptions
- 2. Executive Summary
- 2.1. Introduction
- 3. Market Dynamics
- 3.1. Introduction
- 3.2. Market Drivers
- 3.3. Market Restrains
- 3.4. Market Trends
- 4. Market Factor Analysis
- 4.1. Porters Five Forces
- 4.2. Supply/Value Chain
- 4.3. PESTEL analysis
- 4.4. Market Entropy
- 4.5. Patent/Trademark Analysis
- 5. Global Smart Payment Systems Analysis, Insights and Forecast, 2019-2031
- 5.1. Market Analysis, Insights and Forecast - by Application
- 5.1.1. Retail
- 5.1.2. Transportation
- 5.1.3. Hospital
- 5.1.4. Media & Entertainment
- 5.1.5. Others
- 5.2. Market Analysis, Insights and Forecast - by Type
- 5.2.1. Internet Payment
- 5.2.2. Mobile Payment
- 5.2.3. Phone Payment
- 5.3. Market Analysis, Insights and Forecast - by Region
- 5.3.1. North America
- 5.3.2. South America
- 5.3.3. Europe
- 5.3.4. Middle East & Africa
- 5.3.5. Asia Pacific
- 5.1. Market Analysis, Insights and Forecast - by Application
- 6. North America Smart Payment Systems Analysis, Insights and Forecast, 2019-2031
- 6.1. Market Analysis, Insights and Forecast - by Application
- 6.1.1. Retail
- 6.1.2. Transportation
- 6.1.3. Hospital
- 6.1.4. Media & Entertainment
- 6.1.5. Others
- 6.2. Market Analysis, Insights and Forecast - by Type
- 6.2.1. Internet Payment
- 6.2.2. Mobile Payment
- 6.2.3. Phone Payment
- 6.1. Market Analysis, Insights and Forecast - by Application
- 7. South America Smart Payment Systems Analysis, Insights and Forecast, 2019-2031
- 7.1. Market Analysis, Insights and Forecast - by Application
- 7.1.1. Retail
- 7.1.2. Transportation
- 7.1.3. Hospital
- 7.1.4. Media & Entertainment
- 7.1.5. Others
- 7.2. Market Analysis, Insights and Forecast - by Type
- 7.2.1. Internet Payment
- 7.2.2. Mobile Payment
- 7.2.3. Phone Payment
- 7.1. Market Analysis, Insights and Forecast - by Application
- 8. Europe Smart Payment Systems Analysis, Insights and Forecast, 2019-2031
- 8.1. Market Analysis, Insights and Forecast - by Application
- 8.1.1. Retail
- 8.1.2. Transportation
- 8.1.3. Hospital
- 8.1.4. Media & Entertainment
- 8.1.5. Others
- 8.2. Market Analysis, Insights and Forecast - by Type
- 8.2.1. Internet Payment
- 8.2.2. Mobile Payment
- 8.2.3. Phone Payment
- 8.1. Market Analysis, Insights and Forecast - by Application
- 9. Middle East & Africa Smart Payment Systems Analysis, Insights and Forecast, 2019-2031
- 9.1. Market Analysis, Insights and Forecast - by Application
- 9.1.1. Retail
- 9.1.2. Transportation
- 9.1.3. Hospital
- 9.1.4. Media & Entertainment
- 9.1.5. Others
- 9.2. Market Analysis, Insights and Forecast - by Type
- 9.2.1. Internet Payment
- 9.2.2. Mobile Payment
- 9.2.3. Phone Payment
- 9.1. Market Analysis, Insights and Forecast - by Application
- 10. Asia Pacific Smart Payment Systems Analysis, Insights and Forecast, 2019-2031
- 10.1. Market Analysis, Insights and Forecast - by Application
- 10.1.1. Retail
- 10.1.2. Transportation
- 10.1.3. Hospital
- 10.1.4. Media & Entertainment
- 10.1.5. Others
- 10.2. Market Analysis, Insights and Forecast - by Type
- 10.2.1. Internet Payment
- 10.2.2. Mobile Payment
- 10.2.3. Phone Payment
- 10.1. Market Analysis, Insights and Forecast - by Application
- 11. Competitive Analysis
- 11.1. Global Market Share Analysis 2024
- 11.2. Company Profiles
- 11.2.1 Apple
- 11.2.1.1. Overview
- 11.2.1.2. Products
- 11.2.1.3. SWOT Analysis
- 11.2.1.4. Recent Developments
- 11.2.1.5. Financials (Based on Availability)
- 11.2.2 Amazon
- 11.2.2.1. Overview
- 11.2.2.2. Products
- 11.2.2.3. SWOT Analysis
- 11.2.2.4. Recent Developments
- 11.2.2.5. Financials (Based on Availability)
- 11.2.3 NMI
- 11.2.3.1. Overview
- 11.2.3.2. Products
- 11.2.3.3. SWOT Analysis
- 11.2.3.4. Recent Developments
- 11.2.3.5. Financials (Based on Availability)
- 11.2.4 Dwolla
- 11.2.4.1. Overview
- 11.2.4.2. Products
- 11.2.4.3. SWOT Analysis
- 11.2.4.4. Recent Developments
- 11.2.4.5. Financials (Based on Availability)
- 11.2.5 PDCflow
- 11.2.5.1. Overview
- 11.2.5.2. Products
- 11.2.5.3. SWOT Analysis
- 11.2.5.4. Recent Developments
- 11.2.5.5. Financials (Based on Availability)
- 11.2.6 EBizCharge
- 11.2.6.1. Overview
- 11.2.6.2. Products
- 11.2.6.3. SWOT Analysis
- 11.2.6.4. Recent Developments
- 11.2.6.5. Financials (Based on Availability)
- 11.2.7 Tipalti
- 11.2.7.1. Overview
- 11.2.7.2. Products
- 11.2.7.3. SWOT Analysis
- 11.2.7.4. Recent Developments
- 11.2.7.5. Financials (Based on Availability)
- 11.2.8 FIS
- 11.2.8.1. Overview
- 11.2.8.2. Products
- 11.2.8.3. SWOT Analysis
- 11.2.8.4. Recent Developments
- 11.2.8.5. Financials (Based on Availability)
- 11.2.9 Infineon Technologies
- 11.2.9.1. Overview
- 11.2.9.2. Products
- 11.2.9.3. SWOT Analysis
- 11.2.9.4. Recent Developments
- 11.2.9.5. Financials (Based on Availability)
- 11.2.10 INSIDE Secure
- 11.2.10.1. Overview
- 11.2.10.2. Products
- 11.2.10.3. SWOT Analysis
- 11.2.10.4. Recent Developments
- 11.2.10.5. Financials (Based on Availability)
- 11.2.11 Gemalto N.V.
- 11.2.11.1. Overview
- 11.2.11.2. Products
- 11.2.11.3. SWOT Analysis
- 11.2.11.4. Recent Developments
- 11.2.11.5. Financials (Based on Availability)
- 11.2.12 Giesecke & Devrient GmbH
- 11.2.12.1. Overview
- 11.2.12.2. Products
- 11.2.12.3. SWOT Analysis
- 11.2.12.4. Recent Developments
- 11.2.12.5. Financials (Based on Availability)
- 11.2.13 Diebold Inc
- 11.2.13.1. Overview
- 11.2.13.2. Products
- 11.2.13.3. SWOT Analysis
- 11.2.13.4. Recent Developments
- 11.2.13.5. Financials (Based on Availability)
- 11.2.14 Heartland Payment Systems Inc
- 11.2.14.1. Overview
- 11.2.14.2. Products
- 11.2.14.3. SWOT Analysis
- 11.2.14.4. Recent Developments
- 11.2.14.5. Financials (Based on Availability)
- 11.2.15 Ingenico Group
- 11.2.15.1. Overview
- 11.2.15.2. Products
- 11.2.15.3. SWOT Analysis
- 11.2.15.4. Recent Developments
- 11.2.15.5. Financials (Based on Availability)
- 11.2.1 Apple
List of Figures
- Figure 1: Global Smart Payment Systems Revenue Breakdown (million, %) by Region 2024 & 2032
- Figure 2: North America Smart Payment Systems Revenue (million), by Application 2024 & 2032
- Figure 3: North America Smart Payment Systems Revenue Share (%), by Application 2024 & 2032
- Figure 4: North America Smart Payment Systems Revenue (million), by Type 2024 & 2032
- Figure 5: North America Smart Payment Systems Revenue Share (%), by Type 2024 & 2032
- Figure 6: North America Smart Payment Systems Revenue (million), by Country 2024 & 2032
- Figure 7: North America Smart Payment Systems Revenue Share (%), by Country 2024 & 2032
- Figure 8: South America Smart Payment Systems Revenue (million), by Application 2024 & 2032
- Figure 9: South America Smart Payment Systems Revenue Share (%), by Application 2024 & 2032
- Figure 10: South America Smart Payment Systems Revenue (million), by Type 2024 & 2032
- Figure 11: South America Smart Payment Systems Revenue Share (%), by Type 2024 & 2032
- Figure 12: South America Smart Payment Systems Revenue (million), by Country 2024 & 2032
- Figure 13: South America Smart Payment Systems Revenue Share (%), by Country 2024 & 2032
- Figure 14: Europe Smart Payment Systems Revenue (million), by Application 2024 & 2032
- Figure 15: Europe Smart Payment Systems Revenue Share (%), by Application 2024 & 2032
- Figure 16: Europe Smart Payment Systems Revenue (million), by Type 2024 & 2032
- Figure 17: Europe Smart Payment Systems Revenue Share (%), by Type 2024 & 2032
- Figure 18: Europe Smart Payment Systems Revenue (million), by Country 2024 & 2032
- Figure 19: Europe Smart Payment Systems Revenue Share (%), by Country 2024 & 2032
- Figure 20: Middle East & Africa Smart Payment Systems Revenue (million), by Application 2024 & 2032
- Figure 21: Middle East & Africa Smart Payment Systems Revenue Share (%), by Application 2024 & 2032
- Figure 22: Middle East & Africa Smart Payment Systems Revenue (million), by Type 2024 & 2032
- Figure 23: Middle East & Africa Smart Payment Systems Revenue Share (%), by Type 2024 & 2032
- Figure 24: Middle East & Africa Smart Payment Systems Revenue (million), by Country 2024 & 2032
- Figure 25: Middle East & Africa Smart Payment Systems Revenue Share (%), by Country 2024 & 2032
- Figure 26: Asia Pacific Smart Payment Systems Revenue (million), by Application 2024 & 2032
- Figure 27: Asia Pacific Smart Payment Systems Revenue Share (%), by Application 2024 & 2032
- Figure 28: Asia Pacific Smart Payment Systems Revenue (million), by Type 2024 & 2032
- Figure 29: Asia Pacific Smart Payment Systems Revenue Share (%), by Type 2024 & 2032
- Figure 30: Asia Pacific Smart Payment Systems Revenue (million), by Country 2024 & 2032
- Figure 31: Asia Pacific Smart Payment Systems Revenue Share (%), by Country 2024 & 2032
List of Tables
- Table 1: Global Smart Payment Systems Revenue million Forecast, by Region 2019 & 2032
- Table 2: Global Smart Payment Systems Revenue million Forecast, by Application 2019 & 2032
- Table 3: Global Smart Payment Systems Revenue million Forecast, by Type 2019 & 2032
- Table 4: Global Smart Payment Systems Revenue million Forecast, by Region 2019 & 2032
- Table 5: Global Smart Payment Systems Revenue million Forecast, by Application 2019 & 2032
- Table 6: Global Smart Payment Systems Revenue million Forecast, by Type 2019 & 2032
- Table 7: Global Smart Payment Systems Revenue million Forecast, by Country 2019 & 2032
- Table 8: United States Smart Payment Systems Revenue (million) Forecast, by Application 2019 & 2032
- Table 9: Canada Smart Payment Systems Revenue (million) Forecast, by Application 2019 & 2032
- Table 10: Mexico Smart Payment Systems Revenue (million) Forecast, by Application 2019 & 2032
- Table 11: Global Smart Payment Systems Revenue million Forecast, by Application 2019 & 2032
- Table 12: Global Smart Payment Systems Revenue million Forecast, by Type 2019 & 2032
- Table 13: Global Smart Payment Systems Revenue million Forecast, by Country 2019 & 2032
- Table 14: Brazil Smart Payment Systems Revenue (million) Forecast, by Application 2019 & 2032
- Table 15: Argentina Smart Payment Systems Revenue (million) Forecast, by Application 2019 & 2032
- Table 16: Rest of South America Smart Payment Systems Revenue (million) Forecast, by Application 2019 & 2032
- Table 17: Global Smart Payment Systems Revenue million Forecast, by Application 2019 & 2032
- Table 18: Global Smart Payment Systems Revenue million Forecast, by Type 2019 & 2032
- Table 19: Global Smart Payment Systems Revenue million Forecast, by Country 2019 & 2032
- Table 20: United Kingdom Smart Payment Systems Revenue (million) Forecast, by Application 2019 & 2032
- Table 21: Germany Smart Payment Systems Revenue (million) Forecast, by Application 2019 & 2032
- Table 22: France Smart Payment Systems Revenue (million) Forecast, by Application 2019 & 2032
- Table 23: Italy Smart Payment Systems Revenue (million) Forecast, by Application 2019 & 2032
- Table 24: Spain Smart Payment Systems Revenue (million) Forecast, by Application 2019 & 2032
- Table 25: Russia Smart Payment Systems Revenue (million) Forecast, by Application 2019 & 2032
- Table 26: Benelux Smart Payment Systems Revenue (million) Forecast, by Application 2019 & 2032
- Table 27: Nordics Smart Payment Systems Revenue (million) Forecast, by Application 2019 & 2032
- Table 28: Rest of Europe Smart Payment Systems Revenue (million) Forecast, by Application 2019 & 2032
- Table 29: Global Smart Payment Systems Revenue million Forecast, by Application 2019 & 2032
- Table 30: Global Smart Payment Systems Revenue million Forecast, by Type 2019 & 2032
- Table 31: Global Smart Payment Systems Revenue million Forecast, by Country 2019 & 2032
- Table 32: Turkey Smart Payment Systems Revenue (million) Forecast, by Application 2019 & 2032
- Table 33: Israel Smart Payment Systems Revenue (million) Forecast, by Application 2019 & 2032
- Table 34: GCC Smart Payment Systems Revenue (million) Forecast, by Application 2019 & 2032
- Table 35: North Africa Smart Payment Systems Revenue (million) Forecast, by Application 2019 & 2032
- Table 36: South Africa Smart Payment Systems Revenue (million) Forecast, by Application 2019 & 2032
- Table 37: Rest of Middle East & Africa Smart Payment Systems Revenue (million) Forecast, by Application 2019 & 2032
- Table 38: Global Smart Payment Systems Revenue million Forecast, by Application 2019 & 2032
- Table 39: Global Smart Payment Systems Revenue million Forecast, by Type 2019 & 2032
- Table 40: Global Smart Payment Systems Revenue million Forecast, by Country 2019 & 2032
- Table 41: China Smart Payment Systems Revenue (million) Forecast, by Application 2019 & 2032
- Table 42: India Smart Payment Systems Revenue (million) Forecast, by Application 2019 & 2032
- Table 43: Japan Smart Payment Systems Revenue (million) Forecast, by Application 2019 & 2032
- Table 44: South Korea Smart Payment Systems Revenue (million) Forecast, by Application 2019 & 2032
- Table 45: ASEAN Smart Payment Systems Revenue (million) Forecast, by Application 2019 & 2032
- Table 46: Oceania Smart Payment Systems Revenue (million) Forecast, by Application 2019 & 2032
- Table 47: Rest of Asia Pacific Smart Payment Systems Revenue (million) Forecast, by Application 2019 & 2032
Frequently Asked Questions
1. What is the projected Compound Annual Growth Rate (CAGR) of the Smart Payment Systems?
The projected CAGR is approximately XXX%.
2. Which companies are prominent players in the Smart Payment Systems?
Key companies in the market include Apple, Amazon, NMI, Dwolla, PDCflow, EBizCharge, Tipalti, FIS, Infineon Technologies, INSIDE Secure, Gemalto N.V., Giesecke & Devrient GmbH, Diebold Inc, Heartland Payment Systems, Inc, Ingenico Group.
3. What are the main segments of the Smart Payment Systems?
The market segments include Application, Type.
4. Can you provide details about the market size?
The market size is estimated to be USD XXX million as of 2022.
5. What are some drivers contributing to market growth?
N/A
6. What are the notable trends driving market growth?
N/A
7. Are there any restraints impacting market growth?
N/A
8. Can you provide examples of recent developments in the market?
N/A
9. What pricing options are available for accessing the report?
Pricing options include single-user, multi-user, and enterprise licenses priced at USD 2900.00, USD 4350.00, and USD 5800.00 respectively.
10. Is the market size provided in terms of value or volume?
The market size is provided in terms of value, measured in million.
11. Are there any specific market keywords associated with the report?
Yes, the market keyword associated with the report is "Smart Payment Systems," which aids in identifying and referencing the specific market segment covered.
12. How do I determine which pricing option suits my needs best?
The pricing options vary based on user requirements and access needs. Individual users may opt for single-user licenses, while businesses requiring broader access may choose multi-user or enterprise licenses for cost-effective access to the report.
13. Are there any additional resources or data provided in the Smart Payment Systems report?
While the report offers comprehensive insights, it's advisable to review the specific contents or supplementary materials provided to ascertain if additional resources or data are available.
14. How can I stay updated on further developments or reports in the Smart Payment Systems?
To stay informed about further developments, trends, and reports in the Smart Payment Systems, consider subscribing to industry newsletters, following relevant companies and organizations, or regularly checking reputable industry news sources and publications.
Methodology
Step 1 - Identification of Relevant Samples Size from Population Database


Step 2 - Approaches for Defining Global Market Size (Value, Volume* & Price*)

Note*: In applicable scenarios
Step 3 - Data Sources
Primary Research
- Web Analytics
- Survey Reports
- Research Institute
- Latest Research Reports
- Opinion Leaders
Secondary Research
- Annual Reports
- White Paper
- Latest Press Release
- Industry Association
- Paid Database
- Investor Presentations

Step 4 - Data Triangulation
Involves using different sources of information in order to increase the validity of a study
These sources are likely to be stakeholders in a program - participants, other researchers, program staff, other community members, and so on.
Then we put all data in single framework & apply various statistical tools to find out the dynamic on the market.
During the analysis stage, feedback from the stakeholder groups would be compared to determine areas of agreement as well as areas of divergence
