

Key Insights
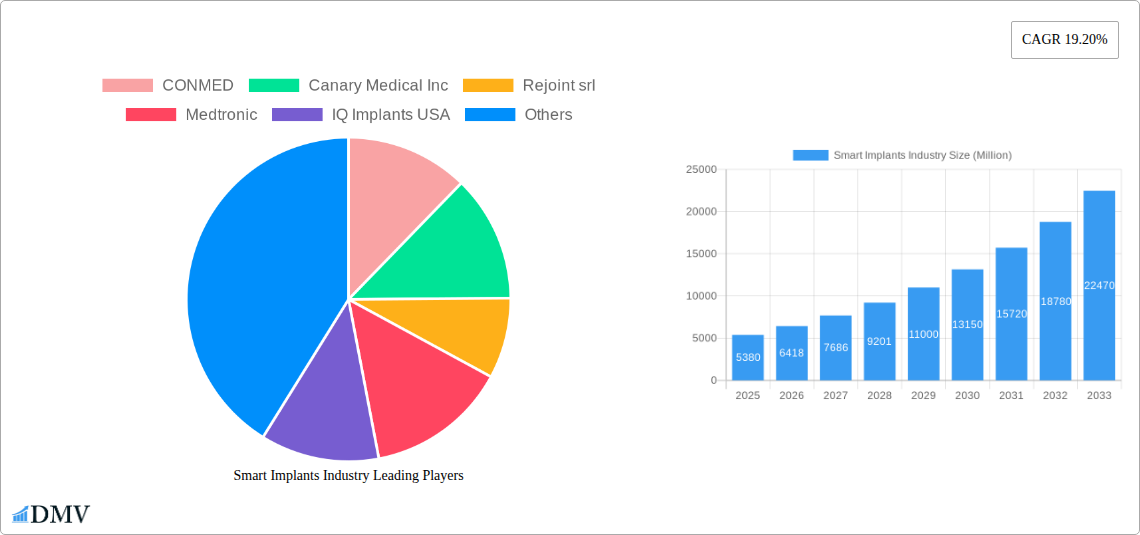
The global smart implants market is experiencing robust growth, projected to reach $5.38 billion in 2025 and exhibiting a Compound Annual Growth Rate (CAGR) of 19.20% from 2025 to 2033. This expansion is driven by several key factors. Technological advancements leading to the development of smaller, more biocompatible, and sophisticated implants are significantly impacting the market. The increasing prevalence of chronic diseases, particularly cardiovascular conditions and orthopedic injuries, necessitates more effective treatment options, fueling demand for smart implants offering improved functionality and patient outcomes. Furthermore, the rising adoption of minimally invasive surgical techniques and the increasing preference for personalized medicine further contribute to market growth. The integration of advanced technologies such as sensors, wireless communication, and data analytics within these implants allows for remote monitoring, improved diagnostics, and personalized treatment plans, enhancing patient care and reducing healthcare costs in the long run.
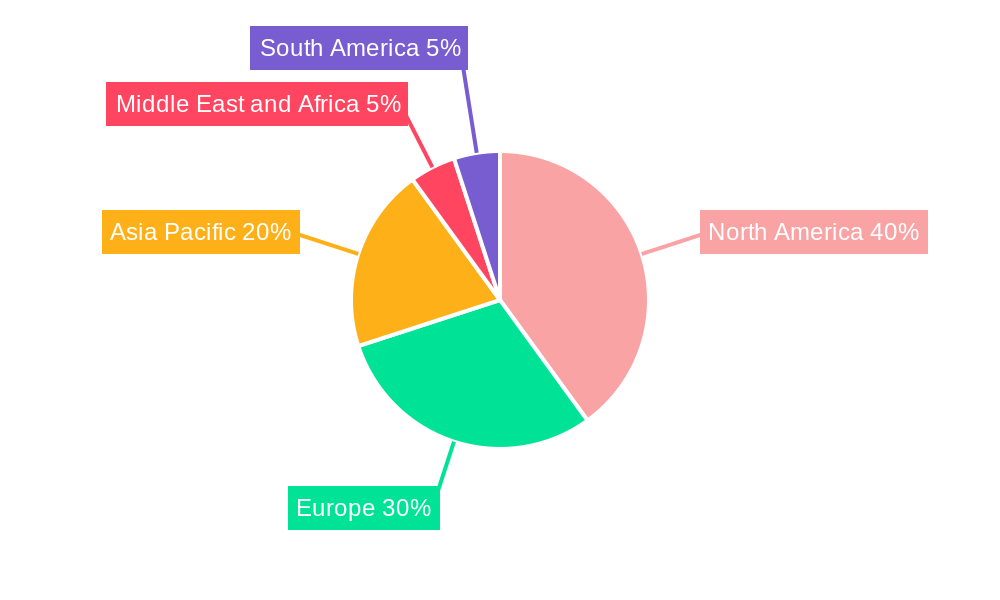
Market segmentation reveals significant opportunities across various product types and end-users. Orthopedic smart implants currently dominate the product landscape, driven by a large and growing elderly population susceptible to joint-related issues. However, segments such as cardiovascular and ophthalmic smart implants are expected to experience substantial growth due to increasing incidence of heart diseases and vision impairments respectively. Hospitals and ambulatory surgical centers represent major end-users, yet the increasing adoption of smart implants within specialized clinics is also driving growth. Regionally, North America and Europe currently hold the largest market shares, primarily due to advanced healthcare infrastructure and high adoption rates of innovative medical technologies. However, rapidly developing economies in the Asia-Pacific region, particularly China and India, present significant untapped potential, promising substantial growth in the coming years. Competition within the market is intense, with major players such as Medtronic, Johnson & Johnson, and Stryker vying for market share alongside emerging innovative companies.
Smart Implants Market Report: 2019-2033 - A Comprehensive Analysis
This insightful report delivers a comprehensive analysis of the global Smart Implants market, projecting a market value of $XX Million by 2033. It offers a detailed examination of market dynamics, competitive landscapes, and future growth opportunities across various segments, providing invaluable insights for stakeholders in the medical device industry. The study period covers 2019-2033, with 2025 serving as the base and estimated year. The forecast period spans 2025-2033, while the historical period encompasses 2019-2024.
Smart Implants Industry Market Composition & Trends
This section meticulously analyzes the competitive landscape of the smart implants market, evaluating market concentration, innovation drivers, regulatory hurdles, substitute product impacts, end-user preferences, and mergers & acquisitions (M&A) activities. The report delves into market share distribution among key players like Medtronic, Johnson & Johnson (DePuy Synthes), Zimmer Biomet, and Stryker, quantifying their individual contributions to the overall market value. Furthermore, it assesses the impact of recent M&A activities, including deal values and their influence on market consolidation.
- Market Concentration: The market exhibits a moderately concentrated structure with a few major players holding significant market share.
- Innovation Catalysts: Advancements in materials science, miniaturization, and wireless communication technologies drive innovation.
- Regulatory Landscape: Stringent regulatory approvals (e.g., FDA, CE mark) pose significant barriers to entry and influence product development timelines.
- Substitute Products: Traditional implants represent a key substitute, although smart implants offer superior functionalities and patient benefits.
- End-User Profiles: Hospitals and specialized clinics (orthopedics, ophthalmic, dental) constitute major end-users, with ambulatory surgical centers showing increasing adoption.
- M&A Activities: The report analyzes recent M&A deals, estimating their total value at $XX Million in the past five years, reflecting strategic consolidation within the industry. The average deal value is approximately $XX Million.
Smart Implants Industry Evolution
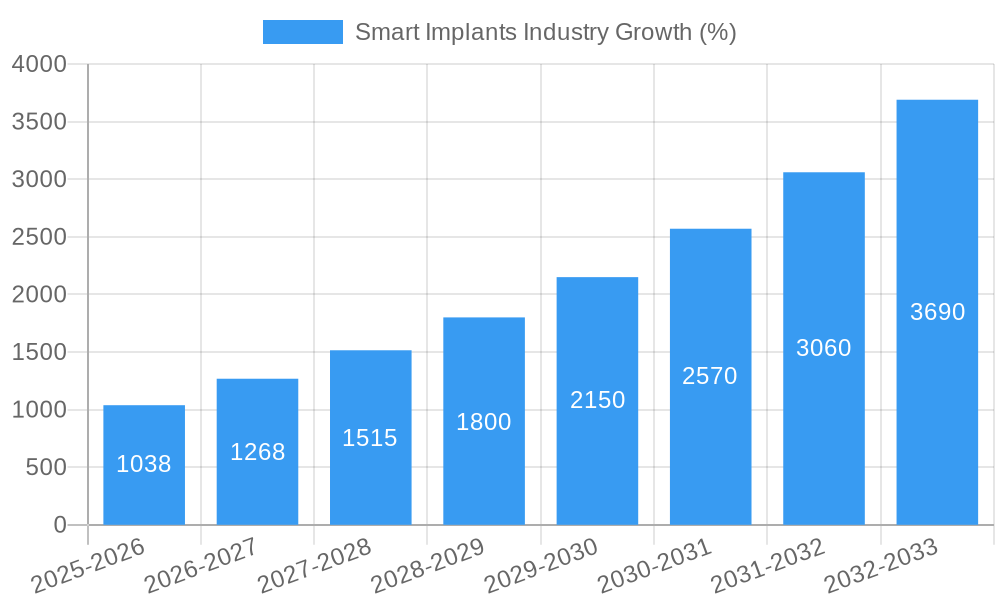
This section provides a detailed account of the smart implants market's growth trajectory, examining technological advancements and shifts in consumer preferences from 2019 to 2033. It presents comprehensive data on market growth rates, adoption rates of smart implants across various applications, and changing consumer demands for minimally invasive procedures and improved post-operative outcomes. The analysis incorporates historical data and projections to illustrate market evolution, highlighting key inflection points. The CAGR (Compound Annual Growth Rate) for the forecast period (2025-2033) is projected at XX%. Adoption rates are expected to increase by XX% annually. Demand for smart implants is driven by growing patient preference for minimally invasive surgeries, improved treatment efficacy, and enhanced patient monitoring capabilities.
Leading Regions, Countries, or Segments in Smart Implants Industry
This section identifies the leading regions, countries, and segments within the smart implants market. North America currently holds the largest market share, primarily driven by higher healthcare expenditure and technological advancements. However, Asia-Pacific is projected to experience significant growth due to increasing healthcare infrastructure investments and rising prevalence of chronic diseases.
By Product Type:
- Orthopedics Smart Implants: This segment dominates the market, fueled by increasing joint replacement surgeries and the demand for improved implant functionality and monitoring. Key drivers include advancements in biomaterials and surgical techniques.
- Cardiovascular Smart Implants: This segment shows substantial growth potential due to the rising prevalence of cardiovascular diseases and ongoing technological innovations in pacemakers and implantable defibrillators. Regulatory approvals are a key driver in this segment.
- Other Segments (Opthalmic, Dental, Cosmetic): These segments are experiencing moderate growth, driven by specific technological advancements and increasing adoption.
By End User:
- Hospitals: Hospitals remain the primary end-users, driven by their established infrastructure and expertise in complex surgical procedures.
- Ambulatory Surgical Centers: Growth in ambulatory surgical centers is driving increased demand for smart implants due to cost-effectiveness and improved patient outcomes.
Smart Implants Industry Product Innovations
Recent years have witnessed significant product innovations, including the integration of advanced sensors, improved biocompatibility, and enhanced data analytics capabilities. These innovations translate to longer implant lifespans, reduced complications, and improved patient outcomes. Unique selling propositions include remote monitoring capabilities, personalized treatment plans, and data-driven insights improving healthcare delivery. Technological advancements, such as miniaturization of sensors and advanced algorithms for data processing, have significantly improved the functionality and effectiveness of smart implants.
Propelling Factors for Smart Implants Industry Growth
Several factors contribute to the smart implants market's growth. Technological advancements in miniaturization, sensor technology, and wireless communication continuously improve implant functionality and patient outcomes. Favorable regulatory environments in key markets accelerate product adoption. Moreover, rising healthcare expenditure and increasing prevalence of chronic diseases drive greater demand for advanced medical solutions.
Obstacles in the Smart Implants Industry Market
High development costs, stringent regulatory approvals, complex supply chains, and potential cybersecurity concerns pose significant challenges. Competition from established players and the potential for product recalls also contribute to market uncertainty. These factors collectively impact market growth and profitability. The average time to market for a new smart implant is estimated at XX months, adding another hurdle for smaller players.
Future Opportunities in Smart Implants Industry
Emerging markets in Asia-Pacific and Latin America offer immense growth potential. Advancements in artificial intelligence (AI) and machine learning (ML) for personalized treatment plans and improved data analytics are significant opportunities. Furthermore, the development of biocompatible materials and integration with telemedicine platforms are poised to significantly expand the market.
Major Players in the Smart Implants Industry Ecosystem
- CONMED
- Canary Medical Inc
- Rejoint srl
- Medtronic
- IQ Implants USA
- Stryker
- Johnson & Johnson (DePuy Synthes)
- Zimmer Biomet
- NuVasive Inc
- Smart Implant Solutions
Key Developments in Smart Implants Industry Industry
- Jan 2023: Medtronic launches a new generation of smart pacemakers with improved battery life.
- Oct 2022: Johnson & Johnson (DePuy Synthes) acquires a smaller smart implant company for $XX Million.
- May 2021: Zimmer Biomet receives FDA approval for its novel smart knee implant.
- (Add further relevant developments with year/month and impact)
Strategic Smart Implants Industry Market Forecast
The smart implants market is poised for robust growth, driven by technological advancements, increasing prevalence of chronic diseases, and rising healthcare spending. Emerging markets and innovative product launches will further contribute to market expansion. The continued integration of AI and IoT technologies offers significant opportunities for improvement in patient care and the expansion of telemedicine capabilities. The market is expected to reach $XX Million by 2033, showcasing immense potential for stakeholders.
Smart Implants Industry Segmentation
-
1. Product Type
-
1.1. Orthopedics Smart Implants
- 1.1.1. Knee Arthroplasty
- 1.1.2. Hip Arthroplasty
- 1.1.3. Spine Fusion
- 1.1.4. Fracture Fixation
- 1.1.5. Others
-
1.2. Cardiovascular Smart Implants
- 1.2.1. Pacing devices
- 1.2.2. Stents
- 1.2.3. Structural Cardiac Implants
-
1.3. Opthalmic Smart Implants
- 1.3.1. Intraocular lens
- 1.3.2. Glaucoma Implants
- 1.4. Dental Smart Implants
- 1.5. Cosmetic smart Implants
-
1.1. Orthopedics Smart Implants
-
2. End User
- 2.1. Hospitals
- 2.2. Ambulatory Surgical Centers
- 2.3. Orthopedics Clinics
- 2.4. Opthalmic Clinics
- 2.5. Dental Labs
- 2.6. Others
Smart Implants Industry Segmentation By Geography
-
1. North America
- 1.1. United States
- 1.2. Canada
- 1.3. Mexico
-
2. Europe
- 2.1. Germany
- 2.2. United Kingdom
- 2.3. France
- 2.4. Italy
- 2.5. Spain
- 2.6. Rest of Europe
-
3. Asia Pacific
- 3.1. China
- 3.2. Japan
- 3.3. India
- 3.4. Australia
- 3.5. South Korea
- 3.6. Rest of Asia Pacific
-
4. Middle East and Africa
- 4.1. GCC
- 4.2. South Africa
- 4.3. Rest of Middle East and Africa
-
5. South America
- 5.1. Brazil
- 5.2. Argentina
- 5.3. Rest of South America
Smart Implants Industry REPORT HIGHLIGHTS
| Aspects | Details |
|---|---|
| Study Period | 2019-2033 |
| Base Year | 2024 |
| Estimated Year | 2025 |
| Forecast Period | 2025-2033 |
| Historical Period | 2019-2024 |
| Growth Rate | CAGR of 19.20% from 2019-2033 |
| Segmentation |
|
Table of Contents
- 1. Introduction
- 1.1. Research Scope
- 1.2. Market Segmentation
- 1.3. Research Methodology
- 1.4. Definitions and Assumptions
- 2. Executive Summary
- 2.1. Introduction
- 3. Market Dynamics
- 3.1. Introduction
- 3.2. Market Drivers
- 3.2.1. Increase in the Geriatric Population with Various Chronic Disorder; Rising Incidence of Accidents and Sport Injuries; Technological Advancements in the Field of Smart Implants
- 3.3. Market Restrains
- 3.3.1. Stringent Regulatory Framework
- 3.4. Market Trends
- 3.4.1. Orthopedic Smart Implants Segment is Expected to Witness high Growth Over the Forecast Period
- 4. Market Factor Analysis
- 4.1. Porters Five Forces
- 4.2. Supply/Value Chain
- 4.3. PESTEL analysis
- 4.4. Market Entropy
- 4.5. Patent/Trademark Analysis
- 5. Global Smart Implants Industry Analysis, Insights and Forecast, 2019-2031
- 5.1. Market Analysis, Insights and Forecast - by Product Type
- 5.1.1. Orthopedics Smart Implants
- 5.1.1.1. Knee Arthroplasty
- 5.1.1.2. Hip Arthroplasty
- 5.1.1.3. Spine Fusion
- 5.1.1.4. Fracture Fixation
- 5.1.1.5. Others
- 5.1.2. Cardiovascular Smart Implants
- 5.1.2.1. Pacing devices
- 5.1.2.2. Stents
- 5.1.2.3. Structural Cardiac Implants
- 5.1.3. Opthalmic Smart Implants
- 5.1.3.1. Intraocular lens
- 5.1.3.2. Glaucoma Implants
- 5.1.4. Dental Smart Implants
- 5.1.5. Cosmetic smart Implants
- 5.1.1. Orthopedics Smart Implants
- 5.2. Market Analysis, Insights and Forecast - by End User
- 5.2.1. Hospitals
- 5.2.2. Ambulatory Surgical Centers
- 5.2.3. Orthopedics Clinics
- 5.2.4. Opthalmic Clinics
- 5.2.5. Dental Labs
- 5.2.6. Others
- 5.3. Market Analysis, Insights and Forecast - by Region
- 5.3.1. North America
- 5.3.2. Europe
- 5.3.3. Asia Pacific
- 5.3.4. Middle East and Africa
- 5.3.5. South America
- 5.1. Market Analysis, Insights and Forecast - by Product Type
- 6. North America Smart Implants Industry Analysis, Insights and Forecast, 2019-2031
- 6.1. Market Analysis, Insights and Forecast - by Product Type
- 6.1.1. Orthopedics Smart Implants
- 6.1.1.1. Knee Arthroplasty
- 6.1.1.2. Hip Arthroplasty
- 6.1.1.3. Spine Fusion
- 6.1.1.4. Fracture Fixation
- 6.1.1.5. Others
- 6.1.2. Cardiovascular Smart Implants
- 6.1.2.1. Pacing devices
- 6.1.2.2. Stents
- 6.1.2.3. Structural Cardiac Implants
- 6.1.3. Opthalmic Smart Implants
- 6.1.3.1. Intraocular lens
- 6.1.3.2. Glaucoma Implants
- 6.1.4. Dental Smart Implants
- 6.1.5. Cosmetic smart Implants
- 6.1.1. Orthopedics Smart Implants
- 6.2. Market Analysis, Insights and Forecast - by End User
- 6.2.1. Hospitals
- 6.2.2. Ambulatory Surgical Centers
- 6.2.3. Orthopedics Clinics
- 6.2.4. Opthalmic Clinics
- 6.2.5. Dental Labs
- 6.2.6. Others
- 6.1. Market Analysis, Insights and Forecast - by Product Type
- 7. Europe Smart Implants Industry Analysis, Insights and Forecast, 2019-2031
- 7.1. Market Analysis, Insights and Forecast - by Product Type
- 7.1.1. Orthopedics Smart Implants
- 7.1.1.1. Knee Arthroplasty
- 7.1.1.2. Hip Arthroplasty
- 7.1.1.3. Spine Fusion
- 7.1.1.4. Fracture Fixation
- 7.1.1.5. Others
- 7.1.2. Cardiovascular Smart Implants
- 7.1.2.1. Pacing devices
- 7.1.2.2. Stents
- 7.1.2.3. Structural Cardiac Implants
- 7.1.3. Opthalmic Smart Implants
- 7.1.3.1. Intraocular lens
- 7.1.3.2. Glaucoma Implants
- 7.1.4. Dental Smart Implants
- 7.1.5. Cosmetic smart Implants
- 7.1.1. Orthopedics Smart Implants
- 7.2. Market Analysis, Insights and Forecast - by End User
- 7.2.1. Hospitals
- 7.2.2. Ambulatory Surgical Centers
- 7.2.3. Orthopedics Clinics
- 7.2.4. Opthalmic Clinics
- 7.2.5. Dental Labs
- 7.2.6. Others
- 7.1. Market Analysis, Insights and Forecast - by Product Type
- 8. Asia Pacific Smart Implants Industry Analysis, Insights and Forecast, 2019-2031
- 8.1. Market Analysis, Insights and Forecast - by Product Type
- 8.1.1. Orthopedics Smart Implants
- 8.1.1.1. Knee Arthroplasty
- 8.1.1.2. Hip Arthroplasty
- 8.1.1.3. Spine Fusion
- 8.1.1.4. Fracture Fixation
- 8.1.1.5. Others
- 8.1.2. Cardiovascular Smart Implants
- 8.1.2.1. Pacing devices
- 8.1.2.2. Stents
- 8.1.2.3. Structural Cardiac Implants
- 8.1.3. Opthalmic Smart Implants
- 8.1.3.1. Intraocular lens
- 8.1.3.2. Glaucoma Implants
- 8.1.4. Dental Smart Implants
- 8.1.5. Cosmetic smart Implants
- 8.1.1. Orthopedics Smart Implants
- 8.2. Market Analysis, Insights and Forecast - by End User
- 8.2.1. Hospitals
- 8.2.2. Ambulatory Surgical Centers
- 8.2.3. Orthopedics Clinics
- 8.2.4. Opthalmic Clinics
- 8.2.5. Dental Labs
- 8.2.6. Others
- 8.1. Market Analysis, Insights and Forecast - by Product Type
- 9. Middle East and Africa Smart Implants Industry Analysis, Insights and Forecast, 2019-2031
- 9.1. Market Analysis, Insights and Forecast - by Product Type
- 9.1.1. Orthopedics Smart Implants
- 9.1.1.1. Knee Arthroplasty
- 9.1.1.2. Hip Arthroplasty
- 9.1.1.3. Spine Fusion
- 9.1.1.4. Fracture Fixation
- 9.1.1.5. Others
- 9.1.2. Cardiovascular Smart Implants
- 9.1.2.1. Pacing devices
- 9.1.2.2. Stents
- 9.1.2.3. Structural Cardiac Implants
- 9.1.3. Opthalmic Smart Implants
- 9.1.3.1. Intraocular lens
- 9.1.3.2. Glaucoma Implants
- 9.1.4. Dental Smart Implants
- 9.1.5. Cosmetic smart Implants
- 9.1.1. Orthopedics Smart Implants
- 9.2. Market Analysis, Insights and Forecast - by End User
- 9.2.1. Hospitals
- 9.2.2. Ambulatory Surgical Centers
- 9.2.3. Orthopedics Clinics
- 9.2.4. Opthalmic Clinics
- 9.2.5. Dental Labs
- 9.2.6. Others
- 9.1. Market Analysis, Insights and Forecast - by Product Type
- 10. South America Smart Implants Industry Analysis, Insights and Forecast, 2019-2031
- 10.1. Market Analysis, Insights and Forecast - by Product Type
- 10.1.1. Orthopedics Smart Implants
- 10.1.1.1. Knee Arthroplasty
- 10.1.1.2. Hip Arthroplasty
- 10.1.1.3. Spine Fusion
- 10.1.1.4. Fracture Fixation
- 10.1.1.5. Others
- 10.1.2. Cardiovascular Smart Implants
- 10.1.2.1. Pacing devices
- 10.1.2.2. Stents
- 10.1.2.3. Structural Cardiac Implants
- 10.1.3. Opthalmic Smart Implants
- 10.1.3.1. Intraocular lens
- 10.1.3.2. Glaucoma Implants
- 10.1.4. Dental Smart Implants
- 10.1.5. Cosmetic smart Implants
- 10.1.1. Orthopedics Smart Implants
- 10.2. Market Analysis, Insights and Forecast - by End User
- 10.2.1. Hospitals
- 10.2.2. Ambulatory Surgical Centers
- 10.2.3. Orthopedics Clinics
- 10.2.4. Opthalmic Clinics
- 10.2.5. Dental Labs
- 10.2.6. Others
- 10.1. Market Analysis, Insights and Forecast - by Product Type
- 11. North America Smart Implants Industry Analysis, Insights and Forecast, 2019-2031
- 11.1. Market Analysis, Insights and Forecast - By Country/Sub-region
- 11.1.1 United States
- 11.1.2 Canada
- 11.1.3 Mexico
- 12. Europe Smart Implants Industry Analysis, Insights and Forecast, 2019-2031
- 12.1. Market Analysis, Insights and Forecast - By Country/Sub-region
- 12.1.1 Germany
- 12.1.2 United Kingdom
- 12.1.3 France
- 12.1.4 Italy
- 12.1.5 Spain
- 12.1.6 Rest of Europe
- 13. Asia Pacific Smart Implants Industry Analysis, Insights and Forecast, 2019-2031
- 13.1. Market Analysis, Insights and Forecast - By Country/Sub-region
- 13.1.1 China
- 13.1.2 Japan
- 13.1.3 India
- 13.1.4 Australia
- 13.1.5 South Korea
- 13.1.6 Rest of Asia Pacific
- 14. Middle East and Africa Smart Implants Industry Analysis, Insights and Forecast, 2019-2031
- 14.1. Market Analysis, Insights and Forecast - By Country/Sub-region
- 14.1.1 GCC
- 14.1.2 South Africa
- 14.1.3 Rest of Middle East and Africa
- 15. South America Smart Implants Industry Analysis, Insights and Forecast, 2019-2031
- 15.1. Market Analysis, Insights and Forecast - By Country/Sub-region
- 15.1.1 Brazil
- 15.1.2 Argentina
- 15.1.3 Rest of South America
- 16. Competitive Analysis
- 16.1. Global Market Share Analysis 2024
- 16.2. Company Profiles
- 16.2.1 CONMED
- 16.2.1.1. Overview
- 16.2.1.2. Products
- 16.2.1.3. SWOT Analysis
- 16.2.1.4. Recent Developments
- 16.2.1.5. Financials (Based on Availability)
- 16.2.2 Canary Medical Inc
- 16.2.2.1. Overview
- 16.2.2.2. Products
- 16.2.2.3. SWOT Analysis
- 16.2.2.4. Recent Developments
- 16.2.2.5. Financials (Based on Availability)
- 16.2.3 Rejoint srl
- 16.2.3.1. Overview
- 16.2.3.2. Products
- 16.2.3.3. SWOT Analysis
- 16.2.3.4. Recent Developments
- 16.2.3.5. Financials (Based on Availability)
- 16.2.4 Medtronic
- 16.2.4.1. Overview
- 16.2.4.2. Products
- 16.2.4.3. SWOT Analysis
- 16.2.4.4. Recent Developments
- 16.2.4.5. Financials (Based on Availability)
- 16.2.5 IQ Implants USA
- 16.2.5.1. Overview
- 16.2.5.2. Products
- 16.2.5.3. SWOT Analysis
- 16.2.5.4. Recent Developments
- 16.2.5.5. Financials (Based on Availability)
- 16.2.6 Stryker
- 16.2.6.1. Overview
- 16.2.6.2. Products
- 16.2.6.3. SWOT Analysis
- 16.2.6.4. Recent Developments
- 16.2.6.5. Financials (Based on Availability)
- 16.2.7 Johnson & Johnson (DePuy Synthes)
- 16.2.7.1. Overview
- 16.2.7.2. Products
- 16.2.7.3. SWOT Analysis
- 16.2.7.4. Recent Developments
- 16.2.7.5. Financials (Based on Availability)
- 16.2.8 Zimmer Biomet
- 16.2.8.1. Overview
- 16.2.8.2. Products
- 16.2.8.3. SWOT Analysis
- 16.2.8.4. Recent Developments
- 16.2.8.5. Financials (Based on Availability)
- 16.2.9 NuVasive Inc
- 16.2.9.1. Overview
- 16.2.9.2. Products
- 16.2.9.3. SWOT Analysis
- 16.2.9.4. Recent Developments
- 16.2.9.5. Financials (Based on Availability)
- 16.2.10 Smart Implant Solutions
- 16.2.10.1. Overview
- 16.2.10.2. Products
- 16.2.10.3. SWOT Analysis
- 16.2.10.4. Recent Developments
- 16.2.10.5. Financials (Based on Availability)
- 16.2.1 CONMED
List of Figures
- Figure 1: Global Smart Implants Industry Revenue Breakdown (Million, %) by Region 2024 & 2032
- Figure 2: North America Smart Implants Industry Revenue (Million), by Country 2024 & 2032
- Figure 3: North America Smart Implants Industry Revenue Share (%), by Country 2024 & 2032
- Figure 4: Europe Smart Implants Industry Revenue (Million), by Country 2024 & 2032
- Figure 5: Europe Smart Implants Industry Revenue Share (%), by Country 2024 & 2032
- Figure 6: Asia Pacific Smart Implants Industry Revenue (Million), by Country 2024 & 2032
- Figure 7: Asia Pacific Smart Implants Industry Revenue Share (%), by Country 2024 & 2032
- Figure 8: Middle East and Africa Smart Implants Industry Revenue (Million), by Country 2024 & 2032
- Figure 9: Middle East and Africa Smart Implants Industry Revenue Share (%), by Country 2024 & 2032
- Figure 10: South America Smart Implants Industry Revenue (Million), by Country 2024 & 2032
- Figure 11: South America Smart Implants Industry Revenue Share (%), by Country 2024 & 2032
- Figure 12: North America Smart Implants Industry Revenue (Million), by Product Type 2024 & 2032
- Figure 13: North America Smart Implants Industry Revenue Share (%), by Product Type 2024 & 2032
- Figure 14: North America Smart Implants Industry Revenue (Million), by End User 2024 & 2032
- Figure 15: North America Smart Implants Industry Revenue Share (%), by End User 2024 & 2032
- Figure 16: North America Smart Implants Industry Revenue (Million), by Country 2024 & 2032
- Figure 17: North America Smart Implants Industry Revenue Share (%), by Country 2024 & 2032
- Figure 18: Europe Smart Implants Industry Revenue (Million), by Product Type 2024 & 2032
- Figure 19: Europe Smart Implants Industry Revenue Share (%), by Product Type 2024 & 2032
- Figure 20: Europe Smart Implants Industry Revenue (Million), by End User 2024 & 2032
- Figure 21: Europe Smart Implants Industry Revenue Share (%), by End User 2024 & 2032
- Figure 22: Europe Smart Implants Industry Revenue (Million), by Country 2024 & 2032
- Figure 23: Europe Smart Implants Industry Revenue Share (%), by Country 2024 & 2032
- Figure 24: Asia Pacific Smart Implants Industry Revenue (Million), by Product Type 2024 & 2032
- Figure 25: Asia Pacific Smart Implants Industry Revenue Share (%), by Product Type 2024 & 2032
- Figure 26: Asia Pacific Smart Implants Industry Revenue (Million), by End User 2024 & 2032
- Figure 27: Asia Pacific Smart Implants Industry Revenue Share (%), by End User 2024 & 2032
- Figure 28: Asia Pacific Smart Implants Industry Revenue (Million), by Country 2024 & 2032
- Figure 29: Asia Pacific Smart Implants Industry Revenue Share (%), by Country 2024 & 2032
- Figure 30: Middle East and Africa Smart Implants Industry Revenue (Million), by Product Type 2024 & 2032
- Figure 31: Middle East and Africa Smart Implants Industry Revenue Share (%), by Product Type 2024 & 2032
- Figure 32: Middle East and Africa Smart Implants Industry Revenue (Million), by End User 2024 & 2032
- Figure 33: Middle East and Africa Smart Implants Industry Revenue Share (%), by End User 2024 & 2032
- Figure 34: Middle East and Africa Smart Implants Industry Revenue (Million), by Country 2024 & 2032
- Figure 35: Middle East and Africa Smart Implants Industry Revenue Share (%), by Country 2024 & 2032
- Figure 36: South America Smart Implants Industry Revenue (Million), by Product Type 2024 & 2032
- Figure 37: South America Smart Implants Industry Revenue Share (%), by Product Type 2024 & 2032
- Figure 38: South America Smart Implants Industry Revenue (Million), by End User 2024 & 2032
- Figure 39: South America Smart Implants Industry Revenue Share (%), by End User 2024 & 2032
- Figure 40: South America Smart Implants Industry Revenue (Million), by Country 2024 & 2032
- Figure 41: South America Smart Implants Industry Revenue Share (%), by Country 2024 & 2032
List of Tables
- Table 1: Global Smart Implants Industry Revenue Million Forecast, by Region 2019 & 2032
- Table 2: Global Smart Implants Industry Revenue Million Forecast, by Product Type 2019 & 2032
- Table 3: Global Smart Implants Industry Revenue Million Forecast, by End User 2019 & 2032
- Table 4: Global Smart Implants Industry Revenue Million Forecast, by Region 2019 & 2032
- Table 5: Global Smart Implants Industry Revenue Million Forecast, by Country 2019 & 2032
- Table 6: United States Smart Implants Industry Revenue (Million) Forecast, by Application 2019 & 2032
- Table 7: Canada Smart Implants Industry Revenue (Million) Forecast, by Application 2019 & 2032
- Table 8: Mexico Smart Implants Industry Revenue (Million) Forecast, by Application 2019 & 2032
- Table 9: Global Smart Implants Industry Revenue Million Forecast, by Country 2019 & 2032
- Table 10: Germany Smart Implants Industry Revenue (Million) Forecast, by Application 2019 & 2032
- Table 11: United Kingdom Smart Implants Industry Revenue (Million) Forecast, by Application 2019 & 2032
- Table 12: France Smart Implants Industry Revenue (Million) Forecast, by Application 2019 & 2032
- Table 13: Italy Smart Implants Industry Revenue (Million) Forecast, by Application 2019 & 2032
- Table 14: Spain Smart Implants Industry Revenue (Million) Forecast, by Application 2019 & 2032
- Table 15: Rest of Europe Smart Implants Industry Revenue (Million) Forecast, by Application 2019 & 2032
- Table 16: Global Smart Implants Industry Revenue Million Forecast, by Country 2019 & 2032
- Table 17: China Smart Implants Industry Revenue (Million) Forecast, by Application 2019 & 2032
- Table 18: Japan Smart Implants Industry Revenue (Million) Forecast, by Application 2019 & 2032
- Table 19: India Smart Implants Industry Revenue (Million) Forecast, by Application 2019 & 2032
- Table 20: Australia Smart Implants Industry Revenue (Million) Forecast, by Application 2019 & 2032
- Table 21: South Korea Smart Implants Industry Revenue (Million) Forecast, by Application 2019 & 2032
- Table 22: Rest of Asia Pacific Smart Implants Industry Revenue (Million) Forecast, by Application 2019 & 2032
- Table 23: Global Smart Implants Industry Revenue Million Forecast, by Country 2019 & 2032
- Table 24: GCC Smart Implants Industry Revenue (Million) Forecast, by Application 2019 & 2032
- Table 25: South Africa Smart Implants Industry Revenue (Million) Forecast, by Application 2019 & 2032
- Table 26: Rest of Middle East and Africa Smart Implants Industry Revenue (Million) Forecast, by Application 2019 & 2032
- Table 27: Global Smart Implants Industry Revenue Million Forecast, by Country 2019 & 2032
- Table 28: Brazil Smart Implants Industry Revenue (Million) Forecast, by Application 2019 & 2032
- Table 29: Argentina Smart Implants Industry Revenue (Million) Forecast, by Application 2019 & 2032
- Table 30: Rest of South America Smart Implants Industry Revenue (Million) Forecast, by Application 2019 & 2032
- Table 31: Global Smart Implants Industry Revenue Million Forecast, by Product Type 2019 & 2032
- Table 32: Global Smart Implants Industry Revenue Million Forecast, by End User 2019 & 2032
- Table 33: Global Smart Implants Industry Revenue Million Forecast, by Country 2019 & 2032
- Table 34: United States Smart Implants Industry Revenue (Million) Forecast, by Application 2019 & 2032
- Table 35: Canada Smart Implants Industry Revenue (Million) Forecast, by Application 2019 & 2032
- Table 36: Mexico Smart Implants Industry Revenue (Million) Forecast, by Application 2019 & 2032
- Table 37: Global Smart Implants Industry Revenue Million Forecast, by Product Type 2019 & 2032
- Table 38: Global Smart Implants Industry Revenue Million Forecast, by End User 2019 & 2032
- Table 39: Global Smart Implants Industry Revenue Million Forecast, by Country 2019 & 2032
- Table 40: Germany Smart Implants Industry Revenue (Million) Forecast, by Application 2019 & 2032
- Table 41: United Kingdom Smart Implants Industry Revenue (Million) Forecast, by Application 2019 & 2032
- Table 42: France Smart Implants Industry Revenue (Million) Forecast, by Application 2019 & 2032
- Table 43: Italy Smart Implants Industry Revenue (Million) Forecast, by Application 2019 & 2032
- Table 44: Spain Smart Implants Industry Revenue (Million) Forecast, by Application 2019 & 2032
- Table 45: Rest of Europe Smart Implants Industry Revenue (Million) Forecast, by Application 2019 & 2032
- Table 46: Global Smart Implants Industry Revenue Million Forecast, by Product Type 2019 & 2032
- Table 47: Global Smart Implants Industry Revenue Million Forecast, by End User 2019 & 2032
- Table 48: Global Smart Implants Industry Revenue Million Forecast, by Country 2019 & 2032
- Table 49: China Smart Implants Industry Revenue (Million) Forecast, by Application 2019 & 2032
- Table 50: Japan Smart Implants Industry Revenue (Million) Forecast, by Application 2019 & 2032
- Table 51: India Smart Implants Industry Revenue (Million) Forecast, by Application 2019 & 2032
- Table 52: Australia Smart Implants Industry Revenue (Million) Forecast, by Application 2019 & 2032
- Table 53: South Korea Smart Implants Industry Revenue (Million) Forecast, by Application 2019 & 2032
- Table 54: Rest of Asia Pacific Smart Implants Industry Revenue (Million) Forecast, by Application 2019 & 2032
- Table 55: Global Smart Implants Industry Revenue Million Forecast, by Product Type 2019 & 2032
- Table 56: Global Smart Implants Industry Revenue Million Forecast, by End User 2019 & 2032
- Table 57: Global Smart Implants Industry Revenue Million Forecast, by Country 2019 & 2032
- Table 58: GCC Smart Implants Industry Revenue (Million) Forecast, by Application 2019 & 2032
- Table 59: South Africa Smart Implants Industry Revenue (Million) Forecast, by Application 2019 & 2032
- Table 60: Rest of Middle East and Africa Smart Implants Industry Revenue (Million) Forecast, by Application 2019 & 2032
- Table 61: Global Smart Implants Industry Revenue Million Forecast, by Product Type 2019 & 2032
- Table 62: Global Smart Implants Industry Revenue Million Forecast, by End User 2019 & 2032
- Table 63: Global Smart Implants Industry Revenue Million Forecast, by Country 2019 & 2032
- Table 64: Brazil Smart Implants Industry Revenue (Million) Forecast, by Application 2019 & 2032
- Table 65: Argentina Smart Implants Industry Revenue (Million) Forecast, by Application 2019 & 2032
- Table 66: Rest of South America Smart Implants Industry Revenue (Million) Forecast, by Application 2019 & 2032
Frequently Asked Questions
1. What is the projected Compound Annual Growth Rate (CAGR) of the Smart Implants Industry?
The projected CAGR is approximately 19.20%.
2. Which companies are prominent players in the Smart Implants Industry?
Key companies in the market include CONMED, Canary Medical Inc, Rejoint srl, Medtronic, IQ Implants USA, Stryker, Johnson & Johnson (DePuy Synthes), Zimmer Biomet, NuVasive Inc, Smart Implant Solutions.
3. What are the main segments of the Smart Implants Industry?
The market segments include Product Type, End User.
4. Can you provide details about the market size?
The market size is estimated to be USD 5.38 Million as of 2022.
5. What are some drivers contributing to market growth?
Increase in the Geriatric Population with Various Chronic Disorder; Rising Incidence of Accidents and Sport Injuries; Technological Advancements in the Field of Smart Implants.
6. What are the notable trends driving market growth?
Orthopedic Smart Implants Segment is Expected to Witness high Growth Over the Forecast Period.
7. Are there any restraints impacting market growth?
Stringent Regulatory Framework.
8. Can you provide examples of recent developments in the market?
N/A
9. What pricing options are available for accessing the report?
Pricing options include single-user, multi-user, and enterprise licenses priced at USD 4750, USD 5250, and USD 8750 respectively.
10. Is the market size provided in terms of value or volume?
The market size is provided in terms of value, measured in Million.
11. Are there any specific market keywords associated with the report?
Yes, the market keyword associated with the report is "Smart Implants Industry," which aids in identifying and referencing the specific market segment covered.
12. How do I determine which pricing option suits my needs best?
The pricing options vary based on user requirements and access needs. Individual users may opt for single-user licenses, while businesses requiring broader access may choose multi-user or enterprise licenses for cost-effective access to the report.
13. Are there any additional resources or data provided in the Smart Implants Industry report?
While the report offers comprehensive insights, it's advisable to review the specific contents or supplementary materials provided to ascertain if additional resources or data are available.
14. How can I stay updated on further developments or reports in the Smart Implants Industry?
To stay informed about further developments, trends, and reports in the Smart Implants Industry, consider subscribing to industry newsletters, following relevant companies and organizations, or regularly checking reputable industry news sources and publications.
Methodology
Step 1 - Identification of Relevant Samples Size from Population Database


Step 2 - Approaches for Defining Global Market Size (Value, Volume* & Price*)

Note*: In applicable scenarios
Step 3 - Data Sources
Primary Research
- Web Analytics
- Survey Reports
- Research Institute
- Latest Research Reports
- Opinion Leaders
Secondary Research
- Annual Reports
- White Paper
- Latest Press Release
- Industry Association
- Paid Database
- Investor Presentations

Step 4 - Data Triangulation
Involves using different sources of information in order to increase the validity of a study
These sources are likely to be stakeholders in a program - participants, other researchers, program staff, other community members, and so on.
Then we put all data in single framework & apply various statistical tools to find out the dynamic on the market.
During the analysis stage, feedback from the stakeholder groups would be compared to determine areas of agreement as well as areas of divergence
