

Key Insights
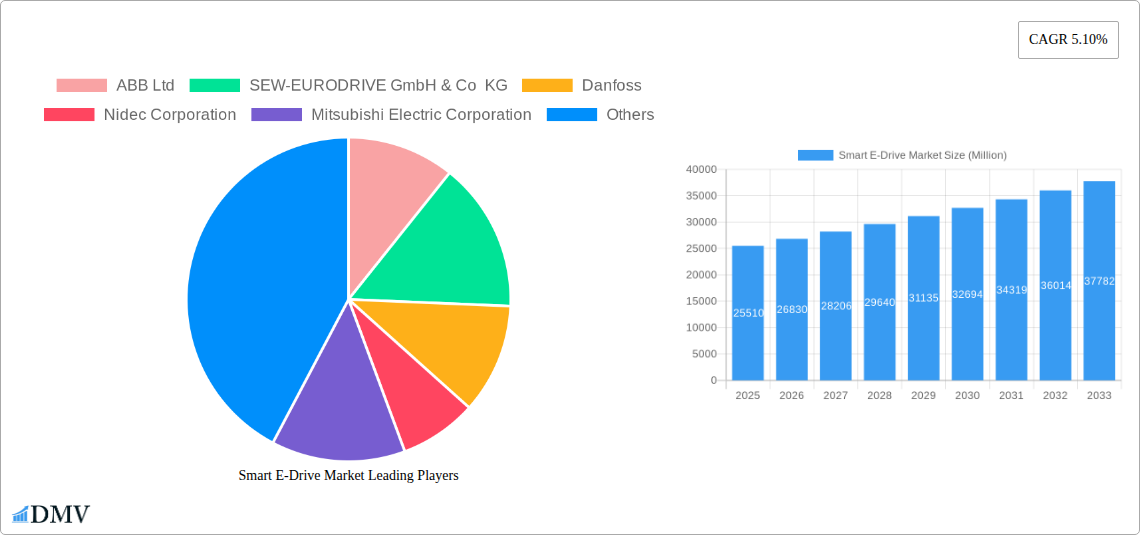
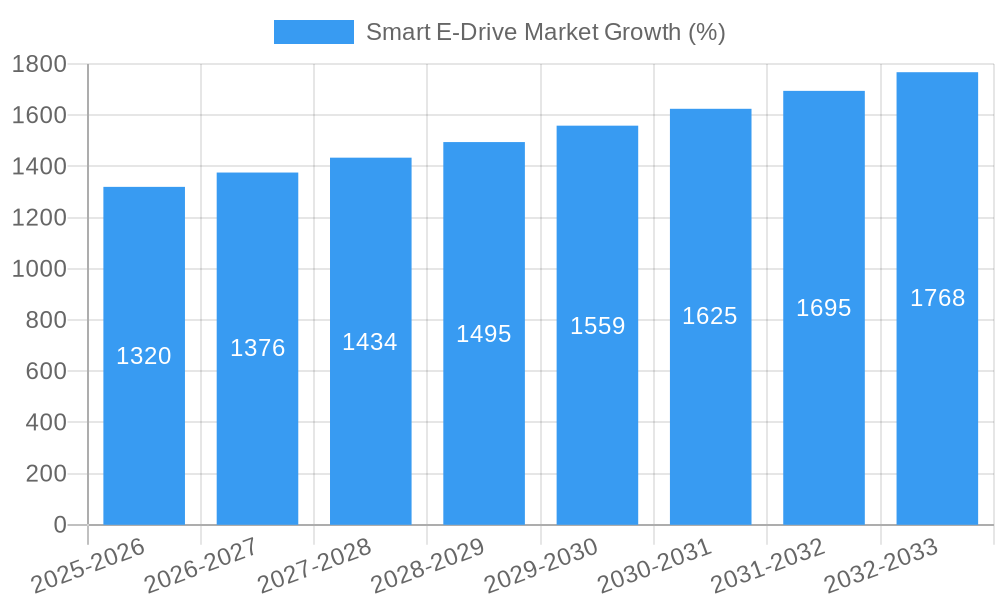
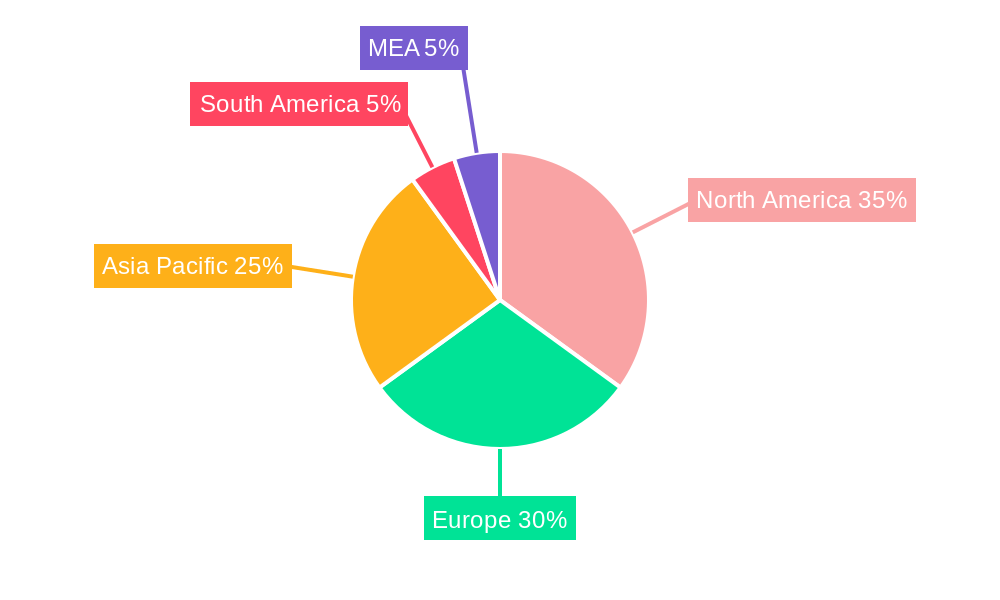
The global smart e-drive market, valued at $25.51 billion in 2025, is projected to experience robust growth, driven by the increasing adoption of automation and digitization across various industries. A compound annual growth rate (CAGR) of 5.10% from 2025 to 2033 indicates a significant market expansion. Key drivers include the rising demand for energy-efficient solutions, the increasing need for precise motion control in industrial automation, and the growing adoption of smart grids and renewable energy sources. The market is segmented by power rating (with 500 kW being a significant segment), end-user industry (oil and gas, water and wastewater, chemical and petrochemical, food and beverage, power generation, HVAC, pulp and paper, discrete industries, and others), and product type (AC drives, DC drives, and servo drives). Leading players like ABB, SEW-EURODRIVE, Danfoss, and others are strategically investing in R&D and expanding their product portfolios to cater to the growing demand. The North American and European markets currently hold significant shares, but the Asia-Pacific region is expected to witness substantial growth in the coming years due to rapid industrialization and infrastructure development.
The sustained growth in the smart e-drive market is further fueled by advancements in power electronics, the development of more efficient and reliable drive systems, and the integration of advanced control algorithms and communication protocols. Challenges such as the high initial investment costs associated with implementing smart e-drive systems and the need for skilled workforce to operate and maintain these advanced systems pose some restraints. However, the long-term benefits of energy savings, improved efficiency, and enhanced operational flexibility outweigh these challenges, leading to continued market expansion across various sectors. The forecast period of 2025-2033 promises significant opportunities for both established players and new entrants to capitalize on the growing demand for advanced, energy-efficient, and smart drive solutions.
Smart E-Drive Market: A Comprehensive Report (2019-2033)
This insightful report provides a detailed analysis of the Smart E-Drive Market, encompassing market trends, technological advancements, key players, and future growth projections. We delve into the dynamics shaping this crucial sector, examining the impact of industry developments and providing a robust forecast to guide strategic decision-making. The study period covers 2019-2033, with 2025 as the base and estimated year.
Smart E-Drive Market Composition & Trends
The Smart E-Drive Market is experiencing significant growth driven by increasing automation across diverse end-user industries. Market concentration is moderate, with key players such as ABB Ltd, SEW-EURODRIVE GmbH & Co KG, and Danfoss holding substantial market share. Innovation is spurred by the demand for energy-efficient, high-performance drives, leading to continuous product improvements and the integration of smart technologies like IoT and AI. Regulatory landscapes, particularly concerning energy efficiency standards, are influencing market dynamics. Substitute products, such as hydraulic and pneumatic systems, are facing increasing competition due to the advantages of smart e-drives in terms of precision and control. Mergers and acquisitions (M&A) activity is significant, with deal values exceeding xx Million in the last five years, shaping the competitive landscape. End-user profiles reveal a strong demand from sectors like Oil and Gas, Water and Wastewater, and Chemical and Petrochemical industries.
- Market Share Distribution (2024): ABB Ltd (xx%), SEW-EURODRIVE (xx%), Danfoss (xx%), Others (xx%)
- M&A Deal Value (2019-2024): xx Million
- Key Innovation Catalysts: IoT integration, AI-powered predictive maintenance, energy efficiency improvements.
- Regulatory Landscape: Stringent energy efficiency standards driving innovation and adoption.
Smart E-Drive Market Industry Evolution
The Smart E-Drive Market has witnessed consistent growth throughout the historical period (2019-2024), with a Compound Annual Growth Rate (CAGR) of xx%. This growth is attributed to several factors, including the increasing adoption of automation across various industries, rising demand for energy-efficient solutions, and technological advancements such as the development of more efficient and reliable drives. Consumer demands are shifting towards higher precision, enhanced control, and improved energy efficiency, which drives innovation and product development. The market is expected to continue its growth trajectory during the forecast period (2025-2033), with a projected CAGR of xx%, fueled by the expanding adoption of smart e-drives in emerging applications and industries. The integration of advanced technologies like artificial intelligence and the Internet of Things (IoT) is further accelerating market expansion. Specific data points for growth rates and adoption metrics vary by product type and end-user industry, with the 500 KW power rating segment demonstrating particularly strong growth. Further analysis reveals a shift towards higher power rating drives to meet the demand for heavy industrial applications.
Leading Regions, Countries, or Segments in Smart E-Drive Market
The Smart E-Drive Market is experiencing significant growth across various regions, countries, and segments. However, North America currently holds the largest market share, driven primarily by strong demand from the Oil and Gas, and Chemical and Petrochemical sectors. The 500 KW power rating segment also shows remarkable traction, reflecting a preference for high-capacity drives across applications. Furthermore, the AC Drives segment currently dominates the product landscape, showcasing its versatility and wide-ranging application.
- Key Drivers in North America:
- High levels of automation in various industries.
- Significant investments in infrastructure modernization projects.
- Stringent government regulations promoting energy efficiency.
- Dominance Factors:
- Established industrial base with substantial automation needs.
- High adoption rate of advanced technologies.
- Favorable regulatory environment promoting sustainable solutions.
Smart E-Drive Market Product Innovations
Recent innovations in smart e-drives focus on enhanced energy efficiency, improved control precision, and compact designs. This includes advancements in power semiconductor technology, enabling higher efficiency and power density. Moreover, the integration of advanced control algorithms and smart sensors facilitates predictive maintenance and optimizes operational efficiency. These innovations are enhancing the reliability and performance of smart e-drives, making them more attractive to a wider range of applications and industries. Unique selling propositions include remote diagnostics and proactive maintenance capabilities.
Propelling Factors for Smart E-Drive Market Growth
Technological advancements, economic factors, and supportive government regulations are key drivers of the Smart E-Drive market's growth. The development of more efficient power semiconductor devices, coupled with the integration of advanced control algorithms and AI, has led to significant performance improvements in smart e-drives. The rising cost of energy is also encouraging the adoption of energy-efficient drives, contributing to significant market expansion. Further, government incentives aimed at promoting energy efficiency and sustainable technologies are further boosting market growth.
Obstacles in the Smart E-Drive Market
Several factors hinder the growth of the Smart E-Drive Market. These include supply chain disruptions impacting the availability of crucial components, intense competition leading to price pressures, and regulatory challenges related to safety and compliance standards. These factors can lead to project delays, increased costs, and reduced profitability for market participants. Quantifiable impacts are seen in fluctuating production volumes and margins.
Future Opportunities in Smart E-Drive Market
The Smart E-Drive Market presents several exciting opportunities. The expansion into new and emerging markets, like renewable energy and electric vehicles, promises substantial growth. Further technological advancements, such as the development of more compact and higher-efficiency drives, will open up new application areas. Changes in consumer preference towards more sustainable and efficient solutions also contribute to positive market outlook.
Major Players in the Smart E-Drive Market Ecosystem
- ABB Ltd
- SEW-EURODRIVE GmbH & Co KG
- Danfoss
- Nidec Corporation
- Mitsubishi Electric Corporation
- Siemens AG
- Schneider Electric SE
- TMEIC Corporation
- Rockwell Automation Inc
- Yaskawa Electric Corporation
Key Developments in Smart E-Drive Market Industry
- May 2023: Yaskawa Europe's relocation to Hattersheim, Germany, represents a significant investment (USD 24.57 Million) in expanding its European operations and signifies growing market demand.
- February 2023: Nidec-Shimpo Corporation's expansion of its drive module product line for AGVs and AMRs to include DC and 24V modules broadens its market reach and caters to diverse automation needs.
Strategic Smart E-Drive Market Forecast
The Smart E-Drive Market is poised for sustained growth, driven by technological advancements, increasing automation across industries, and the growing demand for energy-efficient solutions. The market's future potential is substantial, particularly in emerging applications and geographical regions. Continued innovation and strategic partnerships will be crucial for companies seeking to capitalize on the market's opportunities.
Smart E-Drive Market Segmentation
-
1. Product
- 1.1. AC Drives
- 1.2. DC Drives
- 1.3. Servo Drives
-
2. Voltage
-
2.1. Low-Voltage Drive (<372.8KW or <1KV)
- 2.1.1. Embedded
- 2.1.2. Standalone
- 2.2. Medium-Voltage Drive (>=372.8KW or >= 1KW)
-
2.1. Low-Voltage Drive (<372.8KW or <1KV)
-
3. Power Rating Statistics
- 3.1. <250 KW
- 3.2. 251 - 500 KW
- 3.3. >500 KW
-
4. End-user Industry
- 4.1. Oil and Gas
- 4.2. Water and Wastewater
- 4.3. Chemical and Petrochemical
- 4.4. Food and Beverage
- 4.5. Power Generation
- 4.6. HVAC
- 4.7. Pulp and Paper
- 4.8. Discrete Industries
- 4.9. Other End-user Industries
Smart E-Drive Market Segmentation By Geography
-
1. North America
- 1.1. United States
- 1.2. Canada
-
2. Europe
- 2.1. Germany
- 2.2. Italy
- 2.3. United Kingdom
- 2.4. France
- 2.5. Rest of Europe
-
3. Asia Pacific
- 3.1. China
- 3.2. Japan
- 3.3. India
- 3.4. South Korea
- 3.5. Rest of Asia Pacific
-
4. Latin America
- 4.1. Brazil
- 4.2. Mexico
- 4.3. Rest of Latin America
-
5. Middle East and Africa
- 5.1. United Arab Emirates
- 5.2. Saudi Arabia
- 5.3. Turkey
- 5.4. Rest of Middle East and Africa
Smart E-Drive Market REPORT HIGHLIGHTS
| Aspects | Details |
|---|---|
| Study Period | 2019-2033 |
| Base Year | 2024 |
| Estimated Year | 2025 |
| Forecast Period | 2025-2033 |
| Historical Period | 2019-2024 |
| Growth Rate | CAGR of 5.10% from 2019-2033 |
| Segmentation |
|
Table of Contents
- 1. Introduction
- 1.1. Research Scope
- 1.2. Market Segmentation
- 1.3. Research Methodology
- 1.4. Definitions and Assumptions
- 2. Executive Summary
- 2.1. Introduction
- 3. Market Dynamics
- 3.1. Introduction
- 3.2. Market Drivers
- 3.2.1. Rapid Industrialization and Increased use of Electric Drives Across Major Vertical Industries; Growing Demand for Energy Efficiency
- 3.3. Market Restrains
- 3.3.1. Technical Concerns of the Equipment; High Cost of the Equipment
- 3.4. Market Trends
- 3.4.1. Power Generation to be the Major End-user Industry
- 4. Market Factor Analysis
- 4.1. Porters Five Forces
- 4.2. Supply/Value Chain
- 4.3. PESTEL analysis
- 4.4. Market Entropy
- 4.5. Patent/Trademark Analysis
- 5. Global Smart E-Drive Market Analysis, Insights and Forecast, 2019-2031
- 5.1. Market Analysis, Insights and Forecast - by Product
- 5.1.1. AC Drives
- 5.1.2. DC Drives
- 5.1.3. Servo Drives
- 5.2. Market Analysis, Insights and Forecast - by Voltage
- 5.2.1. Low-Voltage Drive (<372.8KW or <1KV)
- 5.2.1.1. Embedded
- 5.2.1.2. Standalone
- 5.2.2. Medium-Voltage Drive (>=372.8KW or >= 1KW)
- 5.2.1. Low-Voltage Drive (<372.8KW or <1KV)
- 5.3. Market Analysis, Insights and Forecast - by Power Rating Statistics
- 5.3.1. <250 KW
- 5.3.2. 251 - 500 KW
- 5.3.3. >500 KW
- 5.4. Market Analysis, Insights and Forecast - by End-user Industry
- 5.4.1. Oil and Gas
- 5.4.2. Water and Wastewater
- 5.4.3. Chemical and Petrochemical
- 5.4.4. Food and Beverage
- 5.4.5. Power Generation
- 5.4.6. HVAC
- 5.4.7. Pulp and Paper
- 5.4.8. Discrete Industries
- 5.4.9. Other End-user Industries
- 5.5. Market Analysis, Insights and Forecast - by Region
- 5.5.1. North America
- 5.5.2. Europe
- 5.5.3. Asia Pacific
- 5.5.4. Latin America
- 5.5.5. Middle East and Africa
- 5.1. Market Analysis, Insights and Forecast - by Product
- 6. North America Smart E-Drive Market Analysis, Insights and Forecast, 2019-2031
- 6.1. Market Analysis, Insights and Forecast - by Product
- 6.1.1. AC Drives
- 6.1.2. DC Drives
- 6.1.3. Servo Drives
- 6.2. Market Analysis, Insights and Forecast - by Voltage
- 6.2.1. Low-Voltage Drive (<372.8KW or <1KV)
- 6.2.1.1. Embedded
- 6.2.1.2. Standalone
- 6.2.2. Medium-Voltage Drive (>=372.8KW or >= 1KW)
- 6.2.1. Low-Voltage Drive (<372.8KW or <1KV)
- 6.3. Market Analysis, Insights and Forecast - by Power Rating Statistics
- 6.3.1. <250 KW
- 6.3.2. 251 - 500 KW
- 6.3.3. >500 KW
- 6.4. Market Analysis, Insights and Forecast - by End-user Industry
- 6.4.1. Oil and Gas
- 6.4.2. Water and Wastewater
- 6.4.3. Chemical and Petrochemical
- 6.4.4. Food and Beverage
- 6.4.5. Power Generation
- 6.4.6. HVAC
- 6.4.7. Pulp and Paper
- 6.4.8. Discrete Industries
- 6.4.9. Other End-user Industries
- 6.1. Market Analysis, Insights and Forecast - by Product
- 7. Europe Smart E-Drive Market Analysis, Insights and Forecast, 2019-2031
- 7.1. Market Analysis, Insights and Forecast - by Product
- 7.1.1. AC Drives
- 7.1.2. DC Drives
- 7.1.3. Servo Drives
- 7.2. Market Analysis, Insights and Forecast - by Voltage
- 7.2.1. Low-Voltage Drive (<372.8KW or <1KV)
- 7.2.1.1. Embedded
- 7.2.1.2. Standalone
- 7.2.2. Medium-Voltage Drive (>=372.8KW or >= 1KW)
- 7.2.1. Low-Voltage Drive (<372.8KW or <1KV)
- 7.3. Market Analysis, Insights and Forecast - by Power Rating Statistics
- 7.3.1. <250 KW
- 7.3.2. 251 - 500 KW
- 7.3.3. >500 KW
- 7.4. Market Analysis, Insights and Forecast - by End-user Industry
- 7.4.1. Oil and Gas
- 7.4.2. Water and Wastewater
- 7.4.3. Chemical and Petrochemical
- 7.4.4. Food and Beverage
- 7.4.5. Power Generation
- 7.4.6. HVAC
- 7.4.7. Pulp and Paper
- 7.4.8. Discrete Industries
- 7.4.9. Other End-user Industries
- 7.1. Market Analysis, Insights and Forecast - by Product
- 8. Asia Pacific Smart E-Drive Market Analysis, Insights and Forecast, 2019-2031
- 8.1. Market Analysis, Insights and Forecast - by Product
- 8.1.1. AC Drives
- 8.1.2. DC Drives
- 8.1.3. Servo Drives
- 8.2. Market Analysis, Insights and Forecast - by Voltage
- 8.2.1. Low-Voltage Drive (<372.8KW or <1KV)
- 8.2.1.1. Embedded
- 8.2.1.2. Standalone
- 8.2.2. Medium-Voltage Drive (>=372.8KW or >= 1KW)
- 8.2.1. Low-Voltage Drive (<372.8KW or <1KV)
- 8.3. Market Analysis, Insights and Forecast - by Power Rating Statistics
- 8.3.1. <250 KW
- 8.3.2. 251 - 500 KW
- 8.3.3. >500 KW
- 8.4. Market Analysis, Insights and Forecast - by End-user Industry
- 8.4.1. Oil and Gas
- 8.4.2. Water and Wastewater
- 8.4.3. Chemical and Petrochemical
- 8.4.4. Food and Beverage
- 8.4.5. Power Generation
- 8.4.6. HVAC
- 8.4.7. Pulp and Paper
- 8.4.8. Discrete Industries
- 8.4.9. Other End-user Industries
- 8.1. Market Analysis, Insights and Forecast - by Product
- 9. Latin America Smart E-Drive Market Analysis, Insights and Forecast, 2019-2031
- 9.1. Market Analysis, Insights and Forecast - by Product
- 9.1.1. AC Drives
- 9.1.2. DC Drives
- 9.1.3. Servo Drives
- 9.2. Market Analysis, Insights and Forecast - by Voltage
- 9.2.1. Low-Voltage Drive (<372.8KW or <1KV)
- 9.2.1.1. Embedded
- 9.2.1.2. Standalone
- 9.2.2. Medium-Voltage Drive (>=372.8KW or >= 1KW)
- 9.2.1. Low-Voltage Drive (<372.8KW or <1KV)
- 9.3. Market Analysis, Insights and Forecast - by Power Rating Statistics
- 9.3.1. <250 KW
- 9.3.2. 251 - 500 KW
- 9.3.3. >500 KW
- 9.4. Market Analysis, Insights and Forecast - by End-user Industry
- 9.4.1. Oil and Gas
- 9.4.2. Water and Wastewater
- 9.4.3. Chemical and Petrochemical
- 9.4.4. Food and Beverage
- 9.4.5. Power Generation
- 9.4.6. HVAC
- 9.4.7. Pulp and Paper
- 9.4.8. Discrete Industries
- 9.4.9. Other End-user Industries
- 9.1. Market Analysis, Insights and Forecast - by Product
- 10. Middle East and Africa Smart E-Drive Market Analysis, Insights and Forecast, 2019-2031
- 10.1. Market Analysis, Insights and Forecast - by Product
- 10.1.1. AC Drives
- 10.1.2. DC Drives
- 10.1.3. Servo Drives
- 10.2. Market Analysis, Insights and Forecast - by Voltage
- 10.2.1. Low-Voltage Drive (<372.8KW or <1KV)
- 10.2.1.1. Embedded
- 10.2.1.2. Standalone
- 10.2.2. Medium-Voltage Drive (>=372.8KW or >= 1KW)
- 10.2.1. Low-Voltage Drive (<372.8KW or <1KV)
- 10.3. Market Analysis, Insights and Forecast - by Power Rating Statistics
- 10.3.1. <250 KW
- 10.3.2. 251 - 500 KW
- 10.3.3. >500 KW
- 10.4. Market Analysis, Insights and Forecast - by End-user Industry
- 10.4.1. Oil and Gas
- 10.4.2. Water and Wastewater
- 10.4.3. Chemical and Petrochemical
- 10.4.4. Food and Beverage
- 10.4.5. Power Generation
- 10.4.6. HVAC
- 10.4.7. Pulp and Paper
- 10.4.8. Discrete Industries
- 10.4.9. Other End-user Industries
- 10.1. Market Analysis, Insights and Forecast - by Product
- 11. North America Smart E-Drive Market Analysis, Insights and Forecast, 2019-2031
- 11.1. Market Analysis, Insights and Forecast - By Country/Sub-region
- 11.1.1. undefined
- 12. Europe Smart E-Drive Market Analysis, Insights and Forecast, 2019-2031
- 12.1. Market Analysis, Insights and Forecast - By Country/Sub-region
- 12.1.1. undefined
- 13. Asia Pacific Smart E-Drive Market Analysis, Insights and Forecast, 2019-2031
- 13.1. Market Analysis, Insights and Forecast - By Country/Sub-region
- 13.1.1. undefined
- 14. South America Smart E-Drive Market Analysis, Insights and Forecast, 2019-2031
- 14.1. Market Analysis, Insights and Forecast - By Country/Sub-region
- 14.1.1. undefined
- 15. North America Smart E-Drive Market Analysis, Insights and Forecast, 2019-2031
- 15.1. Market Analysis, Insights and Forecast - By Country/Sub-region
- 15.1.1. undefined
- 16. MEA Smart E-Drive Market Analysis, Insights and Forecast, 2019-2031
- 16.1. Market Analysis, Insights and Forecast - By Country/Sub-region
- 16.1.1. undefined
- 17. Competitive Analysis
- 17.1. Global Market Share Analysis 2024
- 17.2. Company Profiles
- 17.2.1 ABB Ltd
- 17.2.1.1. Overview
- 17.2.1.2. Products
- 17.2.1.3. SWOT Analysis
- 17.2.1.4. Recent Developments
- 17.2.1.5. Financials (Based on Availability)
- 17.2.2 SEW-EURODRIVE GmbH & Co KG
- 17.2.2.1. Overview
- 17.2.2.2. Products
- 17.2.2.3. SWOT Analysis
- 17.2.2.4. Recent Developments
- 17.2.2.5. Financials (Based on Availability)
- 17.2.3 Danfoss
- 17.2.3.1. Overview
- 17.2.3.2. Products
- 17.2.3.3. SWOT Analysis
- 17.2.3.4. Recent Developments
- 17.2.3.5. Financials (Based on Availability)
- 17.2.4 Nidec Corporation
- 17.2.4.1. Overview
- 17.2.4.2. Products
- 17.2.4.3. SWOT Analysis
- 17.2.4.4. Recent Developments
- 17.2.4.5. Financials (Based on Availability)
- 17.2.5 Mitsubishi Electric Corporation
- 17.2.5.1. Overview
- 17.2.5.2. Products
- 17.2.5.3. SWOT Analysis
- 17.2.5.4. Recent Developments
- 17.2.5.5. Financials (Based on Availability)
- 17.2.6 Siemens AG
- 17.2.6.1. Overview
- 17.2.6.2. Products
- 17.2.6.3. SWOT Analysis
- 17.2.6.4. Recent Developments
- 17.2.6.5. Financials (Based on Availability)
- 17.2.7 Schneider Electric SE
- 17.2.7.1. Overview
- 17.2.7.2. Products
- 17.2.7.3. SWOT Analysis
- 17.2.7.4. Recent Developments
- 17.2.7.5. Financials (Based on Availability)
- 17.2.8 TMEIC Corporation
- 17.2.8.1. Overview
- 17.2.8.2. Products
- 17.2.8.3. SWOT Analysis
- 17.2.8.4. Recent Developments
- 17.2.8.5. Financials (Based on Availability)
- 17.2.9 Rockwell Automation Inc
- 17.2.9.1. Overview
- 17.2.9.2. Products
- 17.2.9.3. SWOT Analysis
- 17.2.9.4. Recent Developments
- 17.2.9.5. Financials (Based on Availability)
- 17.2.10 Yaskawa Electric Corporation
- 17.2.10.1. Overview
- 17.2.10.2. Products
- 17.2.10.3. SWOT Analysis
- 17.2.10.4. Recent Developments
- 17.2.10.5. Financials (Based on Availability)
- 17.2.1 ABB Ltd
List of Figures
- Figure 1: Global Smart E-Drive Market Revenue Breakdown (Million, %) by Region 2024 & 2032
- Figure 2: Global Smart E-Drive Market Volume Breakdown (K Unit, %) by Region 2024 & 2032
- Figure 3: North America Smart E-Drive Market Revenue (Million), by Country 2024 & 2032
- Figure 4: North America Smart E-Drive Market Volume (K Unit), by Country 2024 & 2032
- Figure 5: North America Smart E-Drive Market Revenue Share (%), by Country 2024 & 2032
- Figure 6: North America Smart E-Drive Market Volume Share (%), by Country 2024 & 2032
- Figure 7: Europe Smart E-Drive Market Revenue (Million), by Country 2024 & 2032
- Figure 8: Europe Smart E-Drive Market Volume (K Unit), by Country 2024 & 2032
- Figure 9: Europe Smart E-Drive Market Revenue Share (%), by Country 2024 & 2032
- Figure 10: Europe Smart E-Drive Market Volume Share (%), by Country 2024 & 2032
- Figure 11: Asia Pacific Smart E-Drive Market Revenue (Million), by Country 2024 & 2032
- Figure 12: Asia Pacific Smart E-Drive Market Volume (K Unit), by Country 2024 & 2032
- Figure 13: Asia Pacific Smart E-Drive Market Revenue Share (%), by Country 2024 & 2032
- Figure 14: Asia Pacific Smart E-Drive Market Volume Share (%), by Country 2024 & 2032
- Figure 15: South America Smart E-Drive Market Revenue (Million), by Country 2024 & 2032
- Figure 16: South America Smart E-Drive Market Volume (K Unit), by Country 2024 & 2032
- Figure 17: South America Smart E-Drive Market Revenue Share (%), by Country 2024 & 2032
- Figure 18: South America Smart E-Drive Market Volume Share (%), by Country 2024 & 2032
- Figure 19: North America Smart E-Drive Market Revenue (Million), by Country 2024 & 2032
- Figure 20: North America Smart E-Drive Market Volume (K Unit), by Country 2024 & 2032
- Figure 21: North America Smart E-Drive Market Revenue Share (%), by Country 2024 & 2032
- Figure 22: North America Smart E-Drive Market Volume Share (%), by Country 2024 & 2032
- Figure 23: MEA Smart E-Drive Market Revenue (Million), by Country 2024 & 2032
- Figure 24: MEA Smart E-Drive Market Volume (K Unit), by Country 2024 & 2032
- Figure 25: MEA Smart E-Drive Market Revenue Share (%), by Country 2024 & 2032
- Figure 26: MEA Smart E-Drive Market Volume Share (%), by Country 2024 & 2032
- Figure 27: North America Smart E-Drive Market Revenue (Million), by Product 2024 & 2032
- Figure 28: North America Smart E-Drive Market Volume (K Unit), by Product 2024 & 2032
- Figure 29: North America Smart E-Drive Market Revenue Share (%), by Product 2024 & 2032
- Figure 30: North America Smart E-Drive Market Volume Share (%), by Product 2024 & 2032
- Figure 31: North America Smart E-Drive Market Revenue (Million), by Voltage 2024 & 2032
- Figure 32: North America Smart E-Drive Market Volume (K Unit), by Voltage 2024 & 2032
- Figure 33: North America Smart E-Drive Market Revenue Share (%), by Voltage 2024 & 2032
- Figure 34: North America Smart E-Drive Market Volume Share (%), by Voltage 2024 & 2032
- Figure 35: North America Smart E-Drive Market Revenue (Million), by Power Rating Statistics 2024 & 2032
- Figure 36: North America Smart E-Drive Market Volume (K Unit), by Power Rating Statistics 2024 & 2032
- Figure 37: North America Smart E-Drive Market Revenue Share (%), by Power Rating Statistics 2024 & 2032
- Figure 38: North America Smart E-Drive Market Volume Share (%), by Power Rating Statistics 2024 & 2032
- Figure 39: North America Smart E-Drive Market Revenue (Million), by End-user Industry 2024 & 2032
- Figure 40: North America Smart E-Drive Market Volume (K Unit), by End-user Industry 2024 & 2032
- Figure 41: North America Smart E-Drive Market Revenue Share (%), by End-user Industry 2024 & 2032
- Figure 42: North America Smart E-Drive Market Volume Share (%), by End-user Industry 2024 & 2032
- Figure 43: North America Smart E-Drive Market Revenue (Million), by Country 2024 & 2032
- Figure 44: North America Smart E-Drive Market Volume (K Unit), by Country 2024 & 2032
- Figure 45: North America Smart E-Drive Market Revenue Share (%), by Country 2024 & 2032
- Figure 46: North America Smart E-Drive Market Volume Share (%), by Country 2024 & 2032
- Figure 47: Europe Smart E-Drive Market Revenue (Million), by Product 2024 & 2032
- Figure 48: Europe Smart E-Drive Market Volume (K Unit), by Product 2024 & 2032
- Figure 49: Europe Smart E-Drive Market Revenue Share (%), by Product 2024 & 2032
- Figure 50: Europe Smart E-Drive Market Volume Share (%), by Product 2024 & 2032
- Figure 51: Europe Smart E-Drive Market Revenue (Million), by Voltage 2024 & 2032
- Figure 52: Europe Smart E-Drive Market Volume (K Unit), by Voltage 2024 & 2032
- Figure 53: Europe Smart E-Drive Market Revenue Share (%), by Voltage 2024 & 2032
- Figure 54: Europe Smart E-Drive Market Volume Share (%), by Voltage 2024 & 2032
- Figure 55: Europe Smart E-Drive Market Revenue (Million), by Power Rating Statistics 2024 & 2032
- Figure 56: Europe Smart E-Drive Market Volume (K Unit), by Power Rating Statistics 2024 & 2032
- Figure 57: Europe Smart E-Drive Market Revenue Share (%), by Power Rating Statistics 2024 & 2032
- Figure 58: Europe Smart E-Drive Market Volume Share (%), by Power Rating Statistics 2024 & 2032
- Figure 59: Europe Smart E-Drive Market Revenue (Million), by End-user Industry 2024 & 2032
- Figure 60: Europe Smart E-Drive Market Volume (K Unit), by End-user Industry 2024 & 2032
- Figure 61: Europe Smart E-Drive Market Revenue Share (%), by End-user Industry 2024 & 2032
- Figure 62: Europe Smart E-Drive Market Volume Share (%), by End-user Industry 2024 & 2032
- Figure 63: Europe Smart E-Drive Market Revenue (Million), by Country 2024 & 2032
- Figure 64: Europe Smart E-Drive Market Volume (K Unit), by Country 2024 & 2032
- Figure 65: Europe Smart E-Drive Market Revenue Share (%), by Country 2024 & 2032
- Figure 66: Europe Smart E-Drive Market Volume Share (%), by Country 2024 & 2032
- Figure 67: Asia Pacific Smart E-Drive Market Revenue (Million), by Product 2024 & 2032
- Figure 68: Asia Pacific Smart E-Drive Market Volume (K Unit), by Product 2024 & 2032
- Figure 69: Asia Pacific Smart E-Drive Market Revenue Share (%), by Product 2024 & 2032
- Figure 70: Asia Pacific Smart E-Drive Market Volume Share (%), by Product 2024 & 2032
- Figure 71: Asia Pacific Smart E-Drive Market Revenue (Million), by Voltage 2024 & 2032
- Figure 72: Asia Pacific Smart E-Drive Market Volume (K Unit), by Voltage 2024 & 2032
- Figure 73: Asia Pacific Smart E-Drive Market Revenue Share (%), by Voltage 2024 & 2032
- Figure 74: Asia Pacific Smart E-Drive Market Volume Share (%), by Voltage 2024 & 2032
- Figure 75: Asia Pacific Smart E-Drive Market Revenue (Million), by Power Rating Statistics 2024 & 2032
- Figure 76: Asia Pacific Smart E-Drive Market Volume (K Unit), by Power Rating Statistics 2024 & 2032
- Figure 77: Asia Pacific Smart E-Drive Market Revenue Share (%), by Power Rating Statistics 2024 & 2032
- Figure 78: Asia Pacific Smart E-Drive Market Volume Share (%), by Power Rating Statistics 2024 & 2032
- Figure 79: Asia Pacific Smart E-Drive Market Revenue (Million), by End-user Industry 2024 & 2032
- Figure 80: Asia Pacific Smart E-Drive Market Volume (K Unit), by End-user Industry 2024 & 2032
- Figure 81: Asia Pacific Smart E-Drive Market Revenue Share (%), by End-user Industry 2024 & 2032
- Figure 82: Asia Pacific Smart E-Drive Market Volume Share (%), by End-user Industry 2024 & 2032
- Figure 83: Asia Pacific Smart E-Drive Market Revenue (Million), by Country 2024 & 2032
- Figure 84: Asia Pacific Smart E-Drive Market Volume (K Unit), by Country 2024 & 2032
- Figure 85: Asia Pacific Smart E-Drive Market Revenue Share (%), by Country 2024 & 2032
- Figure 86: Asia Pacific Smart E-Drive Market Volume Share (%), by Country 2024 & 2032
- Figure 87: Latin America Smart E-Drive Market Revenue (Million), by Product 2024 & 2032
- Figure 88: Latin America Smart E-Drive Market Volume (K Unit), by Product 2024 & 2032
- Figure 89: Latin America Smart E-Drive Market Revenue Share (%), by Product 2024 & 2032
- Figure 90: Latin America Smart E-Drive Market Volume Share (%), by Product 2024 & 2032
- Figure 91: Latin America Smart E-Drive Market Revenue (Million), by Voltage 2024 & 2032
- Figure 92: Latin America Smart E-Drive Market Volume (K Unit), by Voltage 2024 & 2032
- Figure 93: Latin America Smart E-Drive Market Revenue Share (%), by Voltage 2024 & 2032
- Figure 94: Latin America Smart E-Drive Market Volume Share (%), by Voltage 2024 & 2032
- Figure 95: Latin America Smart E-Drive Market Revenue (Million), by Power Rating Statistics 2024 & 2032
- Figure 96: Latin America Smart E-Drive Market Volume (K Unit), by Power Rating Statistics 2024 & 2032
- Figure 97: Latin America Smart E-Drive Market Revenue Share (%), by Power Rating Statistics 2024 & 2032
- Figure 98: Latin America Smart E-Drive Market Volume Share (%), by Power Rating Statistics 2024 & 2032
- Figure 99: Latin America Smart E-Drive Market Revenue (Million), by End-user Industry 2024 & 2032
- Figure 100: Latin America Smart E-Drive Market Volume (K Unit), by End-user Industry 2024 & 2032
- Figure 101: Latin America Smart E-Drive Market Revenue Share (%), by End-user Industry 2024 & 2032
- Figure 102: Latin America Smart E-Drive Market Volume Share (%), by End-user Industry 2024 & 2032
- Figure 103: Latin America Smart E-Drive Market Revenue (Million), by Country 2024 & 2032
- Figure 104: Latin America Smart E-Drive Market Volume (K Unit), by Country 2024 & 2032
- Figure 105: Latin America Smart E-Drive Market Revenue Share (%), by Country 2024 & 2032
- Figure 106: Latin America Smart E-Drive Market Volume Share (%), by Country 2024 & 2032
- Figure 107: Middle East and Africa Smart E-Drive Market Revenue (Million), by Product 2024 & 2032
- Figure 108: Middle East and Africa Smart E-Drive Market Volume (K Unit), by Product 2024 & 2032
- Figure 109: Middle East and Africa Smart E-Drive Market Revenue Share (%), by Product 2024 & 2032
- Figure 110: Middle East and Africa Smart E-Drive Market Volume Share (%), by Product 2024 & 2032
- Figure 111: Middle East and Africa Smart E-Drive Market Revenue (Million), by Voltage 2024 & 2032
- Figure 112: Middle East and Africa Smart E-Drive Market Volume (K Unit), by Voltage 2024 & 2032
- Figure 113: Middle East and Africa Smart E-Drive Market Revenue Share (%), by Voltage 2024 & 2032
- Figure 114: Middle East and Africa Smart E-Drive Market Volume Share (%), by Voltage 2024 & 2032
- Figure 115: Middle East and Africa Smart E-Drive Market Revenue (Million), by Power Rating Statistics 2024 & 2032
- Figure 116: Middle East and Africa Smart E-Drive Market Volume (K Unit), by Power Rating Statistics 2024 & 2032
- Figure 117: Middle East and Africa Smart E-Drive Market Revenue Share (%), by Power Rating Statistics 2024 & 2032
- Figure 118: Middle East and Africa Smart E-Drive Market Volume Share (%), by Power Rating Statistics 2024 & 2032
- Figure 119: Middle East and Africa Smart E-Drive Market Revenue (Million), by End-user Industry 2024 & 2032
- Figure 120: Middle East and Africa Smart E-Drive Market Volume (K Unit), by End-user Industry 2024 & 2032
- Figure 121: Middle East and Africa Smart E-Drive Market Revenue Share (%), by End-user Industry 2024 & 2032
- Figure 122: Middle East and Africa Smart E-Drive Market Volume Share (%), by End-user Industry 2024 & 2032
- Figure 123: Middle East and Africa Smart E-Drive Market Revenue (Million), by Country 2024 & 2032
- Figure 124: Middle East and Africa Smart E-Drive Market Volume (K Unit), by Country 2024 & 2032
- Figure 125: Middle East and Africa Smart E-Drive Market Revenue Share (%), by Country 2024 & 2032
- Figure 126: Middle East and Africa Smart E-Drive Market Volume Share (%), by Country 2024 & 2032
List of Tables
- Table 1: Global Smart E-Drive Market Revenue Million Forecast, by Region 2019 & 2032
- Table 2: Global Smart E-Drive Market Volume K Unit Forecast, by Region 2019 & 2032
- Table 3: Global Smart E-Drive Market Revenue Million Forecast, by Product 2019 & 2032
- Table 4: Global Smart E-Drive Market Volume K Unit Forecast, by Product 2019 & 2032
- Table 5: Global Smart E-Drive Market Revenue Million Forecast, by Voltage 2019 & 2032
- Table 6: Global Smart E-Drive Market Volume K Unit Forecast, by Voltage 2019 & 2032
- Table 7: Global Smart E-Drive Market Revenue Million Forecast, by Power Rating Statistics 2019 & 2032
- Table 8: Global Smart E-Drive Market Volume K Unit Forecast, by Power Rating Statistics 2019 & 2032
- Table 9: Global Smart E-Drive Market Revenue Million Forecast, by End-user Industry 2019 & 2032
- Table 10: Global Smart E-Drive Market Volume K Unit Forecast, by End-user Industry 2019 & 2032
- Table 11: Global Smart E-Drive Market Revenue Million Forecast, by Region 2019 & 2032
- Table 12: Global Smart E-Drive Market Volume K Unit Forecast, by Region 2019 & 2032
- Table 13: Global Smart E-Drive Market Revenue Million Forecast, by Country 2019 & 2032
- Table 14: Global Smart E-Drive Market Volume K Unit Forecast, by Country 2019 & 2032
- Table 15: Global Smart E-Drive Market Revenue Million Forecast, by Country 2019 & 2032
- Table 16: Global Smart E-Drive Market Volume K Unit Forecast, by Country 2019 & 2032
- Table 17: Global Smart E-Drive Market Revenue Million Forecast, by Country 2019 & 2032
- Table 18: Global Smart E-Drive Market Volume K Unit Forecast, by Country 2019 & 2032
- Table 19: Global Smart E-Drive Market Revenue Million Forecast, by Country 2019 & 2032
- Table 20: Global Smart E-Drive Market Volume K Unit Forecast, by Country 2019 & 2032
- Table 21: Global Smart E-Drive Market Revenue Million Forecast, by Country 2019 & 2032
- Table 22: Global Smart E-Drive Market Volume K Unit Forecast, by Country 2019 & 2032
- Table 23: Global Smart E-Drive Market Revenue Million Forecast, by Country 2019 & 2032
- Table 24: Global Smart E-Drive Market Volume K Unit Forecast, by Country 2019 & 2032
- Table 25: Global Smart E-Drive Market Revenue Million Forecast, by Product 2019 & 2032
- Table 26: Global Smart E-Drive Market Volume K Unit Forecast, by Product 2019 & 2032
- Table 27: Global Smart E-Drive Market Revenue Million Forecast, by Voltage 2019 & 2032
- Table 28: Global Smart E-Drive Market Volume K Unit Forecast, by Voltage 2019 & 2032
- Table 29: Global Smart E-Drive Market Revenue Million Forecast, by Power Rating Statistics 2019 & 2032
- Table 30: Global Smart E-Drive Market Volume K Unit Forecast, by Power Rating Statistics 2019 & 2032
- Table 31: Global Smart E-Drive Market Revenue Million Forecast, by End-user Industry 2019 & 2032
- Table 32: Global Smart E-Drive Market Volume K Unit Forecast, by End-user Industry 2019 & 2032
- Table 33: Global Smart E-Drive Market Revenue Million Forecast, by Country 2019 & 2032
- Table 34: Global Smart E-Drive Market Volume K Unit Forecast, by Country 2019 & 2032
- Table 35: United States Smart E-Drive Market Revenue (Million) Forecast, by Application 2019 & 2032
- Table 36: United States Smart E-Drive Market Volume (K Unit) Forecast, by Application 2019 & 2032
- Table 37: Canada Smart E-Drive Market Revenue (Million) Forecast, by Application 2019 & 2032
- Table 38: Canada Smart E-Drive Market Volume (K Unit) Forecast, by Application 2019 & 2032
- Table 39: Global Smart E-Drive Market Revenue Million Forecast, by Product 2019 & 2032
- Table 40: Global Smart E-Drive Market Volume K Unit Forecast, by Product 2019 & 2032
- Table 41: Global Smart E-Drive Market Revenue Million Forecast, by Voltage 2019 & 2032
- Table 42: Global Smart E-Drive Market Volume K Unit Forecast, by Voltage 2019 & 2032
- Table 43: Global Smart E-Drive Market Revenue Million Forecast, by Power Rating Statistics 2019 & 2032
- Table 44: Global Smart E-Drive Market Volume K Unit Forecast, by Power Rating Statistics 2019 & 2032
- Table 45: Global Smart E-Drive Market Revenue Million Forecast, by End-user Industry 2019 & 2032
- Table 46: Global Smart E-Drive Market Volume K Unit Forecast, by End-user Industry 2019 & 2032
- Table 47: Global Smart E-Drive Market Revenue Million Forecast, by Country 2019 & 2032
- Table 48: Global Smart E-Drive Market Volume K Unit Forecast, by Country 2019 & 2032
- Table 49: Germany Smart E-Drive Market Revenue (Million) Forecast, by Application 2019 & 2032
- Table 50: Germany Smart E-Drive Market Volume (K Unit) Forecast, by Application 2019 & 2032
- Table 51: Italy Smart E-Drive Market Revenue (Million) Forecast, by Application 2019 & 2032
- Table 52: Italy Smart E-Drive Market Volume (K Unit) Forecast, by Application 2019 & 2032
- Table 53: United Kingdom Smart E-Drive Market Revenue (Million) Forecast, by Application 2019 & 2032
- Table 54: United Kingdom Smart E-Drive Market Volume (K Unit) Forecast, by Application 2019 & 2032
- Table 55: France Smart E-Drive Market Revenue (Million) Forecast, by Application 2019 & 2032
- Table 56: France Smart E-Drive Market Volume (K Unit) Forecast, by Application 2019 & 2032
- Table 57: Rest of Europe Smart E-Drive Market Revenue (Million) Forecast, by Application 2019 & 2032
- Table 58: Rest of Europe Smart E-Drive Market Volume (K Unit) Forecast, by Application 2019 & 2032
- Table 59: Global Smart E-Drive Market Revenue Million Forecast, by Product 2019 & 2032
- Table 60: Global Smart E-Drive Market Volume K Unit Forecast, by Product 2019 & 2032
- Table 61: Global Smart E-Drive Market Revenue Million Forecast, by Voltage 2019 & 2032
- Table 62: Global Smart E-Drive Market Volume K Unit Forecast, by Voltage 2019 & 2032
- Table 63: Global Smart E-Drive Market Revenue Million Forecast, by Power Rating Statistics 2019 & 2032
- Table 64: Global Smart E-Drive Market Volume K Unit Forecast, by Power Rating Statistics 2019 & 2032
- Table 65: Global Smart E-Drive Market Revenue Million Forecast, by End-user Industry 2019 & 2032
- Table 66: Global Smart E-Drive Market Volume K Unit Forecast, by End-user Industry 2019 & 2032
- Table 67: Global Smart E-Drive Market Revenue Million Forecast, by Country 2019 & 2032
- Table 68: Global Smart E-Drive Market Volume K Unit Forecast, by Country 2019 & 2032
- Table 69: China Smart E-Drive Market Revenue (Million) Forecast, by Application 2019 & 2032
- Table 70: China Smart E-Drive Market Volume (K Unit) Forecast, by Application 2019 & 2032
- Table 71: Japan Smart E-Drive Market Revenue (Million) Forecast, by Application 2019 & 2032
- Table 72: Japan Smart E-Drive Market Volume (K Unit) Forecast, by Application 2019 & 2032
- Table 73: India Smart E-Drive Market Revenue (Million) Forecast, by Application 2019 & 2032
- Table 74: India Smart E-Drive Market Volume (K Unit) Forecast, by Application 2019 & 2032
- Table 75: South Korea Smart E-Drive Market Revenue (Million) Forecast, by Application 2019 & 2032
- Table 76: South Korea Smart E-Drive Market Volume (K Unit) Forecast, by Application 2019 & 2032
- Table 77: Rest of Asia Pacific Smart E-Drive Market Revenue (Million) Forecast, by Application 2019 & 2032
- Table 78: Rest of Asia Pacific Smart E-Drive Market Volume (K Unit) Forecast, by Application 2019 & 2032
- Table 79: Global Smart E-Drive Market Revenue Million Forecast, by Product 2019 & 2032
- Table 80: Global Smart E-Drive Market Volume K Unit Forecast, by Product 2019 & 2032
- Table 81: Global Smart E-Drive Market Revenue Million Forecast, by Voltage 2019 & 2032
- Table 82: Global Smart E-Drive Market Volume K Unit Forecast, by Voltage 2019 & 2032
- Table 83: Global Smart E-Drive Market Revenue Million Forecast, by Power Rating Statistics 2019 & 2032
- Table 84: Global Smart E-Drive Market Volume K Unit Forecast, by Power Rating Statistics 2019 & 2032
- Table 85: Global Smart E-Drive Market Revenue Million Forecast, by End-user Industry 2019 & 2032
- Table 86: Global Smart E-Drive Market Volume K Unit Forecast, by End-user Industry 2019 & 2032
- Table 87: Global Smart E-Drive Market Revenue Million Forecast, by Country 2019 & 2032
- Table 88: Global Smart E-Drive Market Volume K Unit Forecast, by Country 2019 & 2032
- Table 89: Brazil Smart E-Drive Market Revenue (Million) Forecast, by Application 2019 & 2032
- Table 90: Brazil Smart E-Drive Market Volume (K Unit) Forecast, by Application 2019 & 2032
- Table 91: Mexico Smart E-Drive Market Revenue (Million) Forecast, by Application 2019 & 2032
- Table 92: Mexico Smart E-Drive Market Volume (K Unit) Forecast, by Application 2019 & 2032
- Table 93: Rest of Latin America Smart E-Drive Market Revenue (Million) Forecast, by Application 2019 & 2032
- Table 94: Rest of Latin America Smart E-Drive Market Volume (K Unit) Forecast, by Application 2019 & 2032
- Table 95: Global Smart E-Drive Market Revenue Million Forecast, by Product 2019 & 2032
- Table 96: Global Smart E-Drive Market Volume K Unit Forecast, by Product 2019 & 2032
- Table 97: Global Smart E-Drive Market Revenue Million Forecast, by Voltage 2019 & 2032
- Table 98: Global Smart E-Drive Market Volume K Unit Forecast, by Voltage 2019 & 2032
- Table 99: Global Smart E-Drive Market Revenue Million Forecast, by Power Rating Statistics 2019 & 2032
- Table 100: Global Smart E-Drive Market Volume K Unit Forecast, by Power Rating Statistics 2019 & 2032
- Table 101: Global Smart E-Drive Market Revenue Million Forecast, by End-user Industry 2019 & 2032
- Table 102: Global Smart E-Drive Market Volume K Unit Forecast, by End-user Industry 2019 & 2032
- Table 103: Global Smart E-Drive Market Revenue Million Forecast, by Country 2019 & 2032
- Table 104: Global Smart E-Drive Market Volume K Unit Forecast, by Country 2019 & 2032
- Table 105: United Arab Emirates Smart E-Drive Market Revenue (Million) Forecast, by Application 2019 & 2032
- Table 106: United Arab Emirates Smart E-Drive Market Volume (K Unit) Forecast, by Application 2019 & 2032
- Table 107: Saudi Arabia Smart E-Drive Market Revenue (Million) Forecast, by Application 2019 & 2032
- Table 108: Saudi Arabia Smart E-Drive Market Volume (K Unit) Forecast, by Application 2019 & 2032
- Table 109: Turkey Smart E-Drive Market Revenue (Million) Forecast, by Application 2019 & 2032
- Table 110: Turkey Smart E-Drive Market Volume (K Unit) Forecast, by Application 2019 & 2032
- Table 111: Rest of Middle East and Africa Smart E-Drive Market Revenue (Million) Forecast, by Application 2019 & 2032
- Table 112: Rest of Middle East and Africa Smart E-Drive Market Volume (K Unit) Forecast, by Application 2019 & 2032
Frequently Asked Questions
1. What is the projected Compound Annual Growth Rate (CAGR) of the Smart E-Drive Market?
The projected CAGR is approximately 5.10%.
2. Which companies are prominent players in the Smart E-Drive Market?
Key companies in the market include ABB Ltd, SEW-EURODRIVE GmbH & Co KG, Danfoss, Nidec Corporation, Mitsubishi Electric Corporation, Siemens AG, Schneider Electric SE, TMEIC Corporation, Rockwell Automation Inc, Yaskawa Electric Corporation.
3. What are the main segments of the Smart E-Drive Market?
The market segments include Product, Voltage, Power Rating Statistics, End-user Industry.
4. Can you provide details about the market size?
The market size is estimated to be USD 25.51 Million as of 2022.
5. What are some drivers contributing to market growth?
Rapid Industrialization and Increased use of Electric Drives Across Major Vertical Industries; Growing Demand for Energy Efficiency.
6. What are the notable trends driving market growth?
Power Generation to be the Major End-user Industry.
7. Are there any restraints impacting market growth?
Technical Concerns of the Equipment; High Cost of the Equipment.
8. Can you provide examples of recent developments in the market?
May 2023: Yaskawa Europe, the Japanese technology group Yaskawa Electric's European subsidiary, officially relocated to Hattersheim, near Frankfurt/Main. Yaskawa invested approximately EUR 23 million (USD 24.57 million) in the new building at its new Hattersheim industrial park location. The construction took about two years, as planned.
9. What pricing options are available for accessing the report?
Pricing options include single-user, multi-user, and enterprise licenses priced at USD 4750, USD 5250, and USD 8750 respectively.
10. Is the market size provided in terms of value or volume?
The market size is provided in terms of value, measured in Million and volume, measured in K Unit.
11. Are there any specific market keywords associated with the report?
Yes, the market keyword associated with the report is "Smart E-Drive Market," which aids in identifying and referencing the specific market segment covered.
12. How do I determine which pricing option suits my needs best?
The pricing options vary based on user requirements and access needs. Individual users may opt for single-user licenses, while businesses requiring broader access may choose multi-user or enterprise licenses for cost-effective access to the report.
13. Are there any additional resources or data provided in the Smart E-Drive Market report?
While the report offers comprehensive insights, it's advisable to review the specific contents or supplementary materials provided to ascertain if additional resources or data are available.
14. How can I stay updated on further developments or reports in the Smart E-Drive Market?
To stay informed about further developments, trends, and reports in the Smart E-Drive Market, consider subscribing to industry newsletters, following relevant companies and organizations, or regularly checking reputable industry news sources and publications.
Methodology
Step 1 - Identification of Relevant Samples Size from Population Database


Step 2 - Approaches for Defining Global Market Size (Value, Volume* & Price*)

Note*: In applicable scenarios
Step 3 - Data Sources
Primary Research
- Web Analytics
- Survey Reports
- Research Institute
- Latest Research Reports
- Opinion Leaders
Secondary Research
- Annual Reports
- White Paper
- Latest Press Release
- Industry Association
- Paid Database
- Investor Presentations

Step 4 - Data Triangulation
Involves using different sources of information in order to increase the validity of a study
These sources are likely to be stakeholders in a program - participants, other researchers, program staff, other community members, and so on.
Then we put all data in single framework & apply various statistical tools to find out the dynamic on the market.
During the analysis stage, feedback from the stakeholder groups would be compared to determine areas of agreement as well as areas of divergence
