

Key Insights
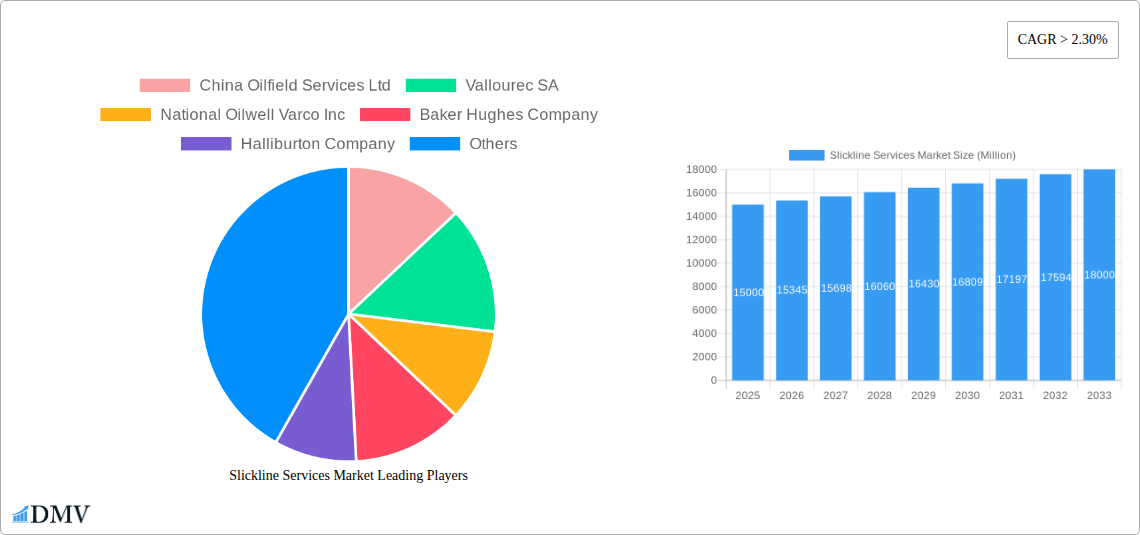
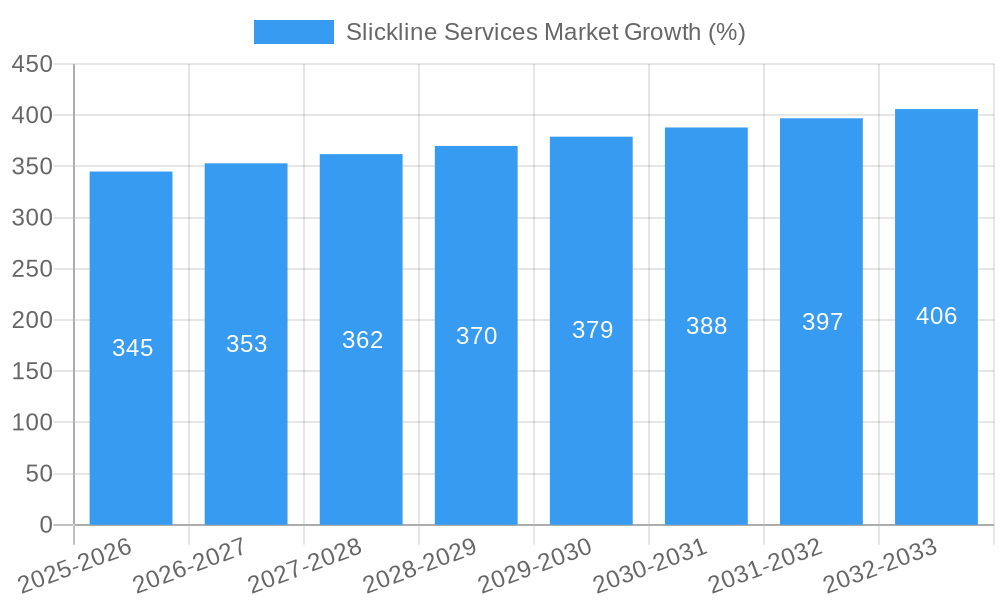
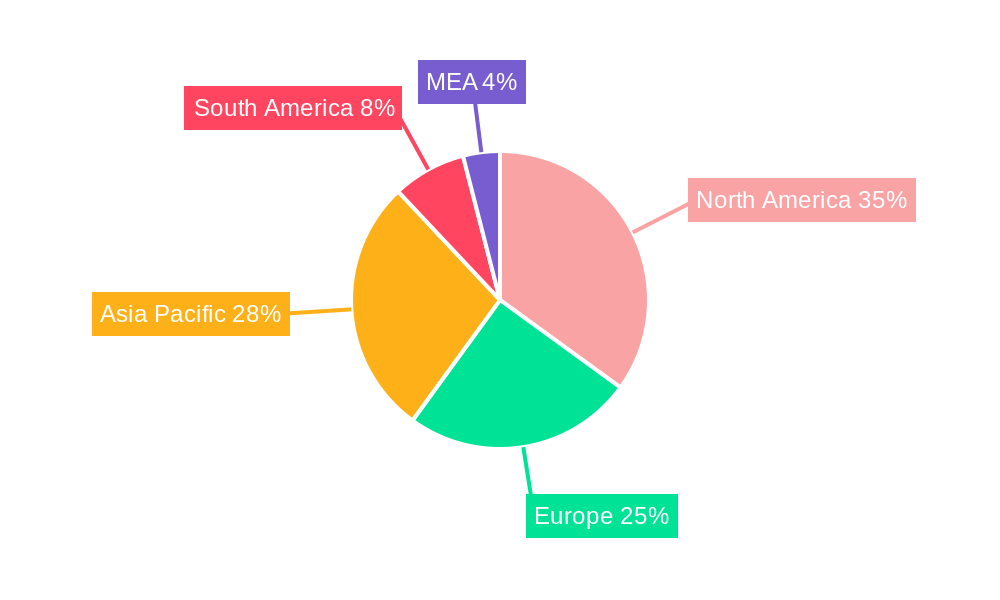
The global slickline services market is experiencing robust growth, driven by the increasing demand for oil and gas exploration and production activities worldwide. A CAGR exceeding 2.30% indicates a steadily expanding market, projected to reach significant value over the forecast period (2025-2033). Key drivers include the rising global energy consumption, necessitating enhanced oil and gas extraction techniques. The growing adoption of advanced slickline technologies for improved well intervention and completion operations further fuels market expansion. While challenges like fluctuating oil prices and stringent environmental regulations present some restraints, the overall outlook remains positive. Market segmentation reveals significant activity across operational areas, including well completion, intervention, and logging, with both onshore and offshore deployments contributing substantially to the overall market size. Major players like Schlumberger, Halliburton, and Baker Hughes dominate the market landscape, leveraging their technological expertise and global reach. Regional analysis highlights strong growth in North America and the Asia-Pacific region, fueled by extensive exploration and production activities in these areas. However, Europe and the Middle East & Africa also contribute significantly, indicating a geographically diverse market with substantial growth potential across various regions. The continued expansion of offshore oil and gas operations is expected to create substantial opportunities for slickline service providers in the coming years.
The market's growth trajectory is influenced by several factors. Technological advancements in slickline tools and techniques are leading to improved efficiency and reduced operational costs, making slickline services increasingly attractive. Furthermore, the increasing complexity of oil and gas wells requires specialized slickline services for effective well intervention and production optimization, contributing to the market's overall expansion. While economic downturns can impact investment in the sector, the long-term demand for energy suggests continued growth potential for the slickline services market. Competition among major players drives innovation and cost optimization, benefiting both service providers and end-users. The focus on sustainable practices and environmental regulations are also influencing the adoption of eco-friendly technologies within the slickline services sector, shaping future market trends.
Slickline Services Market: A Comprehensive Report (2019-2033)
This insightful report provides a detailed analysis of the global Slickline Services Market, offering a comprehensive overview of market trends, competitive landscape, and future growth prospects. The study covers the period from 2019 to 2033, with 2025 serving as the base and estimated year. The report is crucial for stakeholders, including industry players, investors, and researchers seeking to understand this dynamic market. The total market size is predicted to reach xx Million USD by 2033.
Slickline Services Market Composition & Trends
This section delves into the intricate structure of the slickline services market, analyzing key aspects influencing its evolution. Market concentration is assessed through the examination of market share distribution amongst leading players like Schlumberger Limited, Halliburton Company, and Baker Hughes Company. We evaluate the innovative advancements driving market growth, including technological improvements in slickline tools and deployment techniques. The report also examines the regulatory landscape, identifying potential challenges and opportunities presented by government policies. Substitute products and their impact on market competition are explored, along with a comprehensive analysis of end-user profiles within the oil and gas industry. Finally, Mergers & Acquisitions (M&A) activities within the sector are analyzed, including deal values and their implications for market consolidation.
- Market Concentration: Schlumberger and Halliburton hold a combined xx% market share (Estimated).
- Innovation Catalysts: Advancements in remote operations and data analytics.
- Regulatory Landscape: Stringent safety regulations impacting operational costs.
- Substitute Products: Limited, mainly related to alternative well intervention techniques.
- End-User Profile: Predominantly upstream oil and gas operators.
- M&A Activity: xx Million USD in M&A deals recorded between 2019 and 2024 (Estimated).
Slickline Services Market Industry Evolution
This section provides a detailed analysis of the Slickline Services market's growth trajectory from 2019 to 2033. We examine historical market performance and project future growth based on various factors, including technological advancements, shifting consumer demands (e.g., increasing demand for efficiency and reduced downtime), and global energy dynamics. The report meticulously traces the evolution of slickline technology, highlighting key milestones and their impact on market growth. Specific data points, such as Compound Annual Growth Rate (CAGR) for different segments and the adoption rate of new technologies, are provided to support the analysis. The influence of fluctuating oil prices and evolving exploration and production strategies on market demand is also explored in detail. The analysis incorporates qualitative and quantitative data to provide a holistic understanding of the market's dynamic evolution.
Leading Regions, Countries, or Segments in Slickline Services Market
This section identifies the dominant regions, countries, and segments within the slickline services market. Detailed analysis will pinpoint which areas—Onshore vs. Offshore deployments, and Well Completion, Well Intervention, or Logging operations— exhibit the strongest growth and market share.
- Key Drivers (Onshore): Increased onshore drilling activity in specific regions, governmental incentives for domestic energy production, and lower operational costs.
- Key Drivers (Offshore): High oil and gas reserves in offshore fields, technological advancements enabling efficient offshore operations, and major investments in deepwater exploration.
- Dominant Segment: Well Completion currently holds the largest market share, driven by increased demand for efficient well completion techniques.
- Dominant Region: North America (primarily the US) currently leads due to established shale gas production and ongoing exploration activities.
Slickline Services Market Product Innovations
Recent advancements in slickline technology have focused on enhancing operational efficiency, improving safety, and expanding the range of applications. This includes the development of lighter and more durable slickline tools, improved data acquisition and transmission systems, and advanced control systems enabling remote operation. These innovations provide unique selling propositions, such as faster deployment times, reduced downtime, and enhanced data quality, leading to greater cost-effectiveness and operational safety for clients.
Propelling Factors for Slickline Services Market Growth
Several key factors contribute to the growth of the slickline services market. Technological advancements, such as the development of advanced slickline tools and data analytics, improve efficiency and reduce operational costs. The growing demand for oil and gas globally, particularly in developing economies, fuels the need for efficient well intervention and completion services. Furthermore, supportive regulatory environments in some regions incentivize investment in oil and gas exploration and production, leading to increased demand for slickline services.
Obstacles in the Slickline Services Market
Several challenges hinder the growth of the slickline services market. Stringent regulatory requirements for safety and environmental protection increase operational costs and complexity. Supply chain disruptions, particularly during periods of high demand, can impact the availability of equipment and services. Intense competition among established players and the emergence of new entrants create price pressure and make it challenging to maintain profitability.
Future Opportunities in Slickline Services Market
The slickline services market presents numerous future opportunities. Expanding into new and emerging markets in developing economies offers significant growth potential. The adoption of advanced technologies, such as automation and artificial intelligence, can enhance efficiency and reduce operational risks. Furthermore, a focus on sustainable practices and environmental responsibility can attract environmentally conscious clients.
Major Players in the Slickline Services Market Ecosystem
- Schlumberger Limited
- Halliburton Company
- Baker Hughes Company
- Weatherford International Ltd
- China Oilfield Services Ltd
- Vallourec SA
- National Oilwell Varco Inc
- Scientific Drilling International Inc
Key Developments in Slickline Services Market Industry
- October 2021: National Energy Services announces USD 150 Million+ multi-year contracts for slickline services in GCC countries.
- September 2021: Reservoir Link Energy Bhd secures a slickline services contract from Sarawak Shell Bhd/Sabah Shell Petroleum Co. Ltd in Malaysia.
Strategic Slickline Services Market Forecast
The slickline services market is poised for robust growth over the forecast period (2025-2033), driven by increasing oil and gas exploration and production activities, technological advancements, and the expanding adoption of efficient well intervention techniques. The market will benefit from continued investments in upstream oil and gas projects globally and the ongoing demand for improved operational efficiency in the energy sector. The predicted growth trajectory indicates significant market potential, presenting attractive opportunities for industry players and investors.
Slickline Services Market Segmentation
-
1. Operation
- 1.1. Well Completion
- 1.2. Well Intervention
- 1.3. Logging
-
2. Location of Deployment
- 2.1. Onshore
- 2.2. Offshore
Slickline Services Market Segmentation By Geography
- 1. North America
- 2. Europe
- 3. Asia Pacific
- 4. South America
- 5. Middle East and Africa
Slickline Services Market REPORT HIGHLIGHTS
| Aspects | Details |
|---|---|
| Study Period | 2019-2033 |
| Base Year | 2024 |
| Estimated Year | 2025 |
| Forecast Period | 2025-2033 |
| Historical Period | 2019-2024 |
| Growth Rate | CAGR of > 2.30% from 2019-2033 |
| Segmentation |
|
Table of Contents
- 1. Introduction
- 1.1. Research Scope
- 1.2. Market Segmentation
- 1.3. Research Methodology
- 1.4. Definitions and Assumptions
- 2. Executive Summary
- 2.1. Introduction
- 3. Market Dynamics
- 3.1. Introduction
- 3.2. Market Drivers
- 3.2.1. 4.; Increased Drilling and Completion Activities
- 3.3. Market Restrains
- 3.3.1. 4.; Volatility of Oil Prices
- 3.4. Market Trends
- 3.4.1. Onshore Segment to Dominate the Market
- 4. Market Factor Analysis
- 4.1. Porters Five Forces
- 4.2. Supply/Value Chain
- 4.3. PESTEL analysis
- 4.4. Market Entropy
- 4.5. Patent/Trademark Analysis
- 5. Global Slickline Services Market Analysis, Insights and Forecast, 2019-2031
- 5.1. Market Analysis, Insights and Forecast - by Operation
- 5.1.1. Well Completion
- 5.1.2. Well Intervention
- 5.1.3. Logging
- 5.2. Market Analysis, Insights and Forecast - by Location of Deployment
- 5.2.1. Onshore
- 5.2.2. Offshore
- 5.3. Market Analysis, Insights and Forecast - by Region
- 5.3.1. North America
- 5.3.2. Europe
- 5.3.3. Asia Pacific
- 5.3.4. South America
- 5.3.5. Middle East and Africa
- 5.1. Market Analysis, Insights and Forecast - by Operation
- 6. North America Slickline Services Market Analysis, Insights and Forecast, 2019-2031
- 6.1. Market Analysis, Insights and Forecast - by Operation
- 6.1.1. Well Completion
- 6.1.2. Well Intervention
- 6.1.3. Logging
- 6.2. Market Analysis, Insights and Forecast - by Location of Deployment
- 6.2.1. Onshore
- 6.2.2. Offshore
- 6.1. Market Analysis, Insights and Forecast - by Operation
- 7. Europe Slickline Services Market Analysis, Insights and Forecast, 2019-2031
- 7.1. Market Analysis, Insights and Forecast - by Operation
- 7.1.1. Well Completion
- 7.1.2. Well Intervention
- 7.1.3. Logging
- 7.2. Market Analysis, Insights and Forecast - by Location of Deployment
- 7.2.1. Onshore
- 7.2.2. Offshore
- 7.1. Market Analysis, Insights and Forecast - by Operation
- 8. Asia Pacific Slickline Services Market Analysis, Insights and Forecast, 2019-2031
- 8.1. Market Analysis, Insights and Forecast - by Operation
- 8.1.1. Well Completion
- 8.1.2. Well Intervention
- 8.1.3. Logging
- 8.2. Market Analysis, Insights and Forecast - by Location of Deployment
- 8.2.1. Onshore
- 8.2.2. Offshore
- 8.1. Market Analysis, Insights and Forecast - by Operation
- 9. South America Slickline Services Market Analysis, Insights and Forecast, 2019-2031
- 9.1. Market Analysis, Insights and Forecast - by Operation
- 9.1.1. Well Completion
- 9.1.2. Well Intervention
- 9.1.3. Logging
- 9.2. Market Analysis, Insights and Forecast - by Location of Deployment
- 9.2.1. Onshore
- 9.2.2. Offshore
- 9.1. Market Analysis, Insights and Forecast - by Operation
- 10. Middle East and Africa Slickline Services Market Analysis, Insights and Forecast, 2019-2031
- 10.1. Market Analysis, Insights and Forecast - by Operation
- 10.1.1. Well Completion
- 10.1.2. Well Intervention
- 10.1.3. Logging
- 10.2. Market Analysis, Insights and Forecast - by Location of Deployment
- 10.2.1. Onshore
- 10.2.2. Offshore
- 10.1. Market Analysis, Insights and Forecast - by Operation
- 11. North America Slickline Services Market Analysis, Insights and Forecast, 2019-2031
- 11.1. Market Analysis, Insights and Forecast - By Country/Sub-region
- 11.1.1 United States
- 11.1.2 Canada
- 11.1.3 Mexico
- 12. Europe Slickline Services Market Analysis, Insights and Forecast, 2019-2031
- 12.1. Market Analysis, Insights and Forecast - By Country/Sub-region
- 12.1.1 Germany
- 12.1.2 United Kingdom
- 12.1.3 France
- 12.1.4 Spain
- 12.1.5 Italy
- 12.1.6 Spain
- 12.1.7 Belgium
- 12.1.8 Netherland
- 12.1.9 Nordics
- 12.1.10 Rest of Europe
- 13. Asia Pacific Slickline Services Market Analysis, Insights and Forecast, 2019-2031
- 13.1. Market Analysis, Insights and Forecast - By Country/Sub-region
- 13.1.1 China
- 13.1.2 Japan
- 13.1.3 India
- 13.1.4 South Korea
- 13.1.5 Southeast Asia
- 13.1.6 Australia
- 13.1.7 Indonesia
- 13.1.8 Phillipes
- 13.1.9 Singapore
- 13.1.10 Thailandc
- 13.1.11 Rest of Asia Pacific
- 14. South America Slickline Services Market Analysis, Insights and Forecast, 2019-2031
- 14.1. Market Analysis, Insights and Forecast - By Country/Sub-region
- 14.1.1 Brazil
- 14.1.2 Argentina
- 14.1.3 Peru
- 14.1.4 Chile
- 14.1.5 Colombia
- 14.1.6 Ecuador
- 14.1.7 Venezuela
- 14.1.8 Rest of South America
- 15. MEA Slickline Services Market Analysis, Insights and Forecast, 2019-2031
- 15.1. Market Analysis, Insights and Forecast - By Country/Sub-region
- 15.1.1 United Arab Emirates
- 15.1.2 Saudi Arabia
- 15.1.3 South Africa
- 15.1.4 Rest of Middle East and Africa
- 16. Competitive Analysis
- 16.1. Global Market Share Analysis 2024
- 16.2. Company Profiles
- 16.2.1 China Oilfield Services Ltd
- 16.2.1.1. Overview
- 16.2.1.2. Products
- 16.2.1.3. SWOT Analysis
- 16.2.1.4. Recent Developments
- 16.2.1.5. Financials (Based on Availability)
- 16.2.2 Vallourec SA
- 16.2.2.1. Overview
- 16.2.2.2. Products
- 16.2.2.3. SWOT Analysis
- 16.2.2.4. Recent Developments
- 16.2.2.5. Financials (Based on Availability)
- 16.2.3 National Oilwell Varco Inc
- 16.2.3.1. Overview
- 16.2.3.2. Products
- 16.2.3.3. SWOT Analysis
- 16.2.3.4. Recent Developments
- 16.2.3.5. Financials (Based on Availability)
- 16.2.4 Baker Hughes Company
- 16.2.4.1. Overview
- 16.2.4.2. Products
- 16.2.4.3. SWOT Analysis
- 16.2.4.4. Recent Developments
- 16.2.4.5. Financials (Based on Availability)
- 16.2.5 Halliburton Company
- 16.2.5.1. Overview
- 16.2.5.2. Products
- 16.2.5.3. SWOT Analysis
- 16.2.5.4. Recent Developments
- 16.2.5.5. Financials (Based on Availability)
- 16.2.6 Weatherford International Ltd
- 16.2.6.1. Overview
- 16.2.6.2. Products
- 16.2.6.3. SWOT Analysis
- 16.2.6.4. Recent Developments
- 16.2.6.5. Financials (Based on Availability)
- 16.2.7 Schlumberger Limited
- 16.2.7.1. Overview
- 16.2.7.2. Products
- 16.2.7.3. SWOT Analysis
- 16.2.7.4. Recent Developments
- 16.2.7.5. Financials (Based on Availability)
- 16.2.8 Scientific Drilling International Inc
- 16.2.8.1. Overview
- 16.2.8.2. Products
- 16.2.8.3. SWOT Analysis
- 16.2.8.4. Recent Developments
- 16.2.8.5. Financials (Based on Availability)
- 16.2.1 China Oilfield Services Ltd
List of Figures
- Figure 1: Global Slickline Services Market Revenue Breakdown (Million, %) by Region 2024 & 2032
- Figure 2: North America Slickline Services Market Revenue (Million), by Country 2024 & 2032
- Figure 3: North America Slickline Services Market Revenue Share (%), by Country 2024 & 2032
- Figure 4: Europe Slickline Services Market Revenue (Million), by Country 2024 & 2032
- Figure 5: Europe Slickline Services Market Revenue Share (%), by Country 2024 & 2032
- Figure 6: Asia Pacific Slickline Services Market Revenue (Million), by Country 2024 & 2032
- Figure 7: Asia Pacific Slickline Services Market Revenue Share (%), by Country 2024 & 2032
- Figure 8: South America Slickline Services Market Revenue (Million), by Country 2024 & 2032
- Figure 9: South America Slickline Services Market Revenue Share (%), by Country 2024 & 2032
- Figure 10: MEA Slickline Services Market Revenue (Million), by Country 2024 & 2032
- Figure 11: MEA Slickline Services Market Revenue Share (%), by Country 2024 & 2032
- Figure 12: North America Slickline Services Market Revenue (Million), by Operation 2024 & 2032
- Figure 13: North America Slickline Services Market Revenue Share (%), by Operation 2024 & 2032
- Figure 14: North America Slickline Services Market Revenue (Million), by Location of Deployment 2024 & 2032
- Figure 15: North America Slickline Services Market Revenue Share (%), by Location of Deployment 2024 & 2032
- Figure 16: North America Slickline Services Market Revenue (Million), by Country 2024 & 2032
- Figure 17: North America Slickline Services Market Revenue Share (%), by Country 2024 & 2032
- Figure 18: Europe Slickline Services Market Revenue (Million), by Operation 2024 & 2032
- Figure 19: Europe Slickline Services Market Revenue Share (%), by Operation 2024 & 2032
- Figure 20: Europe Slickline Services Market Revenue (Million), by Location of Deployment 2024 & 2032
- Figure 21: Europe Slickline Services Market Revenue Share (%), by Location of Deployment 2024 & 2032
- Figure 22: Europe Slickline Services Market Revenue (Million), by Country 2024 & 2032
- Figure 23: Europe Slickline Services Market Revenue Share (%), by Country 2024 & 2032
- Figure 24: Asia Pacific Slickline Services Market Revenue (Million), by Operation 2024 & 2032
- Figure 25: Asia Pacific Slickline Services Market Revenue Share (%), by Operation 2024 & 2032
- Figure 26: Asia Pacific Slickline Services Market Revenue (Million), by Location of Deployment 2024 & 2032
- Figure 27: Asia Pacific Slickline Services Market Revenue Share (%), by Location of Deployment 2024 & 2032
- Figure 28: Asia Pacific Slickline Services Market Revenue (Million), by Country 2024 & 2032
- Figure 29: Asia Pacific Slickline Services Market Revenue Share (%), by Country 2024 & 2032
- Figure 30: South America Slickline Services Market Revenue (Million), by Operation 2024 & 2032
- Figure 31: South America Slickline Services Market Revenue Share (%), by Operation 2024 & 2032
- Figure 32: South America Slickline Services Market Revenue (Million), by Location of Deployment 2024 & 2032
- Figure 33: South America Slickline Services Market Revenue Share (%), by Location of Deployment 2024 & 2032
- Figure 34: South America Slickline Services Market Revenue (Million), by Country 2024 & 2032
- Figure 35: South America Slickline Services Market Revenue Share (%), by Country 2024 & 2032
- Figure 36: Middle East and Africa Slickline Services Market Revenue (Million), by Operation 2024 & 2032
- Figure 37: Middle East and Africa Slickline Services Market Revenue Share (%), by Operation 2024 & 2032
- Figure 38: Middle East and Africa Slickline Services Market Revenue (Million), by Location of Deployment 2024 & 2032
- Figure 39: Middle East and Africa Slickline Services Market Revenue Share (%), by Location of Deployment 2024 & 2032
- Figure 40: Middle East and Africa Slickline Services Market Revenue (Million), by Country 2024 & 2032
- Figure 41: Middle East and Africa Slickline Services Market Revenue Share (%), by Country 2024 & 2032
List of Tables
- Table 1: Global Slickline Services Market Revenue Million Forecast, by Region 2019 & 2032
- Table 2: Global Slickline Services Market Revenue Million Forecast, by Operation 2019 & 2032
- Table 3: Global Slickline Services Market Revenue Million Forecast, by Location of Deployment 2019 & 2032
- Table 4: Global Slickline Services Market Revenue Million Forecast, by Region 2019 & 2032
- Table 5: Global Slickline Services Market Revenue Million Forecast, by Country 2019 & 2032
- Table 6: United States Slickline Services Market Revenue (Million) Forecast, by Application 2019 & 2032
- Table 7: Canada Slickline Services Market Revenue (Million) Forecast, by Application 2019 & 2032
- Table 8: Mexico Slickline Services Market Revenue (Million) Forecast, by Application 2019 & 2032
- Table 9: Global Slickline Services Market Revenue Million Forecast, by Country 2019 & 2032
- Table 10: Germany Slickline Services Market Revenue (Million) Forecast, by Application 2019 & 2032
- Table 11: United Kingdom Slickline Services Market Revenue (Million) Forecast, by Application 2019 & 2032
- Table 12: France Slickline Services Market Revenue (Million) Forecast, by Application 2019 & 2032
- Table 13: Spain Slickline Services Market Revenue (Million) Forecast, by Application 2019 & 2032
- Table 14: Italy Slickline Services Market Revenue (Million) Forecast, by Application 2019 & 2032
- Table 15: Spain Slickline Services Market Revenue (Million) Forecast, by Application 2019 & 2032
- Table 16: Belgium Slickline Services Market Revenue (Million) Forecast, by Application 2019 & 2032
- Table 17: Netherland Slickline Services Market Revenue (Million) Forecast, by Application 2019 & 2032
- Table 18: Nordics Slickline Services Market Revenue (Million) Forecast, by Application 2019 & 2032
- Table 19: Rest of Europe Slickline Services Market Revenue (Million) Forecast, by Application 2019 & 2032
- Table 20: Global Slickline Services Market Revenue Million Forecast, by Country 2019 & 2032
- Table 21: China Slickline Services Market Revenue (Million) Forecast, by Application 2019 & 2032
- Table 22: Japan Slickline Services Market Revenue (Million) Forecast, by Application 2019 & 2032
- Table 23: India Slickline Services Market Revenue (Million) Forecast, by Application 2019 & 2032
- Table 24: South Korea Slickline Services Market Revenue (Million) Forecast, by Application 2019 & 2032
- Table 25: Southeast Asia Slickline Services Market Revenue (Million) Forecast, by Application 2019 & 2032
- Table 26: Australia Slickline Services Market Revenue (Million) Forecast, by Application 2019 & 2032
- Table 27: Indonesia Slickline Services Market Revenue (Million) Forecast, by Application 2019 & 2032
- Table 28: Phillipes Slickline Services Market Revenue (Million) Forecast, by Application 2019 & 2032
- Table 29: Singapore Slickline Services Market Revenue (Million) Forecast, by Application 2019 & 2032
- Table 30: Thailandc Slickline Services Market Revenue (Million) Forecast, by Application 2019 & 2032
- Table 31: Rest of Asia Pacific Slickline Services Market Revenue (Million) Forecast, by Application 2019 & 2032
- Table 32: Global Slickline Services Market Revenue Million Forecast, by Country 2019 & 2032
- Table 33: Brazil Slickline Services Market Revenue (Million) Forecast, by Application 2019 & 2032
- Table 34: Argentina Slickline Services Market Revenue (Million) Forecast, by Application 2019 & 2032
- Table 35: Peru Slickline Services Market Revenue (Million) Forecast, by Application 2019 & 2032
- Table 36: Chile Slickline Services Market Revenue (Million) Forecast, by Application 2019 & 2032
- Table 37: Colombia Slickline Services Market Revenue (Million) Forecast, by Application 2019 & 2032
- Table 38: Ecuador Slickline Services Market Revenue (Million) Forecast, by Application 2019 & 2032
- Table 39: Venezuela Slickline Services Market Revenue (Million) Forecast, by Application 2019 & 2032
- Table 40: Rest of South America Slickline Services Market Revenue (Million) Forecast, by Application 2019 & 2032
- Table 41: Global Slickline Services Market Revenue Million Forecast, by Country 2019 & 2032
- Table 42: United Arab Emirates Slickline Services Market Revenue (Million) Forecast, by Application 2019 & 2032
- Table 43: Saudi Arabia Slickline Services Market Revenue (Million) Forecast, by Application 2019 & 2032
- Table 44: South Africa Slickline Services Market Revenue (Million) Forecast, by Application 2019 & 2032
- Table 45: Rest of Middle East and Africa Slickline Services Market Revenue (Million) Forecast, by Application 2019 & 2032
- Table 46: Global Slickline Services Market Revenue Million Forecast, by Operation 2019 & 2032
- Table 47: Global Slickline Services Market Revenue Million Forecast, by Location of Deployment 2019 & 2032
- Table 48: Global Slickline Services Market Revenue Million Forecast, by Country 2019 & 2032
- Table 49: Global Slickline Services Market Revenue Million Forecast, by Operation 2019 & 2032
- Table 50: Global Slickline Services Market Revenue Million Forecast, by Location of Deployment 2019 & 2032
- Table 51: Global Slickline Services Market Revenue Million Forecast, by Country 2019 & 2032
- Table 52: Global Slickline Services Market Revenue Million Forecast, by Operation 2019 & 2032
- Table 53: Global Slickline Services Market Revenue Million Forecast, by Location of Deployment 2019 & 2032
- Table 54: Global Slickline Services Market Revenue Million Forecast, by Country 2019 & 2032
- Table 55: Global Slickline Services Market Revenue Million Forecast, by Operation 2019 & 2032
- Table 56: Global Slickline Services Market Revenue Million Forecast, by Location of Deployment 2019 & 2032
- Table 57: Global Slickline Services Market Revenue Million Forecast, by Country 2019 & 2032
- Table 58: Global Slickline Services Market Revenue Million Forecast, by Operation 2019 & 2032
- Table 59: Global Slickline Services Market Revenue Million Forecast, by Location of Deployment 2019 & 2032
- Table 60: Global Slickline Services Market Revenue Million Forecast, by Country 2019 & 2032
Frequently Asked Questions
1. What is the projected Compound Annual Growth Rate (CAGR) of the Slickline Services Market?
The projected CAGR is approximately > 2.30%.
2. Which companies are prominent players in the Slickline Services Market?
Key companies in the market include China Oilfield Services Ltd, Vallourec SA, National Oilwell Varco Inc, Baker Hughes Company, Halliburton Company, Weatherford International Ltd, Schlumberger Limited, Scientific Drilling International Inc.
3. What are the main segments of the Slickline Services Market?
The market segments include Operation, Location of Deployment.
4. Can you provide details about the market size?
The market size is estimated to be USD XX Million as of 2022.
5. What are some drivers contributing to market growth?
4.; Increased Drilling and Completion Activities.
6. What are the notable trends driving market growth?
Onshore Segment to Dominate the Market.
7. Are there any restraints impacting market growth?
4.; Volatility of Oil Prices.
8. Can you provide examples of recent developments in the market?
In October 2021, National Energy Services announced several drilling and evaluation service lines in GCC countries, totaling more than USD 150M. It also revealed that the multi-year contracts encompass slickline services, tubular running services, and testing services with multiple national oil companies.
9. What pricing options are available for accessing the report?
Pricing options include single-user, multi-user, and enterprise licenses priced at USD 4750, USD 5250, and USD 8750 respectively.
10. Is the market size provided in terms of value or volume?
The market size is provided in terms of value, measured in Million.
11. Are there any specific market keywords associated with the report?
Yes, the market keyword associated with the report is "Slickline Services Market," which aids in identifying and referencing the specific market segment covered.
12. How do I determine which pricing option suits my needs best?
The pricing options vary based on user requirements and access needs. Individual users may opt for single-user licenses, while businesses requiring broader access may choose multi-user or enterprise licenses for cost-effective access to the report.
13. Are there any additional resources or data provided in the Slickline Services Market report?
While the report offers comprehensive insights, it's advisable to review the specific contents or supplementary materials provided to ascertain if additional resources or data are available.
14. How can I stay updated on further developments or reports in the Slickline Services Market?
To stay informed about further developments, trends, and reports in the Slickline Services Market, consider subscribing to industry newsletters, following relevant companies and organizations, or regularly checking reputable industry news sources and publications.
Methodology
Step 1 - Identification of Relevant Samples Size from Population Database


Step 2 - Approaches for Defining Global Market Size (Value, Volume* & Price*)

Note*: In applicable scenarios
Step 3 - Data Sources
Primary Research
- Web Analytics
- Survey Reports
- Research Institute
- Latest Research Reports
- Opinion Leaders
Secondary Research
- Annual Reports
- White Paper
- Latest Press Release
- Industry Association
- Paid Database
- Investor Presentations

Step 4 - Data Triangulation
Involves using different sources of information in order to increase the validity of a study
These sources are likely to be stakeholders in a program - participants, other researchers, program staff, other community members, and so on.
Then we put all data in single framework & apply various statistical tools to find out the dynamic on the market.
During the analysis stage, feedback from the stakeholder groups would be compared to determine areas of agreement as well as areas of divergence
