

Key Insights
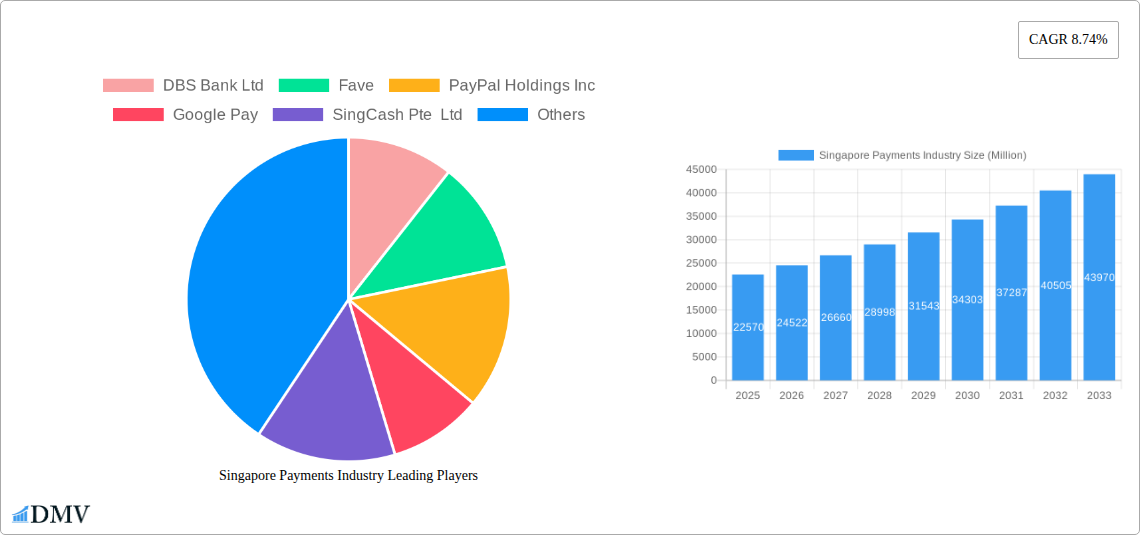
The Singapore payments industry, valued at $22.57 billion in 2025, is experiencing robust growth, projected to expand at a compound annual growth rate (CAGR) of 8.74% from 2025 to 2033. This expansion is driven by several key factors. The increasing adoption of e-commerce and digital banking fuels the demand for convenient and secure online payment solutions. Mobile payment platforms like GrabPay, Google Pay, and Apple Pay are experiencing widespread adoption, driven by user-friendly interfaces and promotional offers. Furthermore, the government's initiatives to promote a cashless society and robust digital infrastructure are creating a conducive environment for payment innovation. The rise of fintech companies offering specialized payment solutions tailored to specific industry needs, such as those catering to the retail, entertainment, and healthcare sectors, further contributes to this growth. While challenges remain, such as maintaining data security and addressing concerns about financial inclusion, the overall trajectory indicates a significant upward trend in the coming years.
The segmentation of the market reveals valuable insights into its structure. The Point of Sale (POS) segment dominates the market, reflecting the continued importance of traditional retail transactions. However, the “Other Point of Sales” segment, encompassing online sales, is experiencing rapid growth, fueled by the increasing popularity of e-commerce. Similarly, while retail remains a major end-user industry, the healthcare, hospitality, and entertainment sectors are demonstrating substantial growth in digital payment adoption, driven by factors like contactless transactions and increased efficiency. Key players like DBS Bank, PayPal, and Grab are actively competing to secure market share, through strategic partnerships, technological innovation, and expansion of their payment platforms. The competitive landscape is dynamic, with established players facing competition from emerging fintech startups, fostering innovation and driving down costs for consumers.
Singapore Payments Industry: A Comprehensive Market Report (2019-2033)
This insightful report provides a detailed analysis of the dynamic Singapore payments industry, projecting robust growth from 2025 to 2033. We delve into market composition, technological advancements, competitive landscapes, and future opportunities, equipping stakeholders with crucial insights for strategic decision-making. The report covers the period from 2019 to 2033, with a focus on 2025 as the base and estimated year. The market size is projected to reach xx Million by 2033.
Singapore Payments Industry Market Composition & Trends
This section examines the competitive landscape, innovation drivers, regulatory framework, and market dynamics within the Singapore payments sector. We analyze market share distribution among key players, including DBS Bank Ltd, Fave, PayPal Holdings Inc, Google Pay, SingCash Pte Ltd, Amazon.com Inc, Grab, Alipay, Apple Inc, and Samsung, and evaluate the impact of mergers and acquisitions (M&A) activities on market consolidation. The historical period (2019-2024) reveals a market characterized by increasing digitalization and the emergence of new payment technologies.
- Market Concentration: The Singapore payments market shows a moderate level of concentration, with a few dominant players alongside numerous smaller fintech companies. DBS Bank Ltd and other major banks hold significant market share in traditional banking channels, while players like Grab and Alipay dominate mobile payments. The market share distribution for 2025 is estimated as follows: DBS Bank Ltd (xx%), Grab (xx%), PayPal (xx%), Others (xx%).
- Innovation Catalysts: Government initiatives promoting fintech innovation, a tech-savvy population, and a robust digital infrastructure are key catalysts driving market growth. The emergence of open banking and APIs has further fueled innovation.
- Regulatory Landscape: The Monetary Authority of Singapore (MAS) plays a crucial role in shaping the regulatory landscape, promoting financial stability and consumer protection. Regulations concerning data privacy, cybersecurity, and anti-money laundering are key considerations.
- Substitute Products: Traditional cash and cheque payments are gradually being replaced by digital alternatives. However, the coexistence of these payment methods is likely to continue for the foreseeable future.
- End-User Profiles: The report profiles various end-user segments, analyzing their payment preferences and adoption rates for different payment methods. This includes detailed analysis across retail, entertainment, healthcare, and hospitality sectors.
- M&A Activities: The Singapore payments industry has witnessed several significant M&A deals in recent years, valued at approximately xx Million in total (2019-2024). These activities have reshaped the competitive landscape and spurred further innovation.
Singapore Payments Industry Industry Evolution
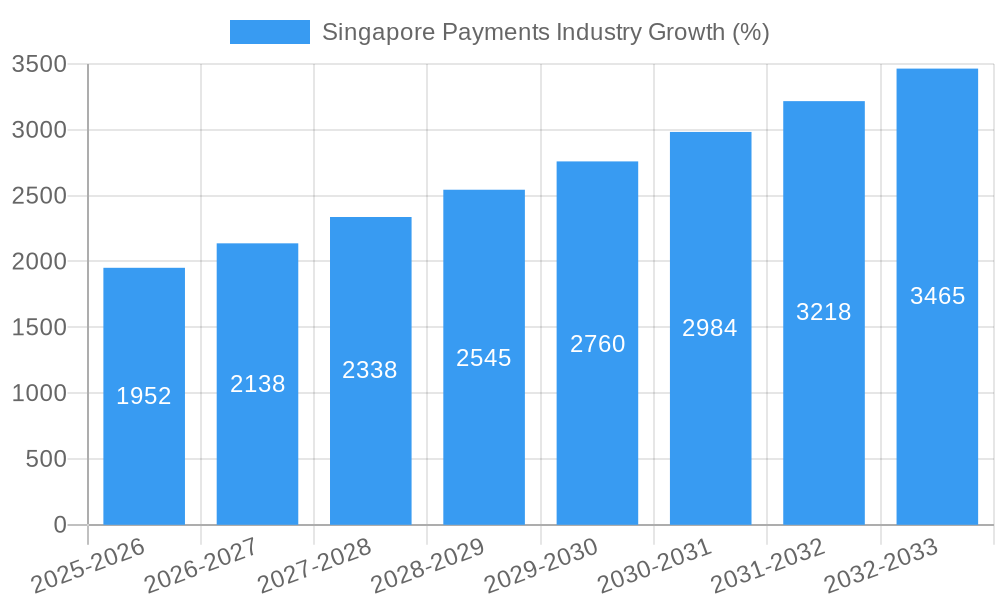
This section traces the evolution of the Singapore payments industry, analyzing market growth trajectories, technological advancements, and evolving consumer preferences from 2019 to 2033. The industry has witnessed a dramatic shift towards digital payments, driven by factors such as increasing smartphone penetration, enhanced internet connectivity, and the growing popularity of e-commerce. Growth has been particularly strong in the mobile payments segment, which is projected to maintain a Compound Annual Growth Rate (CAGR) of xx% from 2025 to 2033. The adoption rate of contactless payments has also seen a significant increase, with xx% of transactions now using contactless methods. Consumer demand for seamless, secure, and convenient payment experiences is a major driving force behind this transformation. The rise of super apps, offering integrated payment functionalities alongside other services, is another significant trend. Furthermore, the increasing prevalence of embedded finance is revolutionizing the industry, allowing for payment options to be seamlessly integrated into various platforms and services. This shift has led to increased competition and innovation.
Leading Regions, Countries, or Segments in Singapore Payments Industry
Singapore's payments industry is largely concentrated within the country itself. The dominant segments are analyzed below.
By Mode of Payment:
- Point of Sale (POS): POS systems are still widely used, with a significant portion of transactions taking place offline. Key drivers include ease of use for merchants and the ability to process both digital and cash transactions.
- Online Sale (e-commerce): The rapid growth of e-commerce has fuelled the adoption of online payment methods, with digital wallets and bank transfers gaining significant traction. This segment is projected to continue its strong growth trajectory, driven by increasing online shopping and the expansion of digital platforms.
By End-user Industry:
- Retail: The retail sector is the largest segment, with a large portion of transactions conducted through POS systems and online channels. The increasing demand for contactless and mobile payment options is particularly strong in this sector.
- Entertainment: This segment has experienced robust growth due to the increasing adoption of digital ticketing and online streaming services. Mobile payments and digital wallets are rapidly becoming the preferred payment method.
- Healthcare: The increasing digitization of healthcare services has led to the adoption of online payment options in this sector, driving the growth of digital wallets and mobile payment solutions.
- Hospitality: Similar to the retail sector, the hospitality sector has seen a significant shift toward digital payments, particularly in online booking and in-app payments.
The dominance of these segments is driven by factors such as high internet and smartphone penetration rates, supportive government policies, and a rapidly evolving technological landscape.
Singapore Payments Industry Product Innovations
The Singapore payments landscape is marked by continuous product innovation. New payment methods, such as QR code-based payments and mobile wallets, have gained significant traction. Fintech companies are constantly developing new applications, such as buy-now-pay-later services and peer-to-peer (P2P) payment platforms. These innovations are characterized by enhanced security features, user-friendly interfaces, and integration with other financial services. The focus is on offering seamless and convenient payment experiences, driving further adoption.
Propelling Factors for Singapore Payments Industry Growth
Several factors fuel the growth of Singapore's payments industry. Technological advancements, such as the widespread adoption of smartphones and improved internet infrastructure, have facilitated the shift towards digital payments. Government support, through initiatives aimed at promoting fintech innovation and digitalization, has also played a crucial role. Furthermore, the increasing preference for cashless transactions among consumers and the growing adoption of e-commerce are key growth drivers. Economic growth and increased consumer spending power contribute to higher transaction volumes.
Obstacles in the Singapore Payments Industry Market
Despite its strong growth trajectory, the Singapore payments market faces certain obstacles. Regulatory complexities, particularly around data privacy and cybersecurity, can hinder innovation. Supply chain disruptions, particularly during periods of global uncertainty, can affect the availability of certain payment technologies. Intense competition from both established players and emerging fintech companies poses a challenge. These obstacles, if not effectively managed, can impact market growth.
Future Opportunities in Singapore Payments Industry
Several opportunities exist for growth in Singapore's payments industry. Expansion into new market segments, such as micro, small, and medium-sized enterprises (MSMEs), offers considerable potential. The adoption of emerging technologies, such as blockchain and artificial intelligence (AI), can enhance payment security and efficiency. Leveraging the growing trend of embedded finance, integrating payments into various platforms and services, will present significant opportunities. Addressing evolving consumer demands, such as personalized payment experiences and enhanced security, is crucial for capturing future market share.
Major Players in the Singapore Payments Industry Ecosystem
- DBS Bank Ltd
- Fave
- PayPal Holdings Inc
- Google Pay
- SingCash Pte Ltd
- Amazon.com Inc
- Grab
- Alipay
- Apple Inc
- Samsung
Key Developments in Singapore Payments Industry Industry
- July 2022: Google Wallet launched in Singapore, complementing Google Pay and offering a unified platform for digital documents and credentials.
- January 2023: Samsung Wallet expanded to Singapore, providing a secure digital wallet for keys, boarding passes, and identification.
These developments reflect the ongoing push towards integrated digital wallets and enhanced user experiences.
Strategic Singapore Payments Industry Market Forecast
The Singapore payments industry is poised for continued strong growth driven by technological innovation, government support, and increasing consumer adoption of digital payment methods. The market is expected to expand significantly over the forecast period (2025-2033), driven by the increasing popularity of mobile payments, e-commerce, and the rise of super apps. Opportunities lie in leveraging emerging technologies, expanding into new market segments, and addressing the evolving needs of consumers. The market's future success depends on addressing challenges such as regulatory complexities and maintaining a secure and reliable payment ecosystem.
Singapore Payments Industry Segmentation
-
1. Mode of Payment
-
1.1. Point of Sale
- 1.1.1. Card Pay
- 1.1.2. Digital Wallet (includes Mobile Wallets)
- 1.1.3. Cash
- 1.1.4. Other Point of Sales
-
1.2. Online Sale
- 1.2.1. Other
-
1.1. Point of Sale
-
2. End-user Industry
- 2.1. Retail
- 2.2. Entertainment
- 2.3. Healthcare
- 2.4. Hospitality
- 2.5. Other End-user Industries
Singapore Payments Industry Segmentation By Geography
- 1. Singapore
Singapore Payments Industry REPORT HIGHLIGHTS
| Aspects | Details |
|---|---|
| Study Period | 2019-2033 |
| Base Year | 2024 |
| Estimated Year | 2025 |
| Forecast Period | 2025-2033 |
| Historical Period | 2019-2024 |
| Growth Rate | CAGR of 8.74% from 2019-2033 |
| Segmentation |
|
Table of Contents
- 1. Introduction
- 1.1. Research Scope
- 1.2. Market Segmentation
- 1.3. Research Methodology
- 1.4. Definitions and Assumptions
- 2. Executive Summary
- 2.1. Introduction
- 3. Market Dynamics
- 3.1. Introduction
- 3.2. Market Drivers
- 3.2.1 The payments market in Singapore is driven by boom in the e-commerce industry; Major retailers and the government are promoting Market Digitization through activation programs.; Increased use of real-time payments
- 3.2.2 specifically Buy Now Pay Later.
- 3.3. Market Restrains
- 3.3.1. High Costs of Equipment
- 3.4. Market Trends
- 3.4.1. The payments market in Singapore is driven by boom in the e-commerce industry
- 4. Market Factor Analysis
- 4.1. Porters Five Forces
- 4.2. Supply/Value Chain
- 4.3. PESTEL analysis
- 4.4. Market Entropy
- 4.5. Patent/Trademark Analysis
- 5. Singapore Payments Industry Analysis, Insights and Forecast, 2019-2031
- 5.1. Market Analysis, Insights and Forecast - by Mode of Payment
- 5.1.1. Point of Sale
- 5.1.1.1. Card Pay
- 5.1.1.2. Digital Wallet (includes Mobile Wallets)
- 5.1.1.3. Cash
- 5.1.1.4. Other Point of Sales
- 5.1.2. Online Sale
- 5.1.2.1. Other
- 5.1.1. Point of Sale
- 5.2. Market Analysis, Insights and Forecast - by End-user Industry
- 5.2.1. Retail
- 5.2.2. Entertainment
- 5.2.3. Healthcare
- 5.2.4. Hospitality
- 5.2.5. Other End-user Industries
- 5.3. Market Analysis, Insights and Forecast - by Region
- 5.3.1. Singapore
- 5.1. Market Analysis, Insights and Forecast - by Mode of Payment
- 6. Competitive Analysis
- 6.1. Market Share Analysis 2024
- 6.2. Company Profiles
- 6.2.1 DBS Bank Ltd
- 6.2.1.1. Overview
- 6.2.1.2. Products
- 6.2.1.3. SWOT Analysis
- 6.2.1.4. Recent Developments
- 6.2.1.5. Financials (Based on Availability)
- 6.2.2 Fave
- 6.2.2.1. Overview
- 6.2.2.2. Products
- 6.2.2.3. SWOT Analysis
- 6.2.2.4. Recent Developments
- 6.2.2.5. Financials (Based on Availability)
- 6.2.3 PayPal Holdings Inc
- 6.2.3.1. Overview
- 6.2.3.2. Products
- 6.2.3.3. SWOT Analysis
- 6.2.3.4. Recent Developments
- 6.2.3.5. Financials (Based on Availability)
- 6.2.4 Google Pay
- 6.2.4.1. Overview
- 6.2.4.2. Products
- 6.2.4.3. SWOT Analysis
- 6.2.4.4. Recent Developments
- 6.2.4.5. Financials (Based on Availability)
- 6.2.5 SingCash Pte Ltd
- 6.2.5.1. Overview
- 6.2.5.2. Products
- 6.2.5.3. SWOT Analysis
- 6.2.5.4. Recent Developments
- 6.2.5.5. Financials (Based on Availability)
- 6.2.6 Amazon com Inc
- 6.2.6.1. Overview
- 6.2.6.2. Products
- 6.2.6.3. SWOT Analysis
- 6.2.6.4. Recent Developments
- 6.2.6.5. Financials (Based on Availability)
- 6.2.7 Grab
- 6.2.7.1. Overview
- 6.2.7.2. Products
- 6.2.7.3. SWOT Analysis
- 6.2.7.4. Recent Developments
- 6.2.7.5. Financials (Based on Availability)
- 6.2.8 Alipay
- 6.2.8.1. Overview
- 6.2.8.2. Products
- 6.2.8.3. SWOT Analysis
- 6.2.8.4. Recent Developments
- 6.2.8.5. Financials (Based on Availability)
- 6.2.9 Apple Inc
- 6.2.9.1. Overview
- 6.2.9.2. Products
- 6.2.9.3. SWOT Analysis
- 6.2.9.4. Recent Developments
- 6.2.9.5. Financials (Based on Availability)
- 6.2.10 Samsung
- 6.2.10.1. Overview
- 6.2.10.2. Products
- 6.2.10.3. SWOT Analysis
- 6.2.10.4. Recent Developments
- 6.2.10.5. Financials (Based on Availability)
- 6.2.1 DBS Bank Ltd
List of Figures
- Figure 1: Singapore Payments Industry Revenue Breakdown (Million, %) by Product 2024 & 2032
- Figure 2: Singapore Payments Industry Share (%) by Company 2024
List of Tables
- Table 1: Singapore Payments Industry Revenue Million Forecast, by Region 2019 & 2032
- Table 2: Singapore Payments Industry Revenue Million Forecast, by Mode of Payment 2019 & 2032
- Table 3: Singapore Payments Industry Revenue Million Forecast, by End-user Industry 2019 & 2032
- Table 4: Singapore Payments Industry Revenue Million Forecast, by Region 2019 & 2032
- Table 5: Singapore Payments Industry Revenue Million Forecast, by Country 2019 & 2032
- Table 6: Singapore Payments Industry Revenue Million Forecast, by Mode of Payment 2019 & 2032
- Table 7: Singapore Payments Industry Revenue Million Forecast, by End-user Industry 2019 & 2032
- Table 8: Singapore Payments Industry Revenue Million Forecast, by Country 2019 & 2032
Frequently Asked Questions
1. What is the projected Compound Annual Growth Rate (CAGR) of the Singapore Payments Industry?
The projected CAGR is approximately 8.74%.
2. Which companies are prominent players in the Singapore Payments Industry?
Key companies in the market include DBS Bank Ltd, Fave, PayPal Holdings Inc, Google Pay, SingCash Pte Ltd, Amazon com Inc, Grab, Alipay, Apple Inc, Samsung.
3. What are the main segments of the Singapore Payments Industry?
The market segments include Mode of Payment, End-user Industry.
4. Can you provide details about the market size?
The market size is estimated to be USD 22.57 Million as of 2022.
5. What are some drivers contributing to market growth?
The payments market in Singapore is driven by boom in the e-commerce industry; Major retailers and the government are promoting Market Digitization through activation programs.; Increased use of real-time payments. specifically Buy Now Pay Later..
6. What are the notable trends driving market growth?
The payments market in Singapore is driven by boom in the e-commerce industry.
7. Are there any restraints impacting market growth?
High Costs of Equipment.
8. Can you provide examples of recent developments in the market?
January 2023: Samsung unveiled plans to expand the availability of the Samsung Wallet app to eight additional countries, with Singapore being among them. This versatile wallet application was introduced as a unified platform, offering users a secure storage solution for their digital keys, boarding passes, identification cards, and various other documents on their mobile devices.
9. What pricing options are available for accessing the report?
Pricing options include single-user, multi-user, and enterprise licenses priced at USD 3800, USD 4500, and USD 5800 respectively.
10. Is the market size provided in terms of value or volume?
The market size is provided in terms of value, measured in Million.
11. Are there any specific market keywords associated with the report?
Yes, the market keyword associated with the report is "Singapore Payments Industry," which aids in identifying and referencing the specific market segment covered.
12. How do I determine which pricing option suits my needs best?
The pricing options vary based on user requirements and access needs. Individual users may opt for single-user licenses, while businesses requiring broader access may choose multi-user or enterprise licenses for cost-effective access to the report.
13. Are there any additional resources or data provided in the Singapore Payments Industry report?
While the report offers comprehensive insights, it's advisable to review the specific contents or supplementary materials provided to ascertain if additional resources or data are available.
14. How can I stay updated on further developments or reports in the Singapore Payments Industry?
To stay informed about further developments, trends, and reports in the Singapore Payments Industry, consider subscribing to industry newsletters, following relevant companies and organizations, or regularly checking reputable industry news sources and publications.
Methodology
Step 1 - Identification of Relevant Samples Size from Population Database


Step 2 - Approaches for Defining Global Market Size (Value, Volume* & Price*)

Note*: In applicable scenarios
Step 3 - Data Sources
Primary Research
- Web Analytics
- Survey Reports
- Research Institute
- Latest Research Reports
- Opinion Leaders
Secondary Research
- Annual Reports
- White Paper
- Latest Press Release
- Industry Association
- Paid Database
- Investor Presentations

Step 4 - Data Triangulation
Involves using different sources of information in order to increase the validity of a study
These sources are likely to be stakeholders in a program - participants, other researchers, program staff, other community members, and so on.
Then we put all data in single framework & apply various statistical tools to find out the dynamic on the market.
During the analysis stage, feedback from the stakeholder groups would be compared to determine areas of agreement as well as areas of divergence
