

Key Insights
The global Safety IO Modules market is experiencing robust growth, projected to reach a substantial value by 2033. A Compound Annual Growth Rate (CAGR) of 5.85% from 2025 to 2033 indicates a consistent upward trajectory driven by several key factors. The increasing adoption of automation in industries like automotive, manufacturing, and healthcare necessitates reliable safety systems, fueling demand for these modules. Stringent safety regulations across various sectors further contribute to market expansion. The market is segmented by module type (analog, digital, and others), protection rating (IP20, IP67, and others), and end-user application (automotive, manufacturing, healthcare, energy & power, and others). The dominance of analog modules is gradually being challenged by digital modules due to their enhanced flexibility and data processing capabilities. Furthermore, the demand for higher protection ratings like IP67 is increasing in harsh industrial environments. Geographically, North America and Europe currently hold significant market shares, but the Asia-Pacific region is expected to witness substantial growth due to rapid industrialization and rising infrastructure development. Leading companies like Honeywell, ABB, Siemens, Schneider Electric, and others are actively involved in developing innovative safety IO modules, driving competition and technological advancements. The market faces some restraints, including high initial investment costs and the need for specialized technical expertise for installation and maintenance.
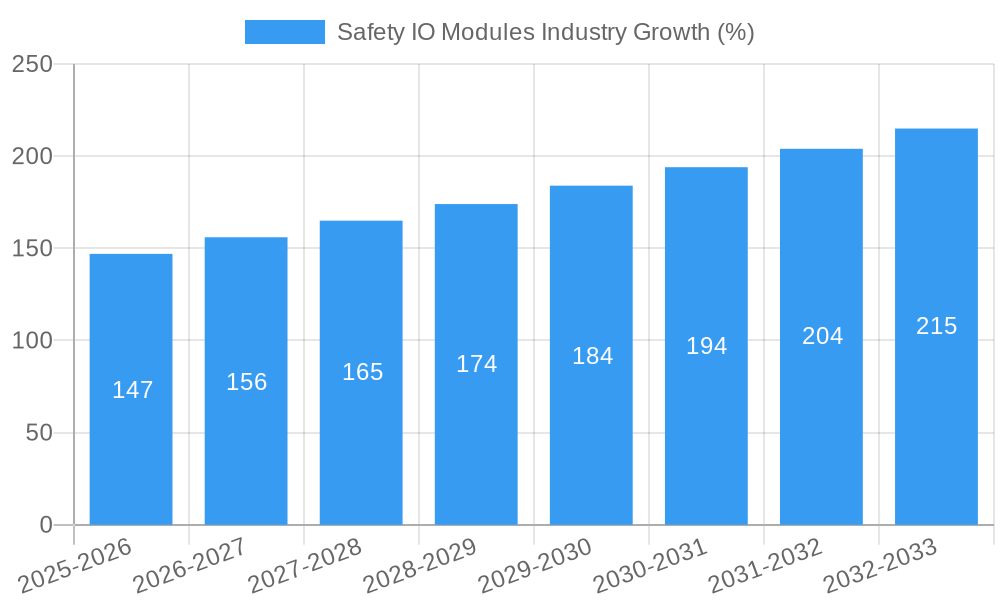
The forecast for 2025-2033 suggests a continued upward trend, though the rate of growth might fluctuate slightly year-on-year due to economic cycles and technological disruptions. However, the long-term outlook remains positive, with several factors expected to underpin consistent growth. The development of Industry 4.0 and IIoT is directly correlated with a rising need for sophisticated and dependable safety solutions. The increasing integration of safety functionalities within broader industrial automation systems, as well as the emergence of advanced communication protocols, will significantly shape future market developments. The ongoing focus on enhancing operational safety across various industries, in conjunction with continued technological innovation, positions the Safety IO Modules market for sustained growth in the coming years. The competitive landscape will likely see increased mergers and acquisitions as larger players strive to consolidate market share and broaden their product portfolios.
Safety IO Modules Industry Market Report: 2019-2033
This comprehensive report provides a detailed analysis of the Safety IO Modules industry, offering invaluable insights for stakeholders seeking to understand market dynamics, growth potential, and future opportunities. The report covers the period 2019-2033, with a focus on the estimated year 2025 and a forecast period spanning 2025-2033. The $XX Million market is poised for significant expansion, driven by technological advancements and increasing demand across diverse end-user applications.
Safety IO Modules Industry Market Composition & Trends
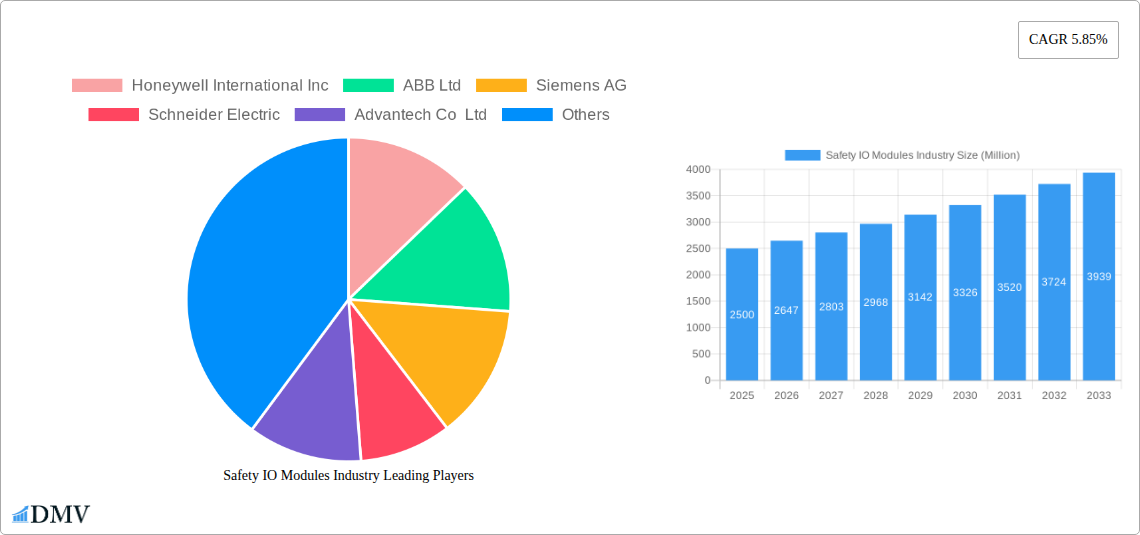
The Safety IO Modules market is characterized by a moderately consolidated structure, with key players like Honeywell International Inc, ABB Ltd, Siemens AG, Schneider Electric, and Rockwell Automation Inc holding significant market share. The market share distribution in 2025 is estimated as follows: Honeywell (18%), ABB (15%), Siemens (12%), Schneider Electric (10%), Rockwell Automation (8%), and others (37%). Innovation in safety protocols and communication technologies, such as the adoption of Ethernet/IP and PROFINET, are key catalysts driving market growth. Stringent safety regulations across various industries, particularly in automotive and manufacturing, are further shaping the market landscape. Substitute products, such as traditional relay-based systems, are gradually being replaced due to the superior performance and cost-effectiveness of Safety IO Modules. Mergers and acquisitions (M&A) activities are prevalent, with deal values exceeding $XX Million in the historical period (2019-2024), primarily focused on expanding product portfolios and geographical reach. End-user profiles are diverse, with significant demand from the automotive, manufacturing, and energy sectors.
- Market Concentration: Moderately consolidated, with top 5 players holding approximately 63% market share in 2025.
- Innovation Catalysts: Ethernet/IP, PROFINET adoption; advancements in functional safety standards.
- Regulatory Landscape: Stringent safety regulations in automotive, manufacturing, and other industries.
- Substitute Products: Traditional relay-based safety systems.
- M&A Activity: Deal values exceeding $XX Million (2019-2024), focused on portfolio expansion and geographical reach.
Safety IO Modules Industry Industry Evolution
The Safety IO Modules market has witnessed robust growth in the historical period (2019-2024), with a Compound Annual Growth Rate (CAGR) of XX%. This growth trajectory is expected to continue during the forecast period (2025-2033), driven by several factors. The increasing automation across industries, the rising demand for enhanced safety features in industrial equipment, and the growing adoption of Industry 4.0 technologies are significant contributors to market expansion. Technological advancements, including the development of more compact and efficient modules with improved communication capabilities, are enhancing market appeal. Shifting consumer demands are focusing on increased functionality, improved reliability, and enhanced cybersecurity features. The adoption rate of advanced safety features in various applications is accelerating, particularly within the automotive and manufacturing sectors. By 2033, the market is projected to reach $XX Million, indicating a substantial increase from the 2025 estimated value of $XX Million.
Leading Regions, Countries, or Segments in Safety IO Modules Industry
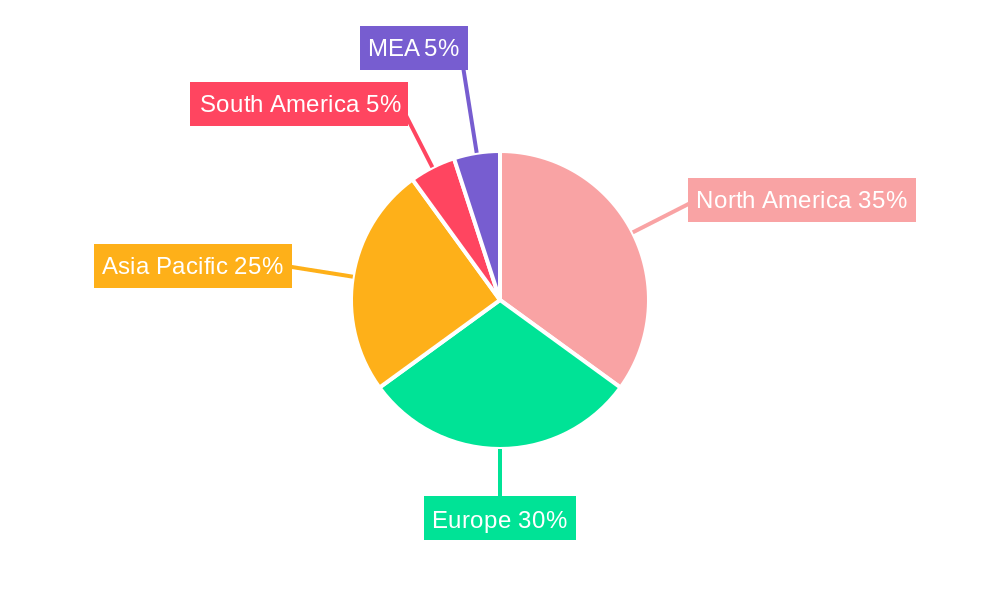
The manufacturing sector in North America is currently the dominant end-user segment, driven by robust industrial automation and significant investments in upgrading safety systems. Europe follows closely, driven by strong regulatory frameworks and a mature industrial base. Asia-Pacific is experiencing rapid growth, fueled by industrialization and increasing adoption of advanced technologies.
- Dominant Region: North America (manufacturing sector).
- Key Drivers (North America): High industrial automation levels, significant investments in safety upgrades.
- Key Drivers (Europe): Strong regulatory environment, mature industrial base.
- Key Drivers (Asia-Pacific): Rapid industrialization, increasing adoption of advanced technologies.
- Dominant Type: Digital Modules (XX% market share in 2025) due to flexibility and advanced features.
- Dominant Rating: IP 20 (XX% market share in 2025) due to widespread applicability in controlled environments.
In-depth Analysis: The dominance of digital modules stems from their superior flexibility, advanced features, and ability to integrate seamlessly with modern industrial automation systems. The popularity of IP 20 rated modules reflects their suitability for many indoor industrial applications where protection against water ingress is less critical than other safety considerations. However, the market share of IP 67 rated modules is expected to grow steadily due to increasing requirements for protection in harsh environments.
Safety IO Modules Industry Product Innovations
Recent product innovations have focused on enhancing safety, reliability, and ease of integration. Miniaturization of modules, improved diagnostic capabilities, and integrated cybersecurity features are key advancements. Unique selling propositions (USPs) include increased channel density, simplified wiring, and remote monitoring capabilities. These innovations are driving the adoption of Safety IO Modules in diverse applications, boosting overall market growth.
Propelling Factors for Safety IO Modules Industry Growth
Several factors are propelling the growth of the Safety IO Modules industry. Technological advancements, like the development of more efficient and compact modules, are enhancing performance and reducing costs. Government regulations mandating improved safety standards across various sectors are driving adoption. Strong economic growth in major industrial economies is fueling investment in automation and safety systems.
Obstacles in the Safety IO Modules Industry Market
The Safety IO Modules market faces challenges such as stringent safety certification processes, which can increase development costs and time-to-market. Supply chain disruptions can impact production and availability, while intense competition among established players and new entrants create pricing pressures.
Future Opportunities in Safety IO Modules Industry
Emerging opportunities include the expansion into new markets such as renewable energy and smart grids. The integration of advanced technologies like AI and machine learning offers potential for improved safety and efficiency. Growing consumer focus on safety and sustainability will further drive market growth.
Major Players in the Safety IO Modules Industry Ecosystem
- Honeywell International Inc
- ABB Ltd
- Siemens AG
- Schneider Electric
- Advantech Co Ltd
- Rockwell Automation Inc
- Weidmuller Interface GmbH & Co KG
- Parmley Graham Ltd
Key Developments in Safety IO Modules Industry Industry
- Q1 2023: Honeywell launched a new series of compact Safety IO Modules with integrated cybersecurity features.
- Q3 2022: ABB acquired a smaller competitor, expanding its product portfolio.
- Q4 2021: Siemens introduced a new generation of Safety IO Modules with enhanced diagnostic capabilities.
Strategic Safety IO Modules Industry Market Forecast
The Safety IO Modules market is poised for continued growth, driven by technological advancements, increasing safety regulations, and rising demand across various end-user industries. The market's potential is significant, with substantial opportunities for innovation and expansion into new applications. The forecast period (2025-2033) promises robust growth, driven by industry trends and technological advancements.
Safety IO Modules Industry Segmentation
-
1. Type
- 1.1. Analog Modules
- 1.2. Digital Modules
- 1.3. Other Types
-
2. Ratings
- 2.1. IP 20
- 2.2. IP 67
- 2.3. Other Ratings
-
3. End-user Application
- 3.1. Automotive
- 3.2. Manufacturing
- 3.3. Healthcare
- 3.4. Energy and Power
- 3.5. Other End-user Applications
Safety IO Modules Industry Segmentation By Geography
-
1. North America
- 1.1. United States
- 1.2. Canada
-
2. Europe
- 2.1. United Kingdom
- 2.2. Germany
- 2.3. France
- 2.4. Rest of Europe
-
3. Asia Pacific
- 3.1. China
- 3.2. Japan
- 3.3. India
- 3.4. Rest of Asia Pacific
- 4. Rest of the World
Safety IO Modules Industry REPORT HIGHLIGHTS
| Aspects | Details |
|---|---|
| Study Period | 2019-2033 |
| Base Year | 2024 |
| Estimated Year | 2025 |
| Forecast Period | 2025-2033 |
| Historical Period | 2019-2024 |
| Growth Rate | CAGR of 5.85% from 2019-2033 |
| Segmentation |
|
Table of Contents
- 1. Introduction
- 1.1. Research Scope
- 1.2. Market Segmentation
- 1.3. Research Methodology
- 1.4. Definitions and Assumptions
- 2. Executive Summary
- 2.1. Introduction
- 3. Market Dynamics
- 3.1. Introduction
- 3.2. Market Drivers
- 3.2.1. ; Demand for Faster Start-up Machine Time; Reduced Hardware and Wiring Costs; Miniaturization and Variable Designs
- 3.3. Market Restrains
- 3.3.1. ; Complexity of Standards and Lack of Awareness
- 3.4. Market Trends
- 3.4.1. Increasing Demand of Safety IO Modules in Automotive Industry to Drive the Market Growth
- 4. Market Factor Analysis
- 4.1. Porters Five Forces
- 4.2. Supply/Value Chain
- 4.3. PESTEL analysis
- 4.4. Market Entropy
- 4.5. Patent/Trademark Analysis
- 5. Global Safety IO Modules Industry Analysis, Insights and Forecast, 2019-2031
- 5.1. Market Analysis, Insights and Forecast - by Type
- 5.1.1. Analog Modules
- 5.1.2. Digital Modules
- 5.1.3. Other Types
- 5.2. Market Analysis, Insights and Forecast - by Ratings
- 5.2.1. IP 20
- 5.2.2. IP 67
- 5.2.3. Other Ratings
- 5.3. Market Analysis, Insights and Forecast - by End-user Application
- 5.3.1. Automotive
- 5.3.2. Manufacturing
- 5.3.3. Healthcare
- 5.3.4. Energy and Power
- 5.3.5. Other End-user Applications
- 5.4. Market Analysis, Insights and Forecast - by Region
- 5.4.1. North America
- 5.4.2. Europe
- 5.4.3. Asia Pacific
- 5.4.4. Rest of the World
- 5.1. Market Analysis, Insights and Forecast - by Type
- 6. North America Safety IO Modules Industry Analysis, Insights and Forecast, 2019-2031
- 6.1. Market Analysis, Insights and Forecast - by Type
- 6.1.1. Analog Modules
- 6.1.2. Digital Modules
- 6.1.3. Other Types
- 6.2. Market Analysis, Insights and Forecast - by Ratings
- 6.2.1. IP 20
- 6.2.2. IP 67
- 6.2.3. Other Ratings
- 6.3. Market Analysis, Insights and Forecast - by End-user Application
- 6.3.1. Automotive
- 6.3.2. Manufacturing
- 6.3.3. Healthcare
- 6.3.4. Energy and Power
- 6.3.5. Other End-user Applications
- 6.1. Market Analysis, Insights and Forecast - by Type
- 7. Europe Safety IO Modules Industry Analysis, Insights and Forecast, 2019-2031
- 7.1. Market Analysis, Insights and Forecast - by Type
- 7.1.1. Analog Modules
- 7.1.2. Digital Modules
- 7.1.3. Other Types
- 7.2. Market Analysis, Insights and Forecast - by Ratings
- 7.2.1. IP 20
- 7.2.2. IP 67
- 7.2.3. Other Ratings
- 7.3. Market Analysis, Insights and Forecast - by End-user Application
- 7.3.1. Automotive
- 7.3.2. Manufacturing
- 7.3.3. Healthcare
- 7.3.4. Energy and Power
- 7.3.5. Other End-user Applications
- 7.1. Market Analysis, Insights and Forecast - by Type
- 8. Asia Pacific Safety IO Modules Industry Analysis, Insights and Forecast, 2019-2031
- 8.1. Market Analysis, Insights and Forecast - by Type
- 8.1.1. Analog Modules
- 8.1.2. Digital Modules
- 8.1.3. Other Types
- 8.2. Market Analysis, Insights and Forecast - by Ratings
- 8.2.1. IP 20
- 8.2.2. IP 67
- 8.2.3. Other Ratings
- 8.3. Market Analysis, Insights and Forecast - by End-user Application
- 8.3.1. Automotive
- 8.3.2. Manufacturing
- 8.3.3. Healthcare
- 8.3.4. Energy and Power
- 8.3.5. Other End-user Applications
- 8.1. Market Analysis, Insights and Forecast - by Type
- 9. Rest of the World Safety IO Modules Industry Analysis, Insights and Forecast, 2019-2031
- 9.1. Market Analysis, Insights and Forecast - by Type
- 9.1.1. Analog Modules
- 9.1.2. Digital Modules
- 9.1.3. Other Types
- 9.2. Market Analysis, Insights and Forecast - by Ratings
- 9.2.1. IP 20
- 9.2.2. IP 67
- 9.2.3. Other Ratings
- 9.3. Market Analysis, Insights and Forecast - by End-user Application
- 9.3.1. Automotive
- 9.3.2. Manufacturing
- 9.3.3. Healthcare
- 9.3.4. Energy and Power
- 9.3.5. Other End-user Applications
- 9.1. Market Analysis, Insights and Forecast - by Type
- 10. North America Safety IO Modules Industry Analysis, Insights and Forecast, 2019-2031
- 10.1. Market Analysis, Insights and Forecast - By Country/Sub-region
- 10.1.1. undefined
- 11. Europe Safety IO Modules Industry Analysis, Insights and Forecast, 2019-2031
- 11.1. Market Analysis, Insights and Forecast - By Country/Sub-region
- 11.1.1. undefined
- 12. Asia Pacific Safety IO Modules Industry Analysis, Insights and Forecast, 2019-2031
- 12.1. Market Analysis, Insights and Forecast - By Country/Sub-region
- 12.1.1. undefined
- 13. South America Safety IO Modules Industry Analysis, Insights and Forecast, 2019-2031
- 13.1. Market Analysis, Insights and Forecast - By Country/Sub-region
- 13.1.1. undefined
- 14. North America Safety IO Modules Industry Analysis, Insights and Forecast, 2019-2031
- 14.1. Market Analysis, Insights and Forecast - By Country/Sub-region
- 14.1.1. undefined
- 15. MEA Safety IO Modules Industry Analysis, Insights and Forecast, 2019-2031
- 15.1. Market Analysis, Insights and Forecast - By Country/Sub-region
- 15.1.1. undefined
- 16. Competitive Analysis
- 16.1. Global Market Share Analysis 2024
- 16.2. Company Profiles
- 16.2.1 Honeywell International Inc
- 16.2.1.1. Overview
- 16.2.1.2. Products
- 16.2.1.3. SWOT Analysis
- 16.2.1.4. Recent Developments
- 16.2.1.5. Financials (Based on Availability)
- 16.2.2 ABB Ltd
- 16.2.2.1. Overview
- 16.2.2.2. Products
- 16.2.2.3. SWOT Analysis
- 16.2.2.4. Recent Developments
- 16.2.2.5. Financials (Based on Availability)
- 16.2.3 Siemens AG
- 16.2.3.1. Overview
- 16.2.3.2. Products
- 16.2.3.3. SWOT Analysis
- 16.2.3.4. Recent Developments
- 16.2.3.5. Financials (Based on Availability)
- 16.2.4 Schneider Electric
- 16.2.4.1. Overview
- 16.2.4.2. Products
- 16.2.4.3. SWOT Analysis
- 16.2.4.4. Recent Developments
- 16.2.4.5. Financials (Based on Availability)
- 16.2.5 Advantech Co Ltd
- 16.2.5.1. Overview
- 16.2.5.2. Products
- 16.2.5.3. SWOT Analysis
- 16.2.5.4. Recent Developments
- 16.2.5.5. Financials (Based on Availability)
- 16.2.6 Rockwell Automation Inc
- 16.2.6.1. Overview
- 16.2.6.2. Products
- 16.2.6.3. SWOT Analysis
- 16.2.6.4. Recent Developments
- 16.2.6.5. Financials (Based on Availability)
- 16.2.7 Weidmuller Interface GmbH & Co KG
- 16.2.7.1. Overview
- 16.2.7.2. Products
- 16.2.7.3. SWOT Analysis
- 16.2.7.4. Recent Developments
- 16.2.7.5. Financials (Based on Availability)
- 16.2.8 Parmley Graham Ltd
- 16.2.8.1. Overview
- 16.2.8.2. Products
- 16.2.8.3. SWOT Analysis
- 16.2.8.4. Recent Developments
- 16.2.8.5. Financials (Based on Availability)
- 16.2.1 Honeywell International Inc
List of Figures
- Figure 1: Global Safety IO Modules Industry Revenue Breakdown (Million, %) by Region 2024 & 2032
- Figure 2: Global Safety IO Modules Industry Volume Breakdown (K Unit, %) by Region 2024 & 2032
- Figure 3: North America Safety IO Modules Industry Revenue (Million), by Country 2024 & 2032
- Figure 4: North America Safety IO Modules Industry Volume (K Unit), by Country 2024 & 2032
- Figure 5: North America Safety IO Modules Industry Revenue Share (%), by Country 2024 & 2032
- Figure 6: North America Safety IO Modules Industry Volume Share (%), by Country 2024 & 2032
- Figure 7: Europe Safety IO Modules Industry Revenue (Million), by Country 2024 & 2032
- Figure 8: Europe Safety IO Modules Industry Volume (K Unit), by Country 2024 & 2032
- Figure 9: Europe Safety IO Modules Industry Revenue Share (%), by Country 2024 & 2032
- Figure 10: Europe Safety IO Modules Industry Volume Share (%), by Country 2024 & 2032
- Figure 11: Asia Pacific Safety IO Modules Industry Revenue (Million), by Country 2024 & 2032
- Figure 12: Asia Pacific Safety IO Modules Industry Volume (K Unit), by Country 2024 & 2032
- Figure 13: Asia Pacific Safety IO Modules Industry Revenue Share (%), by Country 2024 & 2032
- Figure 14: Asia Pacific Safety IO Modules Industry Volume Share (%), by Country 2024 & 2032
- Figure 15: South America Safety IO Modules Industry Revenue (Million), by Country 2024 & 2032
- Figure 16: South America Safety IO Modules Industry Volume (K Unit), by Country 2024 & 2032
- Figure 17: South America Safety IO Modules Industry Revenue Share (%), by Country 2024 & 2032
- Figure 18: South America Safety IO Modules Industry Volume Share (%), by Country 2024 & 2032
- Figure 19: North America Safety IO Modules Industry Revenue (Million), by Country 2024 & 2032
- Figure 20: North America Safety IO Modules Industry Volume (K Unit), by Country 2024 & 2032
- Figure 21: North America Safety IO Modules Industry Revenue Share (%), by Country 2024 & 2032
- Figure 22: North America Safety IO Modules Industry Volume Share (%), by Country 2024 & 2032
- Figure 23: MEA Safety IO Modules Industry Revenue (Million), by Country 2024 & 2032
- Figure 24: MEA Safety IO Modules Industry Volume (K Unit), by Country 2024 & 2032
- Figure 25: MEA Safety IO Modules Industry Revenue Share (%), by Country 2024 & 2032
- Figure 26: MEA Safety IO Modules Industry Volume Share (%), by Country 2024 & 2032
- Figure 27: North America Safety IO Modules Industry Revenue (Million), by Type 2024 & 2032
- Figure 28: North America Safety IO Modules Industry Volume (K Unit), by Type 2024 & 2032
- Figure 29: North America Safety IO Modules Industry Revenue Share (%), by Type 2024 & 2032
- Figure 30: North America Safety IO Modules Industry Volume Share (%), by Type 2024 & 2032
- Figure 31: North America Safety IO Modules Industry Revenue (Million), by Ratings 2024 & 2032
- Figure 32: North America Safety IO Modules Industry Volume (K Unit), by Ratings 2024 & 2032
- Figure 33: North America Safety IO Modules Industry Revenue Share (%), by Ratings 2024 & 2032
- Figure 34: North America Safety IO Modules Industry Volume Share (%), by Ratings 2024 & 2032
- Figure 35: North America Safety IO Modules Industry Revenue (Million), by End-user Application 2024 & 2032
- Figure 36: North America Safety IO Modules Industry Volume (K Unit), by End-user Application 2024 & 2032
- Figure 37: North America Safety IO Modules Industry Revenue Share (%), by End-user Application 2024 & 2032
- Figure 38: North America Safety IO Modules Industry Volume Share (%), by End-user Application 2024 & 2032
- Figure 39: North America Safety IO Modules Industry Revenue (Million), by Country 2024 & 2032
- Figure 40: North America Safety IO Modules Industry Volume (K Unit), by Country 2024 & 2032
- Figure 41: North America Safety IO Modules Industry Revenue Share (%), by Country 2024 & 2032
- Figure 42: North America Safety IO Modules Industry Volume Share (%), by Country 2024 & 2032
- Figure 43: Europe Safety IO Modules Industry Revenue (Million), by Type 2024 & 2032
- Figure 44: Europe Safety IO Modules Industry Volume (K Unit), by Type 2024 & 2032
- Figure 45: Europe Safety IO Modules Industry Revenue Share (%), by Type 2024 & 2032
- Figure 46: Europe Safety IO Modules Industry Volume Share (%), by Type 2024 & 2032
- Figure 47: Europe Safety IO Modules Industry Revenue (Million), by Ratings 2024 & 2032
- Figure 48: Europe Safety IO Modules Industry Volume (K Unit), by Ratings 2024 & 2032
- Figure 49: Europe Safety IO Modules Industry Revenue Share (%), by Ratings 2024 & 2032
- Figure 50: Europe Safety IO Modules Industry Volume Share (%), by Ratings 2024 & 2032
- Figure 51: Europe Safety IO Modules Industry Revenue (Million), by End-user Application 2024 & 2032
- Figure 52: Europe Safety IO Modules Industry Volume (K Unit), by End-user Application 2024 & 2032
- Figure 53: Europe Safety IO Modules Industry Revenue Share (%), by End-user Application 2024 & 2032
- Figure 54: Europe Safety IO Modules Industry Volume Share (%), by End-user Application 2024 & 2032
- Figure 55: Europe Safety IO Modules Industry Revenue (Million), by Country 2024 & 2032
- Figure 56: Europe Safety IO Modules Industry Volume (K Unit), by Country 2024 & 2032
- Figure 57: Europe Safety IO Modules Industry Revenue Share (%), by Country 2024 & 2032
- Figure 58: Europe Safety IO Modules Industry Volume Share (%), by Country 2024 & 2032
- Figure 59: Asia Pacific Safety IO Modules Industry Revenue (Million), by Type 2024 & 2032
- Figure 60: Asia Pacific Safety IO Modules Industry Volume (K Unit), by Type 2024 & 2032
- Figure 61: Asia Pacific Safety IO Modules Industry Revenue Share (%), by Type 2024 & 2032
- Figure 62: Asia Pacific Safety IO Modules Industry Volume Share (%), by Type 2024 & 2032
- Figure 63: Asia Pacific Safety IO Modules Industry Revenue (Million), by Ratings 2024 & 2032
- Figure 64: Asia Pacific Safety IO Modules Industry Volume (K Unit), by Ratings 2024 & 2032
- Figure 65: Asia Pacific Safety IO Modules Industry Revenue Share (%), by Ratings 2024 & 2032
- Figure 66: Asia Pacific Safety IO Modules Industry Volume Share (%), by Ratings 2024 & 2032
- Figure 67: Asia Pacific Safety IO Modules Industry Revenue (Million), by End-user Application 2024 & 2032
- Figure 68: Asia Pacific Safety IO Modules Industry Volume (K Unit), by End-user Application 2024 & 2032
- Figure 69: Asia Pacific Safety IO Modules Industry Revenue Share (%), by End-user Application 2024 & 2032
- Figure 70: Asia Pacific Safety IO Modules Industry Volume Share (%), by End-user Application 2024 & 2032
- Figure 71: Asia Pacific Safety IO Modules Industry Revenue (Million), by Country 2024 & 2032
- Figure 72: Asia Pacific Safety IO Modules Industry Volume (K Unit), by Country 2024 & 2032
- Figure 73: Asia Pacific Safety IO Modules Industry Revenue Share (%), by Country 2024 & 2032
- Figure 74: Asia Pacific Safety IO Modules Industry Volume Share (%), by Country 2024 & 2032
- Figure 75: Rest of the World Safety IO Modules Industry Revenue (Million), by Type 2024 & 2032
- Figure 76: Rest of the World Safety IO Modules Industry Volume (K Unit), by Type 2024 & 2032
- Figure 77: Rest of the World Safety IO Modules Industry Revenue Share (%), by Type 2024 & 2032
- Figure 78: Rest of the World Safety IO Modules Industry Volume Share (%), by Type 2024 & 2032
- Figure 79: Rest of the World Safety IO Modules Industry Revenue (Million), by Ratings 2024 & 2032
- Figure 80: Rest of the World Safety IO Modules Industry Volume (K Unit), by Ratings 2024 & 2032
- Figure 81: Rest of the World Safety IO Modules Industry Revenue Share (%), by Ratings 2024 & 2032
- Figure 82: Rest of the World Safety IO Modules Industry Volume Share (%), by Ratings 2024 & 2032
- Figure 83: Rest of the World Safety IO Modules Industry Revenue (Million), by End-user Application 2024 & 2032
- Figure 84: Rest of the World Safety IO Modules Industry Volume (K Unit), by End-user Application 2024 & 2032
- Figure 85: Rest of the World Safety IO Modules Industry Revenue Share (%), by End-user Application 2024 & 2032
- Figure 86: Rest of the World Safety IO Modules Industry Volume Share (%), by End-user Application 2024 & 2032
- Figure 87: Rest of the World Safety IO Modules Industry Revenue (Million), by Country 2024 & 2032
- Figure 88: Rest of the World Safety IO Modules Industry Volume (K Unit), by Country 2024 & 2032
- Figure 89: Rest of the World Safety IO Modules Industry Revenue Share (%), by Country 2024 & 2032
- Figure 90: Rest of the World Safety IO Modules Industry Volume Share (%), by Country 2024 & 2032
List of Tables
- Table 1: Global Safety IO Modules Industry Revenue Million Forecast, by Region 2019 & 2032
- Table 2: Global Safety IO Modules Industry Volume K Unit Forecast, by Region 2019 & 2032
- Table 3: Global Safety IO Modules Industry Revenue Million Forecast, by Type 2019 & 2032
- Table 4: Global Safety IO Modules Industry Volume K Unit Forecast, by Type 2019 & 2032
- Table 5: Global Safety IO Modules Industry Revenue Million Forecast, by Ratings 2019 & 2032
- Table 6: Global Safety IO Modules Industry Volume K Unit Forecast, by Ratings 2019 & 2032
- Table 7: Global Safety IO Modules Industry Revenue Million Forecast, by End-user Application 2019 & 2032
- Table 8: Global Safety IO Modules Industry Volume K Unit Forecast, by End-user Application 2019 & 2032
- Table 9: Global Safety IO Modules Industry Revenue Million Forecast, by Region 2019 & 2032
- Table 10: Global Safety IO Modules Industry Volume K Unit Forecast, by Region 2019 & 2032
- Table 11: Global Safety IO Modules Industry Revenue Million Forecast, by Country 2019 & 2032
- Table 12: Global Safety IO Modules Industry Volume K Unit Forecast, by Country 2019 & 2032
- Table 13: Global Safety IO Modules Industry Revenue Million Forecast, by Country 2019 & 2032
- Table 14: Global Safety IO Modules Industry Volume K Unit Forecast, by Country 2019 & 2032
- Table 15: Global Safety IO Modules Industry Revenue Million Forecast, by Country 2019 & 2032
- Table 16: Global Safety IO Modules Industry Volume K Unit Forecast, by Country 2019 & 2032
- Table 17: Global Safety IO Modules Industry Revenue Million Forecast, by Country 2019 & 2032
- Table 18: Global Safety IO Modules Industry Volume K Unit Forecast, by Country 2019 & 2032
- Table 19: Global Safety IO Modules Industry Revenue Million Forecast, by Country 2019 & 2032
- Table 20: Global Safety IO Modules Industry Volume K Unit Forecast, by Country 2019 & 2032
- Table 21: Global Safety IO Modules Industry Revenue Million Forecast, by Country 2019 & 2032
- Table 22: Global Safety IO Modules Industry Volume K Unit Forecast, by Country 2019 & 2032
- Table 23: Global Safety IO Modules Industry Revenue Million Forecast, by Type 2019 & 2032
- Table 24: Global Safety IO Modules Industry Volume K Unit Forecast, by Type 2019 & 2032
- Table 25: Global Safety IO Modules Industry Revenue Million Forecast, by Ratings 2019 & 2032
- Table 26: Global Safety IO Modules Industry Volume K Unit Forecast, by Ratings 2019 & 2032
- Table 27: Global Safety IO Modules Industry Revenue Million Forecast, by End-user Application 2019 & 2032
- Table 28: Global Safety IO Modules Industry Volume K Unit Forecast, by End-user Application 2019 & 2032
- Table 29: Global Safety IO Modules Industry Revenue Million Forecast, by Country 2019 & 2032
- Table 30: Global Safety IO Modules Industry Volume K Unit Forecast, by Country 2019 & 2032
- Table 31: United States Safety IO Modules Industry Revenue (Million) Forecast, by Application 2019 & 2032
- Table 32: United States Safety IO Modules Industry Volume (K Unit) Forecast, by Application 2019 & 2032
- Table 33: Canada Safety IO Modules Industry Revenue (Million) Forecast, by Application 2019 & 2032
- Table 34: Canada Safety IO Modules Industry Volume (K Unit) Forecast, by Application 2019 & 2032
- Table 35: Global Safety IO Modules Industry Revenue Million Forecast, by Type 2019 & 2032
- Table 36: Global Safety IO Modules Industry Volume K Unit Forecast, by Type 2019 & 2032
- Table 37: Global Safety IO Modules Industry Revenue Million Forecast, by Ratings 2019 & 2032
- Table 38: Global Safety IO Modules Industry Volume K Unit Forecast, by Ratings 2019 & 2032
- Table 39: Global Safety IO Modules Industry Revenue Million Forecast, by End-user Application 2019 & 2032
- Table 40: Global Safety IO Modules Industry Volume K Unit Forecast, by End-user Application 2019 & 2032
- Table 41: Global Safety IO Modules Industry Revenue Million Forecast, by Country 2019 & 2032
- Table 42: Global Safety IO Modules Industry Volume K Unit Forecast, by Country 2019 & 2032
- Table 43: United Kingdom Safety IO Modules Industry Revenue (Million) Forecast, by Application 2019 & 2032
- Table 44: United Kingdom Safety IO Modules Industry Volume (K Unit) Forecast, by Application 2019 & 2032
- Table 45: Germany Safety IO Modules Industry Revenue (Million) Forecast, by Application 2019 & 2032
- Table 46: Germany Safety IO Modules Industry Volume (K Unit) Forecast, by Application 2019 & 2032
- Table 47: France Safety IO Modules Industry Revenue (Million) Forecast, by Application 2019 & 2032
- Table 48: France Safety IO Modules Industry Volume (K Unit) Forecast, by Application 2019 & 2032
- Table 49: Rest of Europe Safety IO Modules Industry Revenue (Million) Forecast, by Application 2019 & 2032
- Table 50: Rest of Europe Safety IO Modules Industry Volume (K Unit) Forecast, by Application 2019 & 2032
- Table 51: Global Safety IO Modules Industry Revenue Million Forecast, by Type 2019 & 2032
- Table 52: Global Safety IO Modules Industry Volume K Unit Forecast, by Type 2019 & 2032
- Table 53: Global Safety IO Modules Industry Revenue Million Forecast, by Ratings 2019 & 2032
- Table 54: Global Safety IO Modules Industry Volume K Unit Forecast, by Ratings 2019 & 2032
- Table 55: Global Safety IO Modules Industry Revenue Million Forecast, by End-user Application 2019 & 2032
- Table 56: Global Safety IO Modules Industry Volume K Unit Forecast, by End-user Application 2019 & 2032
- Table 57: Global Safety IO Modules Industry Revenue Million Forecast, by Country 2019 & 2032
- Table 58: Global Safety IO Modules Industry Volume K Unit Forecast, by Country 2019 & 2032
- Table 59: China Safety IO Modules Industry Revenue (Million) Forecast, by Application 2019 & 2032
- Table 60: China Safety IO Modules Industry Volume (K Unit) Forecast, by Application 2019 & 2032
- Table 61: Japan Safety IO Modules Industry Revenue (Million) Forecast, by Application 2019 & 2032
- Table 62: Japan Safety IO Modules Industry Volume (K Unit) Forecast, by Application 2019 & 2032
- Table 63: India Safety IO Modules Industry Revenue (Million) Forecast, by Application 2019 & 2032
- Table 64: India Safety IO Modules Industry Volume (K Unit) Forecast, by Application 2019 & 2032
- Table 65: Rest of Asia Pacific Safety IO Modules Industry Revenue (Million) Forecast, by Application 2019 & 2032
- Table 66: Rest of Asia Pacific Safety IO Modules Industry Volume (K Unit) Forecast, by Application 2019 & 2032
- Table 67: Global Safety IO Modules Industry Revenue Million Forecast, by Type 2019 & 2032
- Table 68: Global Safety IO Modules Industry Volume K Unit Forecast, by Type 2019 & 2032
- Table 69: Global Safety IO Modules Industry Revenue Million Forecast, by Ratings 2019 & 2032
- Table 70: Global Safety IO Modules Industry Volume K Unit Forecast, by Ratings 2019 & 2032
- Table 71: Global Safety IO Modules Industry Revenue Million Forecast, by End-user Application 2019 & 2032
- Table 72: Global Safety IO Modules Industry Volume K Unit Forecast, by End-user Application 2019 & 2032
- Table 73: Global Safety IO Modules Industry Revenue Million Forecast, by Country 2019 & 2032
- Table 74: Global Safety IO Modules Industry Volume K Unit Forecast, by Country 2019 & 2032
Frequently Asked Questions
1. What is the projected Compound Annual Growth Rate (CAGR) of the Safety IO Modules Industry?
The projected CAGR is approximately 5.85%.
2. Which companies are prominent players in the Safety IO Modules Industry?
Key companies in the market include Honeywell International Inc, ABB Ltd, Siemens AG, Schneider Electric, Advantech Co Ltd, Rockwell Automation Inc, Weidmuller Interface GmbH & Co KG, Parmley Graham Ltd.
3. What are the main segments of the Safety IO Modules Industry?
The market segments include Type, Ratings, End-user Application.
4. Can you provide details about the market size?
The market size is estimated to be USD XX Million as of 2022.
5. What are some drivers contributing to market growth?
; Demand for Faster Start-up Machine Time; Reduced Hardware and Wiring Costs; Miniaturization and Variable Designs.
6. What are the notable trends driving market growth?
Increasing Demand of Safety IO Modules in Automotive Industry to Drive the Market Growth.
7. Are there any restraints impacting market growth?
; Complexity of Standards and Lack of Awareness.
8. Can you provide examples of recent developments in the market?
N/A
9. What pricing options are available for accessing the report?
Pricing options include single-user, multi-user, and enterprise licenses priced at USD 4750, USD 5250, and USD 8750 respectively.
10. Is the market size provided in terms of value or volume?
The market size is provided in terms of value, measured in Million and volume, measured in K Unit.
11. Are there any specific market keywords associated with the report?
Yes, the market keyword associated with the report is "Safety IO Modules Industry," which aids in identifying and referencing the specific market segment covered.
12. How do I determine which pricing option suits my needs best?
The pricing options vary based on user requirements and access needs. Individual users may opt for single-user licenses, while businesses requiring broader access may choose multi-user or enterprise licenses for cost-effective access to the report.
13. Are there any additional resources or data provided in the Safety IO Modules Industry report?
While the report offers comprehensive insights, it's advisable to review the specific contents or supplementary materials provided to ascertain if additional resources or data are available.
14. How can I stay updated on further developments or reports in the Safety IO Modules Industry?
To stay informed about further developments, trends, and reports in the Safety IO Modules Industry, consider subscribing to industry newsletters, following relevant companies and organizations, or regularly checking reputable industry news sources and publications.
Methodology
Step 1 - Identification of Relevant Samples Size from Population Database


Step 2 - Approaches for Defining Global Market Size (Value, Volume* & Price*)

Note*: In applicable scenarios
Step 3 - Data Sources
Primary Research
- Web Analytics
- Survey Reports
- Research Institute
- Latest Research Reports
- Opinion Leaders
Secondary Research
- Annual Reports
- White Paper
- Latest Press Release
- Industry Association
- Paid Database
- Investor Presentations

Step 4 - Data Triangulation
Involves using different sources of information in order to increase the validity of a study
These sources are likely to be stakeholders in a program - participants, other researchers, program staff, other community members, and so on.
Then we put all data in single framework & apply various statistical tools to find out the dynamic on the market.
During the analysis stage, feedback from the stakeholder groups would be compared to determine areas of agreement as well as areas of divergence
