

Key Insights
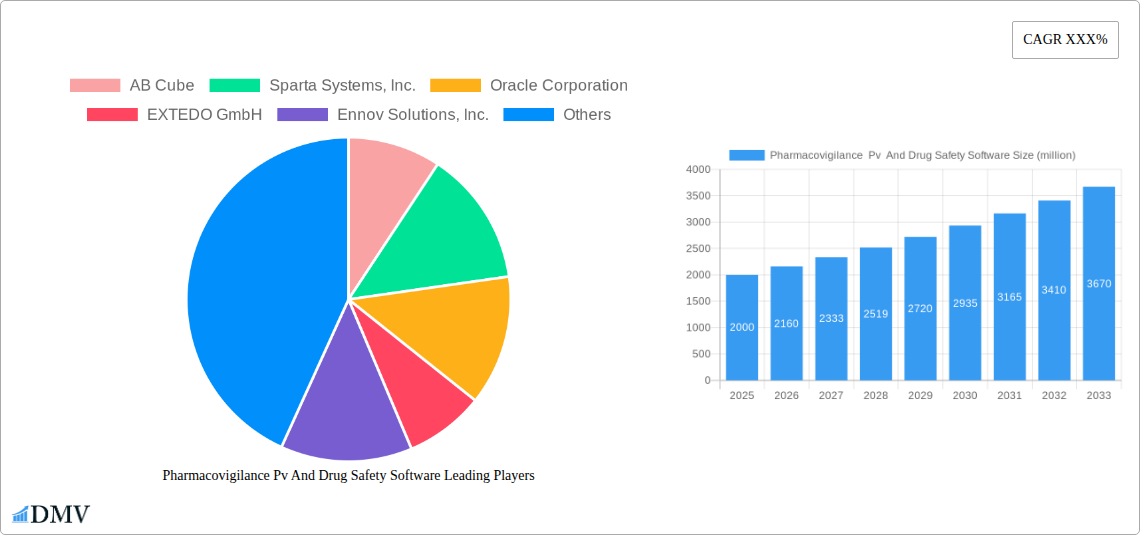
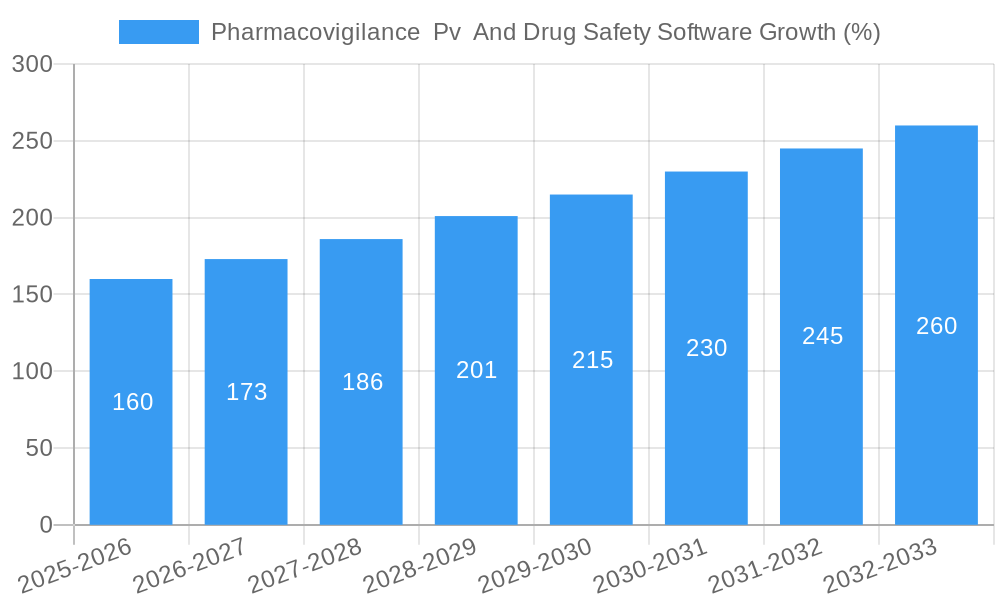
The Pharmacovigilance (PV) and Drug Safety Software market is experiencing robust growth, driven by increasing regulatory scrutiny, rising drug development costs, and the need for efficient adverse event reporting and analysis. The market, estimated at $2 billion in 2025, is projected to experience a Compound Annual Growth Rate (CAGR) of 8% from 2025 to 2033, reaching approximately $3.5 billion by 2033. This growth is fueled by several key trends, including the adoption of cloud-based solutions for improved scalability and accessibility, the integration of artificial intelligence (AI) and machine learning (ML) for enhanced signal detection and risk assessment, and the increasing focus on real-world evidence (RWE) generation to support post-market drug surveillance. The market is segmented by deployment type (cloud, on-premise), functionality (case processing, signal detection, risk management), and end-user (pharmaceutical companies, CROs, regulatory agencies). Leading vendors, such as AB Cube, Sparta Systems, Oracle Corporation, EXTEDO GmbH, Ennov Solutions, ArisGlobal, and United BioSource Corporation, are actively investing in innovation and strategic partnerships to maintain their market share and capture new opportunities. Competitive pressures are intensifying, driven by the emergence of innovative startups and the ongoing consolidation within the industry.
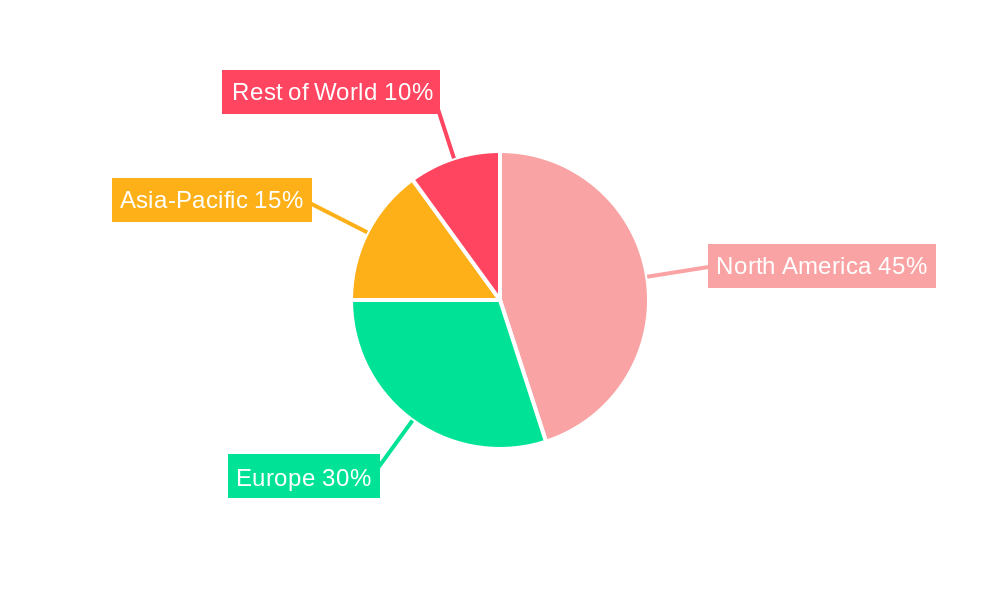
The restraints on market growth primarily include high implementation costs for sophisticated software solutions, the complexities involved in integrating PV systems with existing IT infrastructure, and the need for specialized expertise to manage and interpret data effectively. However, these challenges are being addressed through the development of user-friendly interfaces, modular software solutions, and comprehensive training programs. The adoption of standardized data formats and interoperability protocols is also expected to facilitate the seamless exchange of information and improve overall efficiency. The North American region is currently the largest market segment, followed by Europe. However, the Asia-Pacific region is anticipated to show significant growth in the coming years due to increasing healthcare spending and the rising prevalence of chronic diseases. The forecast period of 2025-2033 indicates a period of sustained expansion, driven by the factors outlined above.
Pharmacovigilance PV and Drug Safety Software Market Report: 2019-2033
This comprehensive report provides an in-depth analysis of the global Pharmacovigilance PV and Drug Safety Software market, projecting a market valuation exceeding $XX million by 2033. The study covers the period from 2019 to 2033, with a focus on the forecast period from 2025 to 2033, using 2025 as the base and estimated year. The report offers crucial insights for stakeholders, including market trends, leading players, technological advancements, and future growth opportunities.
Pharmacovigilance PV and Drug Safety Software Market Composition & Trends
This section delves into the competitive landscape, analyzing market concentration, innovation drivers, regulatory influences, substitute products, end-user profiles, and mergers & acquisitions (M&A) activities within the $XX million Pharmacovigilance PV and Drug Safety Software market. The report dissects market share distribution among key players, revealing a moderately concentrated market with ArisGlobal, Oracle Corporation, and Sparta Systems, Inc. holding significant shares. M&A activity, valued at over $XX million in the historical period (2019-2024), significantly reshaped the competitive dynamics, driving consolidation and innovation.
- Market Concentration: The market exhibits a moderately concentrated structure with the top 5 players accounting for approximately XX% of the market share in 2024.
- Innovation Catalysts: Increasing regulatory scrutiny and the need for enhanced data management are driving the adoption of advanced software solutions.
- Regulatory Landscape: Stringent regulations regarding data privacy and security are shaping the market, influencing software development and adoption strategies.
- Substitute Products: While limited, alternative methods like manual processes exist; however, they lack the efficiency and scalability of specialized software.
- End-User Profiles: Pharmaceutical companies, contract research organizations (CROs), and healthcare providers constitute the primary end-users.
- M&A Activities: The historical period saw significant M&A activity, with deals exceeding $XX million, fostering consolidation and technological integration. Specific deal values and participants will be detailed within the full report.
Pharmacovigilance PV and Drug Safety Software Industry Evolution
This section traces the evolution of the Pharmacovigilance PV and Drug Safety Software market, analyzing market growth trajectories, technological advancements, and evolving consumer demands. The market witnessed robust growth, expanding at a CAGR of XX% during the historical period (2019-2024), reaching a value of $XX million in 2024. This growth is attributed to increasing adoption of cloud-based solutions, enhanced data analytics capabilities, and the rising prevalence of chronic diseases. The forecast period (2025-2033) anticipates a continued expansion, fueled by the increasing demand for efficient and compliant pharmacovigilance solutions. Technological advancements such as AI and machine learning are poised to further accelerate market growth, enhancing data analysis and prediction capabilities, significantly improving the detection and response to adverse events. The adoption rate of cloud-based solutions is expected to increase to XX% by 2033. Further details regarding growth rates, adoption metrics, and technological advancements are available in the comprehensive report.
Leading Regions, Countries, or Segments in Pharmacovigilance PV and Drug Safety Software
North America currently dominates the global Pharmacovigilance PV and Drug Safety Software market, holding a market share of approximately XX% in 2024, driven by factors such as robust regulatory frameworks, high healthcare expenditure, and the presence of major pharmaceutical companies.
Key Drivers in North America:
- High healthcare expenditure and robust pharmaceutical industry.
- Stringent regulatory requirements driving software adoption.
- High levels of technological advancement and early adoption of new technologies.
- Significant investments in R&D and digital health technologies.
Factors contributing to North America's dominance: The region's mature pharmaceutical industry, coupled with stringent regulatory frameworks, has created a strong demand for sophisticated PV software solutions. Early adoption of cloud-based technologies and significant investments in research and development further solidify its leading position. The report will provide a detailed regional breakdown with projections for each region.
Pharmacovigilance PV and Drug Safety Software Product Innovations
Recent product innovations have focused on enhancing data integration, improving data analytics capabilities, and incorporating AI and machine learning to automate tasks and improve the efficiency of adverse event detection and reporting. These innovations offer enhanced reporting capabilities, improved signal detection, and more streamlined workflows, leading to significant improvements in patient safety and regulatory compliance. Unique selling propositions often center on superior data visualization, robust security features, and seamless integration with existing systems.
Propelling Factors for Pharmacovigilance PV and Drug Safety Software Growth
Several factors fuel the growth of the Pharmacovigilance PV and Drug Safety Software market. Stringent regulatory requirements demanding improved safety surveillance are a primary driver. Increased volumes of data generated from clinical trials and post-market surveillance necessitate advanced software solutions for efficient management and analysis. Technological advancements such as AI and machine learning are enhancing the capabilities of these software solutions, improving detection rates and response times to adverse events. Further, cost savings from automation are motivating adoption by pharmaceutical companies.
Obstacles in the Pharmacovigilance Pv And Drug Safety Software Market
Despite the growth potential, several challenges hinder market expansion. High initial investment costs for implementing new software can be prohibitive for smaller pharmaceutical companies. Integration complexities with legacy systems can delay implementation and increase overall costs. Data security and privacy concerns also pose significant challenges, requiring robust security measures. Regulatory changes and evolving compliance requirements demand continuous software updates and adaptations, adding to the overall cost. The market also faces competitive pressures from established and emerging players.
Future Opportunities in Pharmacovigilance PV and Drug Safety Software
Future opportunities lie in the expansion into emerging markets, the development of more sophisticated AI-driven solutions, and the integration of data from diverse sources, including wearable devices and social media. The increasing focus on real-world evidence generation presents a significant opportunity for software providers to develop solutions that facilitate data collection, analysis, and reporting from real-world sources. Furthermore, the development of solutions tailored to specific therapeutic areas or regulatory requirements represents another key area of opportunity.
Major Players in the Pharmacovigilance PV and Drug Safety Software Ecosystem
- AB Cube
- Sparta Systems, Inc.
- Oracle Corporation
- EXTEDO GmbH
- Ennov Solutions, Inc.
- ArisGlobal
- United BioSource Corporation
- Online Business Applications, Inc.
Key Developments in Pharmacovigilance PV and Drug Safety Software Industry
- 2022 Q4: ArisGlobal launched a new AI-powered signal detection module.
- 2023 Q1: Sparta Systems announced a strategic partnership with a leading CRO.
- 2023 Q2: Oracle Corporation released a significant update to its PV software, incorporating enhanced data visualization tools.
- (Further detailed developments with dates and impacts will be provided in the full report.)
Strategic Pharmacovigilance PV and Drug Safety Software Market Forecast
The Pharmacovigilance PV and Drug Safety Software market is poised for substantial growth over the forecast period (2025-2033), driven by technological advancements, increasing regulatory pressures, and the growing need for efficient data management solutions. The market is expected to exceed $XX million by 2033, fueled by ongoing adoption of cloud-based solutions, integration of AI and machine learning, and expansion into emerging markets. The continued emphasis on patient safety and regulatory compliance will be key factors driving demand for these essential software solutions.
Pharmacovigilance Pv And Drug Safety Software Segmentation
-
1. Application
- 1.1. Pharma and Biotech
- 1.2. Contract Research Organizations (CROs)
- 1.3. Business Process Outsourcing (BPO) Firms
- 1.4. Other
-
2. Type
- 2.1. Cloud based
- 2.2. On-premises
Pharmacovigilance Pv And Drug Safety Software Segmentation By Geography
-
1. North America
- 1.1. United States
- 1.2. Canada
- 1.3. Mexico
-
2. South America
- 2.1. Brazil
- 2.2. Argentina
- 2.3. Rest of South America
-
3. Europe
- 3.1. United Kingdom
- 3.2. Germany
- 3.3. France
- 3.4. Italy
- 3.5. Spain
- 3.6. Russia
- 3.7. Benelux
- 3.8. Nordics
- 3.9. Rest of Europe
-
4. Middle East & Africa
- 4.1. Turkey
- 4.2. Israel
- 4.3. GCC
- 4.4. North Africa
- 4.5. South Africa
- 4.6. Rest of Middle East & Africa
-
5. Asia Pacific
- 5.1. China
- 5.2. India
- 5.3. Japan
- 5.4. South Korea
- 5.5. ASEAN
- 5.6. Oceania
- 5.7. Rest of Asia Pacific
Pharmacovigilance Pv And Drug Safety Software REPORT HIGHLIGHTS
| Aspects | Details |
|---|---|
| Study Period | 2019-2033 |
| Base Year | 2024 |
| Estimated Year | 2025 |
| Forecast Period | 2025-2033 |
| Historical Period | 2019-2024 |
| Growth Rate | CAGR of XXX% from 2019-2033 |
| Segmentation |
|
Table of Contents
- 1. Introduction
- 1.1. Research Scope
- 1.2. Market Segmentation
- 1.3. Research Methodology
- 1.4. Definitions and Assumptions
- 2. Executive Summary
- 2.1. Introduction
- 3. Market Dynamics
- 3.1. Introduction
- 3.2. Market Drivers
- 3.3. Market Restrains
- 3.4. Market Trends
- 4. Market Factor Analysis
- 4.1. Porters Five Forces
- 4.2. Supply/Value Chain
- 4.3. PESTEL analysis
- 4.4. Market Entropy
- 4.5. Patent/Trademark Analysis
- 5. Global Pharmacovigilance Pv And Drug Safety Software Analysis, Insights and Forecast, 2019-2031
- 5.1. Market Analysis, Insights and Forecast - by Application
- 5.1.1. Pharma and Biotech
- 5.1.2. Contract Research Organizations (CROs)
- 5.1.3. Business Process Outsourcing (BPO) Firms
- 5.1.4. Other
- 5.2. Market Analysis, Insights and Forecast - by Type
- 5.2.1. Cloud based
- 5.2.2. On-premises
- 5.3. Market Analysis, Insights and Forecast - by Region
- 5.3.1. North America
- 5.3.2. South America
- 5.3.3. Europe
- 5.3.4. Middle East & Africa
- 5.3.5. Asia Pacific
- 5.1. Market Analysis, Insights and Forecast - by Application
- 6. North America Pharmacovigilance Pv And Drug Safety Software Analysis, Insights and Forecast, 2019-2031
- 6.1. Market Analysis, Insights and Forecast - by Application
- 6.1.1. Pharma and Biotech
- 6.1.2. Contract Research Organizations (CROs)
- 6.1.3. Business Process Outsourcing (BPO) Firms
- 6.1.4. Other
- 6.2. Market Analysis, Insights and Forecast - by Type
- 6.2.1. Cloud based
- 6.2.2. On-premises
- 6.1. Market Analysis, Insights and Forecast - by Application
- 7. South America Pharmacovigilance Pv And Drug Safety Software Analysis, Insights and Forecast, 2019-2031
- 7.1. Market Analysis, Insights and Forecast - by Application
- 7.1.1. Pharma and Biotech
- 7.1.2. Contract Research Organizations (CROs)
- 7.1.3. Business Process Outsourcing (BPO) Firms
- 7.1.4. Other
- 7.2. Market Analysis, Insights and Forecast - by Type
- 7.2.1. Cloud based
- 7.2.2. On-premises
- 7.1. Market Analysis, Insights and Forecast - by Application
- 8. Europe Pharmacovigilance Pv And Drug Safety Software Analysis, Insights and Forecast, 2019-2031
- 8.1. Market Analysis, Insights and Forecast - by Application
- 8.1.1. Pharma and Biotech
- 8.1.2. Contract Research Organizations (CROs)
- 8.1.3. Business Process Outsourcing (BPO) Firms
- 8.1.4. Other
- 8.2. Market Analysis, Insights and Forecast - by Type
- 8.2.1. Cloud based
- 8.2.2. On-premises
- 8.1. Market Analysis, Insights and Forecast - by Application
- 9. Middle East & Africa Pharmacovigilance Pv And Drug Safety Software Analysis, Insights and Forecast, 2019-2031
- 9.1. Market Analysis, Insights and Forecast - by Application
- 9.1.1. Pharma and Biotech
- 9.1.2. Contract Research Organizations (CROs)
- 9.1.3. Business Process Outsourcing (BPO) Firms
- 9.1.4. Other
- 9.2. Market Analysis, Insights and Forecast - by Type
- 9.2.1. Cloud based
- 9.2.2. On-premises
- 9.1. Market Analysis, Insights and Forecast - by Application
- 10. Asia Pacific Pharmacovigilance Pv And Drug Safety Software Analysis, Insights and Forecast, 2019-2031
- 10.1. Market Analysis, Insights and Forecast - by Application
- 10.1.1. Pharma and Biotech
- 10.1.2. Contract Research Organizations (CROs)
- 10.1.3. Business Process Outsourcing (BPO) Firms
- 10.1.4. Other
- 10.2. Market Analysis, Insights and Forecast - by Type
- 10.2.1. Cloud based
- 10.2.2. On-premises
- 10.1. Market Analysis, Insights and Forecast - by Application
- 11. Competitive Analysis
- 11.1. Global Market Share Analysis 2024
- 11.2. Company Profiles
- 11.2.1 AB Cube
- 11.2.1.1. Overview
- 11.2.1.2. Products
- 11.2.1.3. SWOT Analysis
- 11.2.1.4. Recent Developments
- 11.2.1.5. Financials (Based on Availability)
- 11.2.2 Sparta Systems Inc.
- 11.2.2.1. Overview
- 11.2.2.2. Products
- 11.2.2.3. SWOT Analysis
- 11.2.2.4. Recent Developments
- 11.2.2.5. Financials (Based on Availability)
- 11.2.3 Oracle Corporation
- 11.2.3.1. Overview
- 11.2.3.2. Products
- 11.2.3.3. SWOT Analysis
- 11.2.3.4. Recent Developments
- 11.2.3.5. Financials (Based on Availability)
- 11.2.4 EXTEDO GmbH
- 11.2.4.1. Overview
- 11.2.4.2. Products
- 11.2.4.3. SWOT Analysis
- 11.2.4.4. Recent Developments
- 11.2.4.5. Financials (Based on Availability)
- 11.2.5 Ennov Solutions Inc.
- 11.2.5.1. Overview
- 11.2.5.2. Products
- 11.2.5.3. SWOT Analysis
- 11.2.5.4. Recent Developments
- 11.2.5.5. Financials (Based on Availability)
- 11.2.6 ArisGlobal
- 11.2.6.1. Overview
- 11.2.6.2. Products
- 11.2.6.3. SWOT Analysis
- 11.2.6.4. Recent Developments
- 11.2.6.5. Financials (Based on Availability)
- 11.2.7 United BioSource Corporation
- 11.2.7.1. Overview
- 11.2.7.2. Products
- 11.2.7.3. SWOT Analysis
- 11.2.7.4. Recent Developments
- 11.2.7.5. Financials (Based on Availability)
- 11.2.8 Online Business Applications Inc.
- 11.2.8.1. Overview
- 11.2.8.2. Products
- 11.2.8.3. SWOT Analysis
- 11.2.8.4. Recent Developments
- 11.2.8.5. Financials (Based on Availability)
- 11.2.1 AB Cube
List of Figures
- Figure 1: Global Pharmacovigilance Pv And Drug Safety Software Revenue Breakdown (million, %) by Region 2024 & 2032
- Figure 2: North America Pharmacovigilance Pv And Drug Safety Software Revenue (million), by Application 2024 & 2032
- Figure 3: North America Pharmacovigilance Pv And Drug Safety Software Revenue Share (%), by Application 2024 & 2032
- Figure 4: North America Pharmacovigilance Pv And Drug Safety Software Revenue (million), by Type 2024 & 2032
- Figure 5: North America Pharmacovigilance Pv And Drug Safety Software Revenue Share (%), by Type 2024 & 2032
- Figure 6: North America Pharmacovigilance Pv And Drug Safety Software Revenue (million), by Country 2024 & 2032
- Figure 7: North America Pharmacovigilance Pv And Drug Safety Software Revenue Share (%), by Country 2024 & 2032
- Figure 8: South America Pharmacovigilance Pv And Drug Safety Software Revenue (million), by Application 2024 & 2032
- Figure 9: South America Pharmacovigilance Pv And Drug Safety Software Revenue Share (%), by Application 2024 & 2032
- Figure 10: South America Pharmacovigilance Pv And Drug Safety Software Revenue (million), by Type 2024 & 2032
- Figure 11: South America Pharmacovigilance Pv And Drug Safety Software Revenue Share (%), by Type 2024 & 2032
- Figure 12: South America Pharmacovigilance Pv And Drug Safety Software Revenue (million), by Country 2024 & 2032
- Figure 13: South America Pharmacovigilance Pv And Drug Safety Software Revenue Share (%), by Country 2024 & 2032
- Figure 14: Europe Pharmacovigilance Pv And Drug Safety Software Revenue (million), by Application 2024 & 2032
- Figure 15: Europe Pharmacovigilance Pv And Drug Safety Software Revenue Share (%), by Application 2024 & 2032
- Figure 16: Europe Pharmacovigilance Pv And Drug Safety Software Revenue (million), by Type 2024 & 2032
- Figure 17: Europe Pharmacovigilance Pv And Drug Safety Software Revenue Share (%), by Type 2024 & 2032
- Figure 18: Europe Pharmacovigilance Pv And Drug Safety Software Revenue (million), by Country 2024 & 2032
- Figure 19: Europe Pharmacovigilance Pv And Drug Safety Software Revenue Share (%), by Country 2024 & 2032
- Figure 20: Middle East & Africa Pharmacovigilance Pv And Drug Safety Software Revenue (million), by Application 2024 & 2032
- Figure 21: Middle East & Africa Pharmacovigilance Pv And Drug Safety Software Revenue Share (%), by Application 2024 & 2032
- Figure 22: Middle East & Africa Pharmacovigilance Pv And Drug Safety Software Revenue (million), by Type 2024 & 2032
- Figure 23: Middle East & Africa Pharmacovigilance Pv And Drug Safety Software Revenue Share (%), by Type 2024 & 2032
- Figure 24: Middle East & Africa Pharmacovigilance Pv And Drug Safety Software Revenue (million), by Country 2024 & 2032
- Figure 25: Middle East & Africa Pharmacovigilance Pv And Drug Safety Software Revenue Share (%), by Country 2024 & 2032
- Figure 26: Asia Pacific Pharmacovigilance Pv And Drug Safety Software Revenue (million), by Application 2024 & 2032
- Figure 27: Asia Pacific Pharmacovigilance Pv And Drug Safety Software Revenue Share (%), by Application 2024 & 2032
- Figure 28: Asia Pacific Pharmacovigilance Pv And Drug Safety Software Revenue (million), by Type 2024 & 2032
- Figure 29: Asia Pacific Pharmacovigilance Pv And Drug Safety Software Revenue Share (%), by Type 2024 & 2032
- Figure 30: Asia Pacific Pharmacovigilance Pv And Drug Safety Software Revenue (million), by Country 2024 & 2032
- Figure 31: Asia Pacific Pharmacovigilance Pv And Drug Safety Software Revenue Share (%), by Country 2024 & 2032
List of Tables
- Table 1: Global Pharmacovigilance Pv And Drug Safety Software Revenue million Forecast, by Region 2019 & 2032
- Table 2: Global Pharmacovigilance Pv And Drug Safety Software Revenue million Forecast, by Application 2019 & 2032
- Table 3: Global Pharmacovigilance Pv And Drug Safety Software Revenue million Forecast, by Type 2019 & 2032
- Table 4: Global Pharmacovigilance Pv And Drug Safety Software Revenue million Forecast, by Region 2019 & 2032
- Table 5: Global Pharmacovigilance Pv And Drug Safety Software Revenue million Forecast, by Application 2019 & 2032
- Table 6: Global Pharmacovigilance Pv And Drug Safety Software Revenue million Forecast, by Type 2019 & 2032
- Table 7: Global Pharmacovigilance Pv And Drug Safety Software Revenue million Forecast, by Country 2019 & 2032
- Table 8: United States Pharmacovigilance Pv And Drug Safety Software Revenue (million) Forecast, by Application 2019 & 2032
- Table 9: Canada Pharmacovigilance Pv And Drug Safety Software Revenue (million) Forecast, by Application 2019 & 2032
- Table 10: Mexico Pharmacovigilance Pv And Drug Safety Software Revenue (million) Forecast, by Application 2019 & 2032
- Table 11: Global Pharmacovigilance Pv And Drug Safety Software Revenue million Forecast, by Application 2019 & 2032
- Table 12: Global Pharmacovigilance Pv And Drug Safety Software Revenue million Forecast, by Type 2019 & 2032
- Table 13: Global Pharmacovigilance Pv And Drug Safety Software Revenue million Forecast, by Country 2019 & 2032
- Table 14: Brazil Pharmacovigilance Pv And Drug Safety Software Revenue (million) Forecast, by Application 2019 & 2032
- Table 15: Argentina Pharmacovigilance Pv And Drug Safety Software Revenue (million) Forecast, by Application 2019 & 2032
- Table 16: Rest of South America Pharmacovigilance Pv And Drug Safety Software Revenue (million) Forecast, by Application 2019 & 2032
- Table 17: Global Pharmacovigilance Pv And Drug Safety Software Revenue million Forecast, by Application 2019 & 2032
- Table 18: Global Pharmacovigilance Pv And Drug Safety Software Revenue million Forecast, by Type 2019 & 2032
- Table 19: Global Pharmacovigilance Pv And Drug Safety Software Revenue million Forecast, by Country 2019 & 2032
- Table 20: United Kingdom Pharmacovigilance Pv And Drug Safety Software Revenue (million) Forecast, by Application 2019 & 2032
- Table 21: Germany Pharmacovigilance Pv And Drug Safety Software Revenue (million) Forecast, by Application 2019 & 2032
- Table 22: France Pharmacovigilance Pv And Drug Safety Software Revenue (million) Forecast, by Application 2019 & 2032
- Table 23: Italy Pharmacovigilance Pv And Drug Safety Software Revenue (million) Forecast, by Application 2019 & 2032
- Table 24: Spain Pharmacovigilance Pv And Drug Safety Software Revenue (million) Forecast, by Application 2019 & 2032
- Table 25: Russia Pharmacovigilance Pv And Drug Safety Software Revenue (million) Forecast, by Application 2019 & 2032
- Table 26: Benelux Pharmacovigilance Pv And Drug Safety Software Revenue (million) Forecast, by Application 2019 & 2032
- Table 27: Nordics Pharmacovigilance Pv And Drug Safety Software Revenue (million) Forecast, by Application 2019 & 2032
- Table 28: Rest of Europe Pharmacovigilance Pv And Drug Safety Software Revenue (million) Forecast, by Application 2019 & 2032
- Table 29: Global Pharmacovigilance Pv And Drug Safety Software Revenue million Forecast, by Application 2019 & 2032
- Table 30: Global Pharmacovigilance Pv And Drug Safety Software Revenue million Forecast, by Type 2019 & 2032
- Table 31: Global Pharmacovigilance Pv And Drug Safety Software Revenue million Forecast, by Country 2019 & 2032
- Table 32: Turkey Pharmacovigilance Pv And Drug Safety Software Revenue (million) Forecast, by Application 2019 & 2032
- Table 33: Israel Pharmacovigilance Pv And Drug Safety Software Revenue (million) Forecast, by Application 2019 & 2032
- Table 34: GCC Pharmacovigilance Pv And Drug Safety Software Revenue (million) Forecast, by Application 2019 & 2032
- Table 35: North Africa Pharmacovigilance Pv And Drug Safety Software Revenue (million) Forecast, by Application 2019 & 2032
- Table 36: South Africa Pharmacovigilance Pv And Drug Safety Software Revenue (million) Forecast, by Application 2019 & 2032
- Table 37: Rest of Middle East & Africa Pharmacovigilance Pv And Drug Safety Software Revenue (million) Forecast, by Application 2019 & 2032
- Table 38: Global Pharmacovigilance Pv And Drug Safety Software Revenue million Forecast, by Application 2019 & 2032
- Table 39: Global Pharmacovigilance Pv And Drug Safety Software Revenue million Forecast, by Type 2019 & 2032
- Table 40: Global Pharmacovigilance Pv And Drug Safety Software Revenue million Forecast, by Country 2019 & 2032
- Table 41: China Pharmacovigilance Pv And Drug Safety Software Revenue (million) Forecast, by Application 2019 & 2032
- Table 42: India Pharmacovigilance Pv And Drug Safety Software Revenue (million) Forecast, by Application 2019 & 2032
- Table 43: Japan Pharmacovigilance Pv And Drug Safety Software Revenue (million) Forecast, by Application 2019 & 2032
- Table 44: South Korea Pharmacovigilance Pv And Drug Safety Software Revenue (million) Forecast, by Application 2019 & 2032
- Table 45: ASEAN Pharmacovigilance Pv And Drug Safety Software Revenue (million) Forecast, by Application 2019 & 2032
- Table 46: Oceania Pharmacovigilance Pv And Drug Safety Software Revenue (million) Forecast, by Application 2019 & 2032
- Table 47: Rest of Asia Pacific Pharmacovigilance Pv And Drug Safety Software Revenue (million) Forecast, by Application 2019 & 2032
Frequently Asked Questions
1. What is the projected Compound Annual Growth Rate (CAGR) of the Pharmacovigilance Pv And Drug Safety Software?
The projected CAGR is approximately XXX%.
2. Which companies are prominent players in the Pharmacovigilance Pv And Drug Safety Software?
Key companies in the market include AB Cube, Sparta Systems, Inc., Oracle Corporation, EXTEDO GmbH, Ennov Solutions, Inc., ArisGlobal, United BioSource Corporation, Online Business Applications, Inc..
3. What are the main segments of the Pharmacovigilance Pv And Drug Safety Software?
The market segments include Application, Type.
4. Can you provide details about the market size?
The market size is estimated to be USD XXX million as of 2022.
5. What are some drivers contributing to market growth?
N/A
6. What are the notable trends driving market growth?
N/A
7. Are there any restraints impacting market growth?
N/A
8. Can you provide examples of recent developments in the market?
N/A
9. What pricing options are available for accessing the report?
Pricing options include single-user, multi-user, and enterprise licenses priced at USD 3950.00, USD 5925.00, and USD 7900.00 respectively.
10. Is the market size provided in terms of value or volume?
The market size is provided in terms of value, measured in million.
11. Are there any specific market keywords associated with the report?
Yes, the market keyword associated with the report is "Pharmacovigilance Pv And Drug Safety Software," which aids in identifying and referencing the specific market segment covered.
12. How do I determine which pricing option suits my needs best?
The pricing options vary based on user requirements and access needs. Individual users may opt for single-user licenses, while businesses requiring broader access may choose multi-user or enterprise licenses for cost-effective access to the report.
13. Are there any additional resources or data provided in the Pharmacovigilance Pv And Drug Safety Software report?
While the report offers comprehensive insights, it's advisable to review the specific contents or supplementary materials provided to ascertain if additional resources or data are available.
14. How can I stay updated on further developments or reports in the Pharmacovigilance Pv And Drug Safety Software?
To stay informed about further developments, trends, and reports in the Pharmacovigilance Pv And Drug Safety Software, consider subscribing to industry newsletters, following relevant companies and organizations, or regularly checking reputable industry news sources and publications.
Methodology
Step 1 - Identification of Relevant Samples Size from Population Database


Step 2 - Approaches for Defining Global Market Size (Value, Volume* & Price*)

Note*: In applicable scenarios
Step 3 - Data Sources
Primary Research
- Web Analytics
- Survey Reports
- Research Institute
- Latest Research Reports
- Opinion Leaders
Secondary Research
- Annual Reports
- White Paper
- Latest Press Release
- Industry Association
- Paid Database
- Investor Presentations

Step 4 - Data Triangulation
Involves using different sources of information in order to increase the validity of a study
These sources are likely to be stakeholders in a program - participants, other researchers, program staff, other community members, and so on.
Then we put all data in single framework & apply various statistical tools to find out the dynamic on the market.
During the analysis stage, feedback from the stakeholder groups would be compared to determine areas of agreement as well as areas of divergence
