

Key Insights
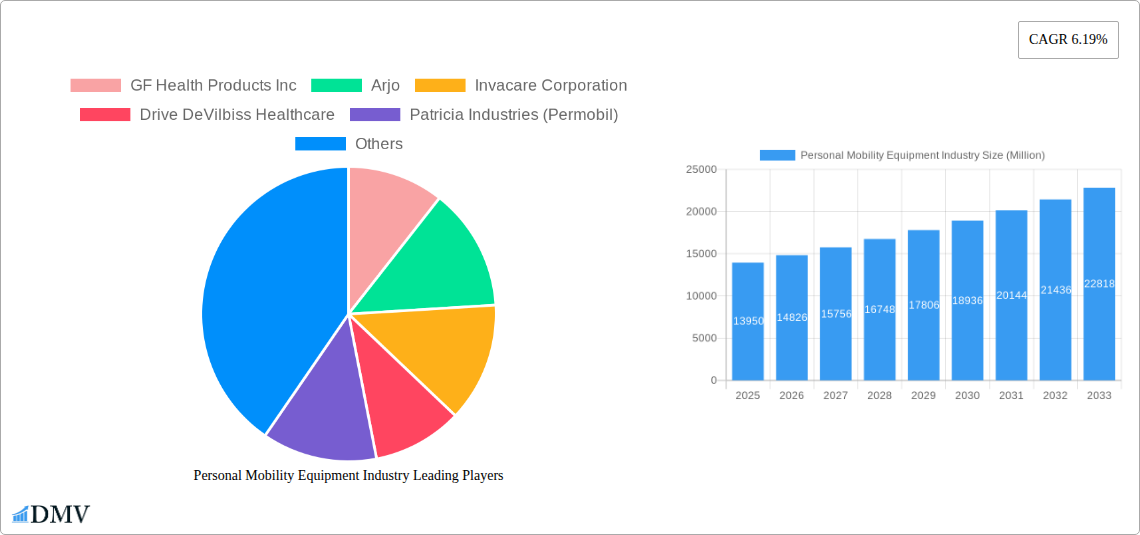
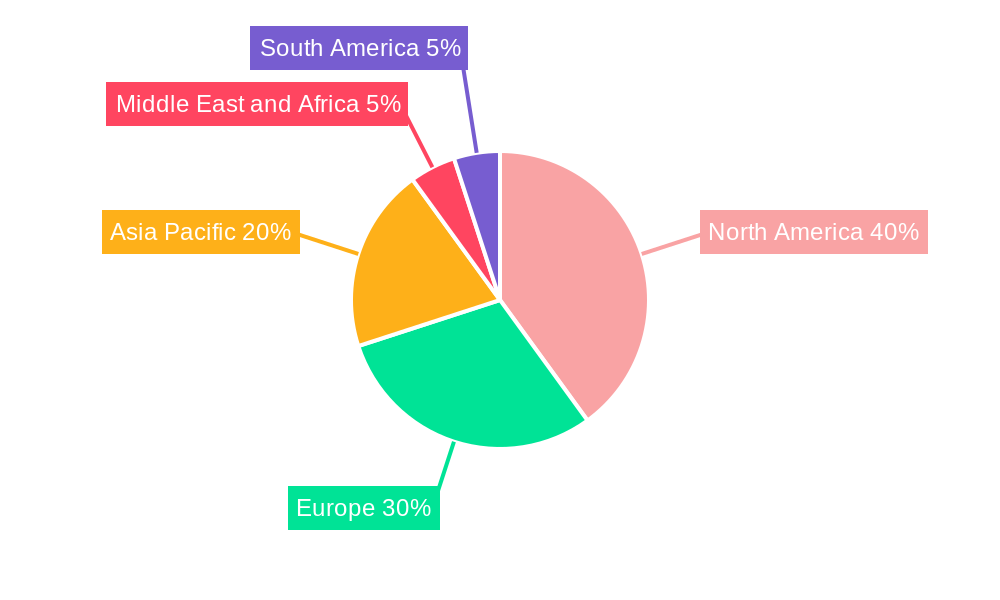
The global Personal Mobility Equipment (PME) market, valued at $13.95 billion in 2025, is projected to experience robust growth, driven by an aging global population, rising prevalence of chronic diseases like arthritis and stroke leading to mobility impairments, and increasing demand for assistive technologies. The market's Compound Annual Growth Rate (CAGR) of 6.19% from 2019 to 2024 indicates a consistently expanding demand for wheelchairs, walking aids, scooters, and other mobility solutions. Key growth drivers include technological advancements leading to lighter, more durable, and technologically advanced products, improved accessibility policies and healthcare infrastructure in several regions, and increasing awareness regarding the benefits of PME among consumers and healthcare providers. The segment encompassing wheelchairs and walking aids constitutes a significant portion of the market, propelled by their relatively lower cost and widespread accessibility. However, the market faces certain restraints, such as high initial costs associated with advanced PME products like power scooters, particularly for individual consumers, and variations in reimbursement policies across different healthcare systems. The North American market currently holds a substantial share, attributed to high healthcare expenditure and a sizeable elderly population; however, the Asia-Pacific region is poised for significant growth due to rapid economic development, rising disposable incomes, and increasing awareness of PME benefits.
The competitive landscape is characterized by a mix of established multinational corporations and specialized smaller companies. Major players such as Invacare Corporation, Pride Mobility Products Corp, and Sunrise Medical are continuously innovating and expanding their product portfolios to cater to diverse consumer needs. Strategic acquisitions, collaborations, and product diversification are expected to shape the competitive dynamics in the coming years. The forecast period (2025-2033) anticipates a continuation of the positive growth trend, with potential acceleration in certain regional markets fueled by expanding healthcare access and increasing government initiatives to support individuals with mobility challenges. The 'Other Products' segment is likely to see accelerated growth, driven by the introduction of innovative assistive technologies and smart mobility solutions. Future market evolution will depend on factors such as technological innovations, regulatory changes impacting accessibility, and shifts in healthcare spending patterns globally.
Personal Mobility Equipment Industry: A Comprehensive Market Report (2019-2033)
This insightful report provides a comprehensive analysis of the Personal Mobility Equipment (PME) industry, projecting a market value exceeding $XX Billion by 2033. The study covers the historical period (2019-2024), the base year (2025), and forecasts the market's trajectory through 2033. It delves into market segmentation, competitive dynamics, technological advancements, and key growth drivers, offering invaluable insights for stakeholders across the PME value chain.
Personal Mobility Equipment Industry Market Composition & Trends
The PME market, valued at $XX Billion in 2025, is characterized by a moderately concentrated landscape with key players like GF Health Products Inc, Arjo, Invacare Corporation, Drive DeVilbiss Healthcare, Patricia Industries (Permobil), Rollz International, Kaye Products Inc, Ottobock, Stryker Corporation, Performance Health, Pride Mobility Products Corp, Medline Industries Inc, and Sunrise Medical (US) LLC holding significant market share. The distribution of market share varies across product segments, with wheelchairs currently dominating.
- Market Concentration: The top five players account for approximately XX% of the global market share in 2025.
- Innovation Catalysts: Technological advancements in lightweight materials, smart features, and assistive technologies are driving innovation.
- Regulatory Landscape: Government regulations regarding accessibility and safety standards influence product design and market entry. Varying regulations across geographies create complexity.
- Substitute Products: While limited, alternative solutions like exoskeletons and robotic aids are emerging, presenting potential competition.
- End-User Profiles: The primary end users are hospitals and clinics, home care settings, and other end users, each with unique needs and purchasing patterns.
- M&A Activities: The industry has witnessed several M&A activities in recent years, totaling approximately $XX Billion in deal value between 2019 and 2024, primarily focused on expanding product portfolios and geographic reach.
Personal Mobility Equipment Industry Industry Evolution
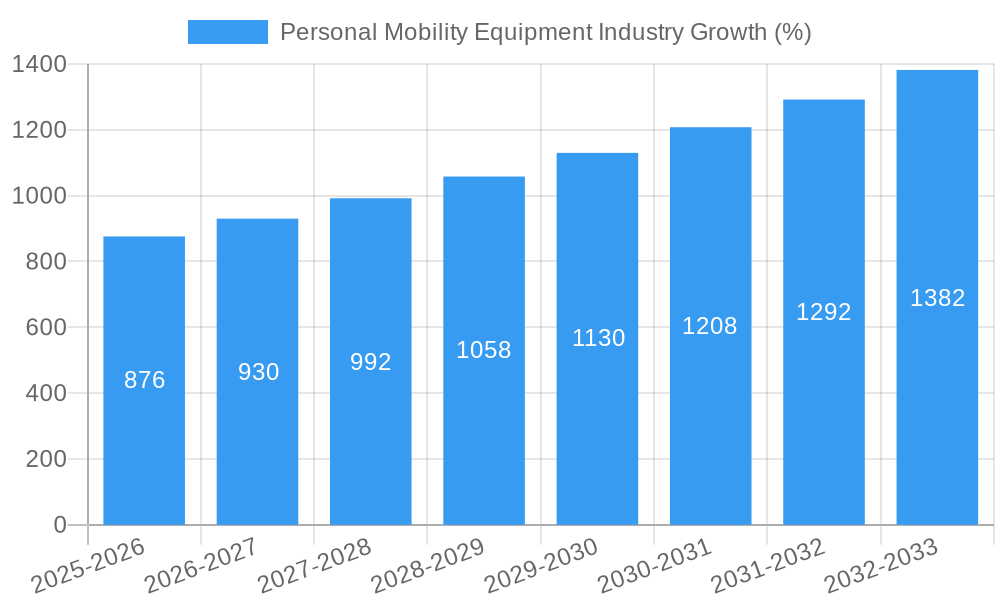
The PME market has experienced robust growth during the historical period (2019-2024), with a Compound Annual Growth Rate (CAGR) of XX%. This growth is primarily driven by the aging global population, increasing prevalence of chronic diseases, and rising disposable incomes, especially in developing economies. Technological advancements, such as the incorporation of smart features and lightweight materials in wheelchairs and scooters, have further fueled market expansion. Consumer demands are shifting towards more comfortable, aesthetically pleasing, and technologically advanced products. Adoption of electric wheelchairs and scooters is growing rapidly, with a XX% increase in sales from 2021 to 2024. This trend is expected to continue through the forecast period, with a projected CAGR of XX% from 2025 to 2033. The market is also witnessing a growing preference for customized and personalized mobility solutions.
Leading Regions, Countries, or Segments in Personal Mobility Equipment Industry
- Dominant Region: North America currently holds the largest market share due to high healthcare expenditure, aging population, and advanced healthcare infrastructure. Europe follows closely, driven by similar factors.
- Dominant Product Segment: Wheelchairs represent the largest segment, accounting for approximately XX% of the market in 2025, followed by walking aids and scooters. The "Other Products" segment comprises a growing range of assistive devices.
- Dominant End-User Segment: Hospitals and clinics are the largest end-user segment, with a significant portion of PME purchases emanating from this sector, driven by the need for durable and reliable equipment in healthcare settings. Home care is also a significant segment, showing strong growth potential.
Key Drivers:
- North America: High healthcare expenditure, robust reimbursement policies, technological advancements.
- Europe: Aging population, rising prevalence of chronic diseases, strong regulatory support for assistive technologies.
- Wheelchairs: Technological advancements in lightweight materials and smart features, increasing demand from aging population.
- Hospitals & Clinics: High volume purchases, focus on durable and reliable equipment.
Personal Mobility Equipment Industry Product Innovations
Recent innovations focus on enhanced comfort, maneuverability, and technological integration. Lightweight materials like aluminum and carbon fiber are replacing heavier steel counterparts. Smart features, such as integrated sensors and smartphone connectivity, are becoming increasingly prevalent. The introduction of foldable, easily transportable designs addresses convenience and storage concerns. Examples include Falcon Mobility's Ultra-Lite 2 electric wheelchair and various smart features integrated into leading brands’ product lines.
Propelling Factors for Personal Mobility Equipment Industry Growth
The PME industry's growth is propelled by several factors:
- Aging Population: The global aging population is a significant driver, increasing the demand for PME across various segments.
- Rising Prevalence of Chronic Diseases: Increased incidence of conditions like stroke, arthritis, and spinal cord injuries fuels the need for assistive mobility devices.
- Technological Advancements: Innovations in materials, design, and smart features enhance product capabilities, leading to increased adoption.
- Government Regulations: Policies promoting accessibility and inclusivity support industry growth and adoption rates.
Obstacles in the Personal Mobility Equipment Industry Market
Despite positive growth trends, the PME market faces challenges:
- High Product Costs: The cost of advanced PME devices can be prohibitive for many consumers, limiting market penetration.
- Supply Chain Disruptions: Global supply chain disruptions can impact production and availability, leading to delays and cost increases.
- Intense Competition: The market is competitive, with established players and emerging companies vying for market share.
- Regulatory Hurdles: Varying and evolving regulatory standards across different regions can create compliance challenges.
Future Opportunities in Personal Mobility Equipment Industry
Future opportunities lie in:
- Expansion into Emerging Markets: Growing middle classes and rising healthcare awareness in developing countries offer significant market expansion opportunities.
- Technological Advancements: Further innovations in areas such as robotics, AI, and smart materials will drive product improvement and create new market segments.
- Personalized Mobility Solutions: Tailored PME solutions that cater to individual needs are gaining traction, representing a key growth area.
Major Players in the Personal Mobility Equipment Industry Ecosystem
- GF Health Products Inc
- Arjo
- Invacare Corporation
- Drive DeVilbiss Healthcare
- Patricia Industries (Permobil)
- Rollz International
- Kaye Products Inc
- Ottobock
- Stryker Corporation
- Performance Health
- Pride Mobility Products Corp
- Medline Industries Inc
- Sunrise Medical (US) LLC
Key Developments in Personal Mobility Equipment Industry Industry
- August 2021: Falcon Mobility unveils the Ultra-Lite 2 electric wheelchair, focusing on affordability and lightweight design. This launch directly addresses market demand for more accessible and easily transportable options.
- July 2021: The International Air Transport Association (IATA) forms a Global Mobility Aids Action Group to improve the transport of mobility aids. This initiative impacts market dynamics by addressing logistical challenges faced by users and caregivers.
Strategic Personal Mobility Equipment Industry Market Forecast
The PME market is poised for sustained growth over the forecast period (2025-2033), driven by the factors previously discussed. The increasing adoption of technologically advanced products and expansion into new markets will contribute to this growth. Significant opportunities exist in personalized solutions, smart technology integration, and addressing the needs of diverse user demographics. The market is expected to witness a CAGR of XX% during this period, reaching a projected value exceeding $XX Billion by 2033.
Personal Mobility Equipment Industry Segmentation
-
1. Product
- 1.1. Wheelchair
- 1.2. Walking Aids
- 1.3. Scooters
- 1.4. Other Products
-
2. End User
- 2.1. Hospitals and Clinics
- 2.2. Home Care Settings
- 2.3. Other End Users
Personal Mobility Equipment Industry Segmentation By Geography
-
1. North America
- 1.1. United States
- 1.2. Canada
- 1.3. Mexico
-
2. Europe
- 2.1. Germany
- 2.2. United Kingdom
- 2.3. France
- 2.4. Italy
- 2.5. Spain
- 2.6. Rest of Europe
-
3. Asia Pacific
- 3.1. China
- 3.2. Japan
- 3.3. India
- 3.4. Australia
- 3.5. South Korea
- 3.6. Rest of Asia Pacific
-
4. Middle East and Africa
- 4.1. GCC
- 4.2. South Africa
- 4.3. Rest of Middle East and Africa
-
5. South America
- 5.1. Brazil
- 5.2. Argentina
- 5.3. Rest of South America
Personal Mobility Equipment Industry REPORT HIGHLIGHTS
| Aspects | Details |
|---|---|
| Study Period | 2019-2033 |
| Base Year | 2024 |
| Estimated Year | 2025 |
| Forecast Period | 2025-2033 |
| Historical Period | 2019-2024 |
| Growth Rate | CAGR of 6.19% from 2019-2033 |
| Segmentation |
|
Table of Contents
- 1. Introduction
- 1.1. Research Scope
- 1.2. Market Segmentation
- 1.3. Research Methodology
- 1.4. Definitions and Assumptions
- 2. Executive Summary
- 2.1. Introduction
- 3. Market Dynamics
- 3.1. Introduction
- 3.2. Market Drivers
- 3.2.1. Increase in Demand for Personal Mobility Devices in Elderly Population; Technological Advancements in the Devices
- 3.3. Market Restrains
- 3.3.1. High Cost of the Devices
- 3.4. Market Trends
- 3.4.1. Wheelchairs Emerged as the Largest Segment in the Personal Mobility Devices Market
- 4. Market Factor Analysis
- 4.1. Porters Five Forces
- 4.2. Supply/Value Chain
- 4.3. PESTEL analysis
- 4.4. Market Entropy
- 4.5. Patent/Trademark Analysis
- 5. Global Personal Mobility Equipment Industry Analysis, Insights and Forecast, 2019-2031
- 5.1. Market Analysis, Insights and Forecast - by Product
- 5.1.1. Wheelchair
- 5.1.2. Walking Aids
- 5.1.3. Scooters
- 5.1.4. Other Products
- 5.2. Market Analysis, Insights and Forecast - by End User
- 5.2.1. Hospitals and Clinics
- 5.2.2. Home Care Settings
- 5.2.3. Other End Users
- 5.3. Market Analysis, Insights and Forecast - by Region
- 5.3.1. North America
- 5.3.2. Europe
- 5.3.3. Asia Pacific
- 5.3.4. Middle East and Africa
- 5.3.5. South America
- 5.1. Market Analysis, Insights and Forecast - by Product
- 6. North America Personal Mobility Equipment Industry Analysis, Insights and Forecast, 2019-2031
- 6.1. Market Analysis, Insights and Forecast - by Product
- 6.1.1. Wheelchair
- 6.1.2. Walking Aids
- 6.1.3. Scooters
- 6.1.4. Other Products
- 6.2. Market Analysis, Insights and Forecast - by End User
- 6.2.1. Hospitals and Clinics
- 6.2.2. Home Care Settings
- 6.2.3. Other End Users
- 6.1. Market Analysis, Insights and Forecast - by Product
- 7. Europe Personal Mobility Equipment Industry Analysis, Insights and Forecast, 2019-2031
- 7.1. Market Analysis, Insights and Forecast - by Product
- 7.1.1. Wheelchair
- 7.1.2. Walking Aids
- 7.1.3. Scooters
- 7.1.4. Other Products
- 7.2. Market Analysis, Insights and Forecast - by End User
- 7.2.1. Hospitals and Clinics
- 7.2.2. Home Care Settings
- 7.2.3. Other End Users
- 7.1. Market Analysis, Insights and Forecast - by Product
- 8. Asia Pacific Personal Mobility Equipment Industry Analysis, Insights and Forecast, 2019-2031
- 8.1. Market Analysis, Insights and Forecast - by Product
- 8.1.1. Wheelchair
- 8.1.2. Walking Aids
- 8.1.3. Scooters
- 8.1.4. Other Products
- 8.2. Market Analysis, Insights and Forecast - by End User
- 8.2.1. Hospitals and Clinics
- 8.2.2. Home Care Settings
- 8.2.3. Other End Users
- 8.1. Market Analysis, Insights and Forecast - by Product
- 9. Middle East and Africa Personal Mobility Equipment Industry Analysis, Insights and Forecast, 2019-2031
- 9.1. Market Analysis, Insights and Forecast - by Product
- 9.1.1. Wheelchair
- 9.1.2. Walking Aids
- 9.1.3. Scooters
- 9.1.4. Other Products
- 9.2. Market Analysis, Insights and Forecast - by End User
- 9.2.1. Hospitals and Clinics
- 9.2.2. Home Care Settings
- 9.2.3. Other End Users
- 9.1. Market Analysis, Insights and Forecast - by Product
- 10. South America Personal Mobility Equipment Industry Analysis, Insights and Forecast, 2019-2031
- 10.1. Market Analysis, Insights and Forecast - by Product
- 10.1.1. Wheelchair
- 10.1.2. Walking Aids
- 10.1.3. Scooters
- 10.1.4. Other Products
- 10.2. Market Analysis, Insights and Forecast - by End User
- 10.2.1. Hospitals and Clinics
- 10.2.2. Home Care Settings
- 10.2.3. Other End Users
- 10.1. Market Analysis, Insights and Forecast - by Product
- 11. North America Personal Mobility Equipment Industry Analysis, Insights and Forecast, 2019-2031
- 11.1. Market Analysis, Insights and Forecast - By Country/Sub-region
- 11.1.1. undefined
- 12. Europe Personal Mobility Equipment Industry Analysis, Insights and Forecast, 2019-2031
- 12.1. Market Analysis, Insights and Forecast - By Country/Sub-region
- 12.1.1. undefined
- 13. Asia Pacific Personal Mobility Equipment Industry Analysis, Insights and Forecast, 2019-2031
- 13.1. Market Analysis, Insights and Forecast - By Country/Sub-region
- 13.1.1. undefined
- 14. Middle East and Africa Personal Mobility Equipment Industry Analysis, Insights and Forecast, 2019-2031
- 14.1. Market Analysis, Insights and Forecast - By Country/Sub-region
- 14.1.1. undefined
- 15. South America Personal Mobility Equipment Industry Analysis, Insights and Forecast, 2019-2031
- 15.1. Market Analysis, Insights and Forecast - By Country/Sub-region
- 15.1.1. undefined
- 16. Competitive Analysis
- 16.1. Global Market Share Analysis 2024
- 16.2. Company Profiles
- 16.2.1 GF Health Products Inc
- 16.2.1.1. Overview
- 16.2.1.2. Products
- 16.2.1.3. SWOT Analysis
- 16.2.1.4. Recent Developments
- 16.2.1.5. Financials (Based on Availability)
- 16.2.2 Arjo
- 16.2.2.1. Overview
- 16.2.2.2. Products
- 16.2.2.3. SWOT Analysis
- 16.2.2.4. Recent Developments
- 16.2.2.5. Financials (Based on Availability)
- 16.2.3 Invacare Corporation
- 16.2.3.1. Overview
- 16.2.3.2. Products
- 16.2.3.3. SWOT Analysis
- 16.2.3.4. Recent Developments
- 16.2.3.5. Financials (Based on Availability)
- 16.2.4 Drive DeVilbiss Healthcare
- 16.2.4.1. Overview
- 16.2.4.2. Products
- 16.2.4.3. SWOT Analysis
- 16.2.4.4. Recent Developments
- 16.2.4.5. Financials (Based on Availability)
- 16.2.5 Patricia Industries (Permobil)
- 16.2.5.1. Overview
- 16.2.5.2. Products
- 16.2.5.3. SWOT Analysis
- 16.2.5.4. Recent Developments
- 16.2.5.5. Financials (Based on Availability)
- 16.2.6 Rollz International
- 16.2.6.1. Overview
- 16.2.6.2. Products
- 16.2.6.3. SWOT Analysis
- 16.2.6.4. Recent Developments
- 16.2.6.5. Financials (Based on Availability)
- 16.2.7 Kaye Products Inc
- 16.2.7.1. Overview
- 16.2.7.2. Products
- 16.2.7.3. SWOT Analysis
- 16.2.7.4. Recent Developments
- 16.2.7.5. Financials (Based on Availability)
- 16.2.8 Ottobock
- 16.2.8.1. Overview
- 16.2.8.2. Products
- 16.2.8.3. SWOT Analysis
- 16.2.8.4. Recent Developments
- 16.2.8.5. Financials (Based on Availability)
- 16.2.9 Stryker Corporation
- 16.2.9.1. Overview
- 16.2.9.2. Products
- 16.2.9.3. SWOT Analysis
- 16.2.9.4. Recent Developments
- 16.2.9.5. Financials (Based on Availability)
- 16.2.10 Performance Health
- 16.2.10.1. Overview
- 16.2.10.2. Products
- 16.2.10.3. SWOT Analysis
- 16.2.10.4. Recent Developments
- 16.2.10.5. Financials (Based on Availability)
- 16.2.11 Pride Mobility Products Corp
- 16.2.11.1. Overview
- 16.2.11.2. Products
- 16.2.11.3. SWOT Analysis
- 16.2.11.4. Recent Developments
- 16.2.11.5. Financials (Based on Availability)
- 16.2.12 Medline Industries Inc
- 16.2.12.1. Overview
- 16.2.12.2. Products
- 16.2.12.3. SWOT Analysis
- 16.2.12.4. Recent Developments
- 16.2.12.5. Financials (Based on Availability)
- 16.2.13 Sunrise Medical (US) LLC
- 16.2.13.1. Overview
- 16.2.13.2. Products
- 16.2.13.3. SWOT Analysis
- 16.2.13.4. Recent Developments
- 16.2.13.5. Financials (Based on Availability)
- 16.2.1 GF Health Products Inc
List of Figures
- Figure 1: Global Personal Mobility Equipment Industry Revenue Breakdown (Million, %) by Region 2024 & 2032
- Figure 2: Global Personal Mobility Equipment Industry Volume Breakdown (K Unit, %) by Region 2024 & 2032
- Figure 3: North America Personal Mobility Equipment Industry Revenue (Million), by Country 2024 & 2032
- Figure 4: North America Personal Mobility Equipment Industry Volume (K Unit), by Country 2024 & 2032
- Figure 5: North America Personal Mobility Equipment Industry Revenue Share (%), by Country 2024 & 2032
- Figure 6: North America Personal Mobility Equipment Industry Volume Share (%), by Country 2024 & 2032
- Figure 7: Europe Personal Mobility Equipment Industry Revenue (Million), by Country 2024 & 2032
- Figure 8: Europe Personal Mobility Equipment Industry Volume (K Unit), by Country 2024 & 2032
- Figure 9: Europe Personal Mobility Equipment Industry Revenue Share (%), by Country 2024 & 2032
- Figure 10: Europe Personal Mobility Equipment Industry Volume Share (%), by Country 2024 & 2032
- Figure 11: Asia Pacific Personal Mobility Equipment Industry Revenue (Million), by Country 2024 & 2032
- Figure 12: Asia Pacific Personal Mobility Equipment Industry Volume (K Unit), by Country 2024 & 2032
- Figure 13: Asia Pacific Personal Mobility Equipment Industry Revenue Share (%), by Country 2024 & 2032
- Figure 14: Asia Pacific Personal Mobility Equipment Industry Volume Share (%), by Country 2024 & 2032
- Figure 15: Middle East and Africa Personal Mobility Equipment Industry Revenue (Million), by Country 2024 & 2032
- Figure 16: Middle East and Africa Personal Mobility Equipment Industry Volume (K Unit), by Country 2024 & 2032
- Figure 17: Middle East and Africa Personal Mobility Equipment Industry Revenue Share (%), by Country 2024 & 2032
- Figure 18: Middle East and Africa Personal Mobility Equipment Industry Volume Share (%), by Country 2024 & 2032
- Figure 19: South America Personal Mobility Equipment Industry Revenue (Million), by Country 2024 & 2032
- Figure 20: South America Personal Mobility Equipment Industry Volume (K Unit), by Country 2024 & 2032
- Figure 21: South America Personal Mobility Equipment Industry Revenue Share (%), by Country 2024 & 2032
- Figure 22: South America Personal Mobility Equipment Industry Volume Share (%), by Country 2024 & 2032
- Figure 23: North America Personal Mobility Equipment Industry Revenue (Million), by Product 2024 & 2032
- Figure 24: North America Personal Mobility Equipment Industry Volume (K Unit), by Product 2024 & 2032
- Figure 25: North America Personal Mobility Equipment Industry Revenue Share (%), by Product 2024 & 2032
- Figure 26: North America Personal Mobility Equipment Industry Volume Share (%), by Product 2024 & 2032
- Figure 27: North America Personal Mobility Equipment Industry Revenue (Million), by End User 2024 & 2032
- Figure 28: North America Personal Mobility Equipment Industry Volume (K Unit), by End User 2024 & 2032
- Figure 29: North America Personal Mobility Equipment Industry Revenue Share (%), by End User 2024 & 2032
- Figure 30: North America Personal Mobility Equipment Industry Volume Share (%), by End User 2024 & 2032
- Figure 31: North America Personal Mobility Equipment Industry Revenue (Million), by Country 2024 & 2032
- Figure 32: North America Personal Mobility Equipment Industry Volume (K Unit), by Country 2024 & 2032
- Figure 33: North America Personal Mobility Equipment Industry Revenue Share (%), by Country 2024 & 2032
- Figure 34: North America Personal Mobility Equipment Industry Volume Share (%), by Country 2024 & 2032
- Figure 35: Europe Personal Mobility Equipment Industry Revenue (Million), by Product 2024 & 2032
- Figure 36: Europe Personal Mobility Equipment Industry Volume (K Unit), by Product 2024 & 2032
- Figure 37: Europe Personal Mobility Equipment Industry Revenue Share (%), by Product 2024 & 2032
- Figure 38: Europe Personal Mobility Equipment Industry Volume Share (%), by Product 2024 & 2032
- Figure 39: Europe Personal Mobility Equipment Industry Revenue (Million), by End User 2024 & 2032
- Figure 40: Europe Personal Mobility Equipment Industry Volume (K Unit), by End User 2024 & 2032
- Figure 41: Europe Personal Mobility Equipment Industry Revenue Share (%), by End User 2024 & 2032
- Figure 42: Europe Personal Mobility Equipment Industry Volume Share (%), by End User 2024 & 2032
- Figure 43: Europe Personal Mobility Equipment Industry Revenue (Million), by Country 2024 & 2032
- Figure 44: Europe Personal Mobility Equipment Industry Volume (K Unit), by Country 2024 & 2032
- Figure 45: Europe Personal Mobility Equipment Industry Revenue Share (%), by Country 2024 & 2032
- Figure 46: Europe Personal Mobility Equipment Industry Volume Share (%), by Country 2024 & 2032
- Figure 47: Asia Pacific Personal Mobility Equipment Industry Revenue (Million), by Product 2024 & 2032
- Figure 48: Asia Pacific Personal Mobility Equipment Industry Volume (K Unit), by Product 2024 & 2032
- Figure 49: Asia Pacific Personal Mobility Equipment Industry Revenue Share (%), by Product 2024 & 2032
- Figure 50: Asia Pacific Personal Mobility Equipment Industry Volume Share (%), by Product 2024 & 2032
- Figure 51: Asia Pacific Personal Mobility Equipment Industry Revenue (Million), by End User 2024 & 2032
- Figure 52: Asia Pacific Personal Mobility Equipment Industry Volume (K Unit), by End User 2024 & 2032
- Figure 53: Asia Pacific Personal Mobility Equipment Industry Revenue Share (%), by End User 2024 & 2032
- Figure 54: Asia Pacific Personal Mobility Equipment Industry Volume Share (%), by End User 2024 & 2032
- Figure 55: Asia Pacific Personal Mobility Equipment Industry Revenue (Million), by Country 2024 & 2032
- Figure 56: Asia Pacific Personal Mobility Equipment Industry Volume (K Unit), by Country 2024 & 2032
- Figure 57: Asia Pacific Personal Mobility Equipment Industry Revenue Share (%), by Country 2024 & 2032
- Figure 58: Asia Pacific Personal Mobility Equipment Industry Volume Share (%), by Country 2024 & 2032
- Figure 59: Middle East and Africa Personal Mobility Equipment Industry Revenue (Million), by Product 2024 & 2032
- Figure 60: Middle East and Africa Personal Mobility Equipment Industry Volume (K Unit), by Product 2024 & 2032
- Figure 61: Middle East and Africa Personal Mobility Equipment Industry Revenue Share (%), by Product 2024 & 2032
- Figure 62: Middle East and Africa Personal Mobility Equipment Industry Volume Share (%), by Product 2024 & 2032
- Figure 63: Middle East and Africa Personal Mobility Equipment Industry Revenue (Million), by End User 2024 & 2032
- Figure 64: Middle East and Africa Personal Mobility Equipment Industry Volume (K Unit), by End User 2024 & 2032
- Figure 65: Middle East and Africa Personal Mobility Equipment Industry Revenue Share (%), by End User 2024 & 2032
- Figure 66: Middle East and Africa Personal Mobility Equipment Industry Volume Share (%), by End User 2024 & 2032
- Figure 67: Middle East and Africa Personal Mobility Equipment Industry Revenue (Million), by Country 2024 & 2032
- Figure 68: Middle East and Africa Personal Mobility Equipment Industry Volume (K Unit), by Country 2024 & 2032
- Figure 69: Middle East and Africa Personal Mobility Equipment Industry Revenue Share (%), by Country 2024 & 2032
- Figure 70: Middle East and Africa Personal Mobility Equipment Industry Volume Share (%), by Country 2024 & 2032
- Figure 71: South America Personal Mobility Equipment Industry Revenue (Million), by Product 2024 & 2032
- Figure 72: South America Personal Mobility Equipment Industry Volume (K Unit), by Product 2024 & 2032
- Figure 73: South America Personal Mobility Equipment Industry Revenue Share (%), by Product 2024 & 2032
- Figure 74: South America Personal Mobility Equipment Industry Volume Share (%), by Product 2024 & 2032
- Figure 75: South America Personal Mobility Equipment Industry Revenue (Million), by End User 2024 & 2032
- Figure 76: South America Personal Mobility Equipment Industry Volume (K Unit), by End User 2024 & 2032
- Figure 77: South America Personal Mobility Equipment Industry Revenue Share (%), by End User 2024 & 2032
- Figure 78: South America Personal Mobility Equipment Industry Volume Share (%), by End User 2024 & 2032
- Figure 79: South America Personal Mobility Equipment Industry Revenue (Million), by Country 2024 & 2032
- Figure 80: South America Personal Mobility Equipment Industry Volume (K Unit), by Country 2024 & 2032
- Figure 81: South America Personal Mobility Equipment Industry Revenue Share (%), by Country 2024 & 2032
- Figure 82: South America Personal Mobility Equipment Industry Volume Share (%), by Country 2024 & 2032
List of Tables
- Table 1: Global Personal Mobility Equipment Industry Revenue Million Forecast, by Region 2019 & 2032
- Table 2: Global Personal Mobility Equipment Industry Volume K Unit Forecast, by Region 2019 & 2032
- Table 3: Global Personal Mobility Equipment Industry Revenue Million Forecast, by Product 2019 & 2032
- Table 4: Global Personal Mobility Equipment Industry Volume K Unit Forecast, by Product 2019 & 2032
- Table 5: Global Personal Mobility Equipment Industry Revenue Million Forecast, by End User 2019 & 2032
- Table 6: Global Personal Mobility Equipment Industry Volume K Unit Forecast, by End User 2019 & 2032
- Table 7: Global Personal Mobility Equipment Industry Revenue Million Forecast, by Region 2019 & 2032
- Table 8: Global Personal Mobility Equipment Industry Volume K Unit Forecast, by Region 2019 & 2032
- Table 9: Global Personal Mobility Equipment Industry Revenue Million Forecast, by Country 2019 & 2032
- Table 10: Global Personal Mobility Equipment Industry Volume K Unit Forecast, by Country 2019 & 2032
- Table 11: Global Personal Mobility Equipment Industry Revenue Million Forecast, by Country 2019 & 2032
- Table 12: Global Personal Mobility Equipment Industry Volume K Unit Forecast, by Country 2019 & 2032
- Table 13: Global Personal Mobility Equipment Industry Revenue Million Forecast, by Country 2019 & 2032
- Table 14: Global Personal Mobility Equipment Industry Volume K Unit Forecast, by Country 2019 & 2032
- Table 15: Global Personal Mobility Equipment Industry Revenue Million Forecast, by Country 2019 & 2032
- Table 16: Global Personal Mobility Equipment Industry Volume K Unit Forecast, by Country 2019 & 2032
- Table 17: Global Personal Mobility Equipment Industry Revenue Million Forecast, by Country 2019 & 2032
- Table 18: Global Personal Mobility Equipment Industry Volume K Unit Forecast, by Country 2019 & 2032
- Table 19: Global Personal Mobility Equipment Industry Revenue Million Forecast, by Product 2019 & 2032
- Table 20: Global Personal Mobility Equipment Industry Volume K Unit Forecast, by Product 2019 & 2032
- Table 21: Global Personal Mobility Equipment Industry Revenue Million Forecast, by End User 2019 & 2032
- Table 22: Global Personal Mobility Equipment Industry Volume K Unit Forecast, by End User 2019 & 2032
- Table 23: Global Personal Mobility Equipment Industry Revenue Million Forecast, by Country 2019 & 2032
- Table 24: Global Personal Mobility Equipment Industry Volume K Unit Forecast, by Country 2019 & 2032
- Table 25: United States Personal Mobility Equipment Industry Revenue (Million) Forecast, by Application 2019 & 2032
- Table 26: United States Personal Mobility Equipment Industry Volume (K Unit) Forecast, by Application 2019 & 2032
- Table 27: Canada Personal Mobility Equipment Industry Revenue (Million) Forecast, by Application 2019 & 2032
- Table 28: Canada Personal Mobility Equipment Industry Volume (K Unit) Forecast, by Application 2019 & 2032
- Table 29: Mexico Personal Mobility Equipment Industry Revenue (Million) Forecast, by Application 2019 & 2032
- Table 30: Mexico Personal Mobility Equipment Industry Volume (K Unit) Forecast, by Application 2019 & 2032
- Table 31: Global Personal Mobility Equipment Industry Revenue Million Forecast, by Product 2019 & 2032
- Table 32: Global Personal Mobility Equipment Industry Volume K Unit Forecast, by Product 2019 & 2032
- Table 33: Global Personal Mobility Equipment Industry Revenue Million Forecast, by End User 2019 & 2032
- Table 34: Global Personal Mobility Equipment Industry Volume K Unit Forecast, by End User 2019 & 2032
- Table 35: Global Personal Mobility Equipment Industry Revenue Million Forecast, by Country 2019 & 2032
- Table 36: Global Personal Mobility Equipment Industry Volume K Unit Forecast, by Country 2019 & 2032
- Table 37: Germany Personal Mobility Equipment Industry Revenue (Million) Forecast, by Application 2019 & 2032
- Table 38: Germany Personal Mobility Equipment Industry Volume (K Unit) Forecast, by Application 2019 & 2032
- Table 39: United Kingdom Personal Mobility Equipment Industry Revenue (Million) Forecast, by Application 2019 & 2032
- Table 40: United Kingdom Personal Mobility Equipment Industry Volume (K Unit) Forecast, by Application 2019 & 2032
- Table 41: France Personal Mobility Equipment Industry Revenue (Million) Forecast, by Application 2019 & 2032
- Table 42: France Personal Mobility Equipment Industry Volume (K Unit) Forecast, by Application 2019 & 2032
- Table 43: Italy Personal Mobility Equipment Industry Revenue (Million) Forecast, by Application 2019 & 2032
- Table 44: Italy Personal Mobility Equipment Industry Volume (K Unit) Forecast, by Application 2019 & 2032
- Table 45: Spain Personal Mobility Equipment Industry Revenue (Million) Forecast, by Application 2019 & 2032
- Table 46: Spain Personal Mobility Equipment Industry Volume (K Unit) Forecast, by Application 2019 & 2032
- Table 47: Rest of Europe Personal Mobility Equipment Industry Revenue (Million) Forecast, by Application 2019 & 2032
- Table 48: Rest of Europe Personal Mobility Equipment Industry Volume (K Unit) Forecast, by Application 2019 & 2032
- Table 49: Global Personal Mobility Equipment Industry Revenue Million Forecast, by Product 2019 & 2032
- Table 50: Global Personal Mobility Equipment Industry Volume K Unit Forecast, by Product 2019 & 2032
- Table 51: Global Personal Mobility Equipment Industry Revenue Million Forecast, by End User 2019 & 2032
- Table 52: Global Personal Mobility Equipment Industry Volume K Unit Forecast, by End User 2019 & 2032
- Table 53: Global Personal Mobility Equipment Industry Revenue Million Forecast, by Country 2019 & 2032
- Table 54: Global Personal Mobility Equipment Industry Volume K Unit Forecast, by Country 2019 & 2032
- Table 55: China Personal Mobility Equipment Industry Revenue (Million) Forecast, by Application 2019 & 2032
- Table 56: China Personal Mobility Equipment Industry Volume (K Unit) Forecast, by Application 2019 & 2032
- Table 57: Japan Personal Mobility Equipment Industry Revenue (Million) Forecast, by Application 2019 & 2032
- Table 58: Japan Personal Mobility Equipment Industry Volume (K Unit) Forecast, by Application 2019 & 2032
- Table 59: India Personal Mobility Equipment Industry Revenue (Million) Forecast, by Application 2019 & 2032
- Table 60: India Personal Mobility Equipment Industry Volume (K Unit) Forecast, by Application 2019 & 2032
- Table 61: Australia Personal Mobility Equipment Industry Revenue (Million) Forecast, by Application 2019 & 2032
- Table 62: Australia Personal Mobility Equipment Industry Volume (K Unit) Forecast, by Application 2019 & 2032
- Table 63: South Korea Personal Mobility Equipment Industry Revenue (Million) Forecast, by Application 2019 & 2032
- Table 64: South Korea Personal Mobility Equipment Industry Volume (K Unit) Forecast, by Application 2019 & 2032
- Table 65: Rest of Asia Pacific Personal Mobility Equipment Industry Revenue (Million) Forecast, by Application 2019 & 2032
- Table 66: Rest of Asia Pacific Personal Mobility Equipment Industry Volume (K Unit) Forecast, by Application 2019 & 2032
- Table 67: Global Personal Mobility Equipment Industry Revenue Million Forecast, by Product 2019 & 2032
- Table 68: Global Personal Mobility Equipment Industry Volume K Unit Forecast, by Product 2019 & 2032
- Table 69: Global Personal Mobility Equipment Industry Revenue Million Forecast, by End User 2019 & 2032
- Table 70: Global Personal Mobility Equipment Industry Volume K Unit Forecast, by End User 2019 & 2032
- Table 71: Global Personal Mobility Equipment Industry Revenue Million Forecast, by Country 2019 & 2032
- Table 72: Global Personal Mobility Equipment Industry Volume K Unit Forecast, by Country 2019 & 2032
- Table 73: GCC Personal Mobility Equipment Industry Revenue (Million) Forecast, by Application 2019 & 2032
- Table 74: GCC Personal Mobility Equipment Industry Volume (K Unit) Forecast, by Application 2019 & 2032
- Table 75: South Africa Personal Mobility Equipment Industry Revenue (Million) Forecast, by Application 2019 & 2032
- Table 76: South Africa Personal Mobility Equipment Industry Volume (K Unit) Forecast, by Application 2019 & 2032
- Table 77: Rest of Middle East and Africa Personal Mobility Equipment Industry Revenue (Million) Forecast, by Application 2019 & 2032
- Table 78: Rest of Middle East and Africa Personal Mobility Equipment Industry Volume (K Unit) Forecast, by Application 2019 & 2032
- Table 79: Global Personal Mobility Equipment Industry Revenue Million Forecast, by Product 2019 & 2032
- Table 80: Global Personal Mobility Equipment Industry Volume K Unit Forecast, by Product 2019 & 2032
- Table 81: Global Personal Mobility Equipment Industry Revenue Million Forecast, by End User 2019 & 2032
- Table 82: Global Personal Mobility Equipment Industry Volume K Unit Forecast, by End User 2019 & 2032
- Table 83: Global Personal Mobility Equipment Industry Revenue Million Forecast, by Country 2019 & 2032
- Table 84: Global Personal Mobility Equipment Industry Volume K Unit Forecast, by Country 2019 & 2032
- Table 85: Brazil Personal Mobility Equipment Industry Revenue (Million) Forecast, by Application 2019 & 2032
- Table 86: Brazil Personal Mobility Equipment Industry Volume (K Unit) Forecast, by Application 2019 & 2032
- Table 87: Argentina Personal Mobility Equipment Industry Revenue (Million) Forecast, by Application 2019 & 2032
- Table 88: Argentina Personal Mobility Equipment Industry Volume (K Unit) Forecast, by Application 2019 & 2032
- Table 89: Rest of South America Personal Mobility Equipment Industry Revenue (Million) Forecast, by Application 2019 & 2032
- Table 90: Rest of South America Personal Mobility Equipment Industry Volume (K Unit) Forecast, by Application 2019 & 2032
Frequently Asked Questions
1. What is the projected Compound Annual Growth Rate (CAGR) of the Personal Mobility Equipment Industry?
The projected CAGR is approximately 6.19%.
2. Which companies are prominent players in the Personal Mobility Equipment Industry?
Key companies in the market include GF Health Products Inc, Arjo, Invacare Corporation, Drive DeVilbiss Healthcare, Patricia Industries (Permobil), Rollz International, Kaye Products Inc, Ottobock, Stryker Corporation, Performance Health, Pride Mobility Products Corp, Medline Industries Inc, Sunrise Medical (US) LLC.
3. What are the main segments of the Personal Mobility Equipment Industry?
The market segments include Product, End User.
4. Can you provide details about the market size?
The market size is estimated to be USD 13.95 Million as of 2022.
5. What are some drivers contributing to market growth?
Increase in Demand for Personal Mobility Devices in Elderly Population; Technological Advancements in the Devices.
6. What are the notable trends driving market growth?
Wheelchairs Emerged as the Largest Segment in the Personal Mobility Devices Market.
7. Are there any restraints impacting market growth?
High Cost of the Devices.
8. Can you provide examples of recent developments in the market?
In August 2021, Falcon Mobility unveiled the Ultra-Lite 2 electric wheelchair, which is designed to be lightweight and easy to maneuver. The company hopes to provide a new affordable and lightweight wheelchair option to the elderly and disabled communities with this launch, making it easier for caregivers to transport their wards' personal mobility aids to and from a vehicle.
9. What pricing options are available for accessing the report?
Pricing options include single-user, multi-user, and enterprise licenses priced at USD 4750, USD 5250, and USD 8750 respectively.
10. Is the market size provided in terms of value or volume?
The market size is provided in terms of value, measured in Million and volume, measured in K Unit.
11. Are there any specific market keywords associated with the report?
Yes, the market keyword associated with the report is "Personal Mobility Equipment Industry," which aids in identifying and referencing the specific market segment covered.
12. How do I determine which pricing option suits my needs best?
The pricing options vary based on user requirements and access needs. Individual users may opt for single-user licenses, while businesses requiring broader access may choose multi-user or enterprise licenses for cost-effective access to the report.
13. Are there any additional resources or data provided in the Personal Mobility Equipment Industry report?
While the report offers comprehensive insights, it's advisable to review the specific contents or supplementary materials provided to ascertain if additional resources or data are available.
14. How can I stay updated on further developments or reports in the Personal Mobility Equipment Industry?
To stay informed about further developments, trends, and reports in the Personal Mobility Equipment Industry, consider subscribing to industry newsletters, following relevant companies and organizations, or regularly checking reputable industry news sources and publications.
Methodology
Step 1 - Identification of Relevant Samples Size from Population Database


Step 2 - Approaches for Defining Global Market Size (Value, Volume* & Price*)

Note*: In applicable scenarios
Step 3 - Data Sources
Primary Research
- Web Analytics
- Survey Reports
- Research Institute
- Latest Research Reports
- Opinion Leaders
Secondary Research
- Annual Reports
- White Paper
- Latest Press Release
- Industry Association
- Paid Database
- Investor Presentations

Step 4 - Data Triangulation
Involves using different sources of information in order to increase the validity of a study
These sources are likely to be stakeholders in a program - participants, other researchers, program staff, other community members, and so on.
Then we put all data in single framework & apply various statistical tools to find out the dynamic on the market.
During the analysis stage, feedback from the stakeholder groups would be compared to determine areas of agreement as well as areas of divergence
