

Key Insights
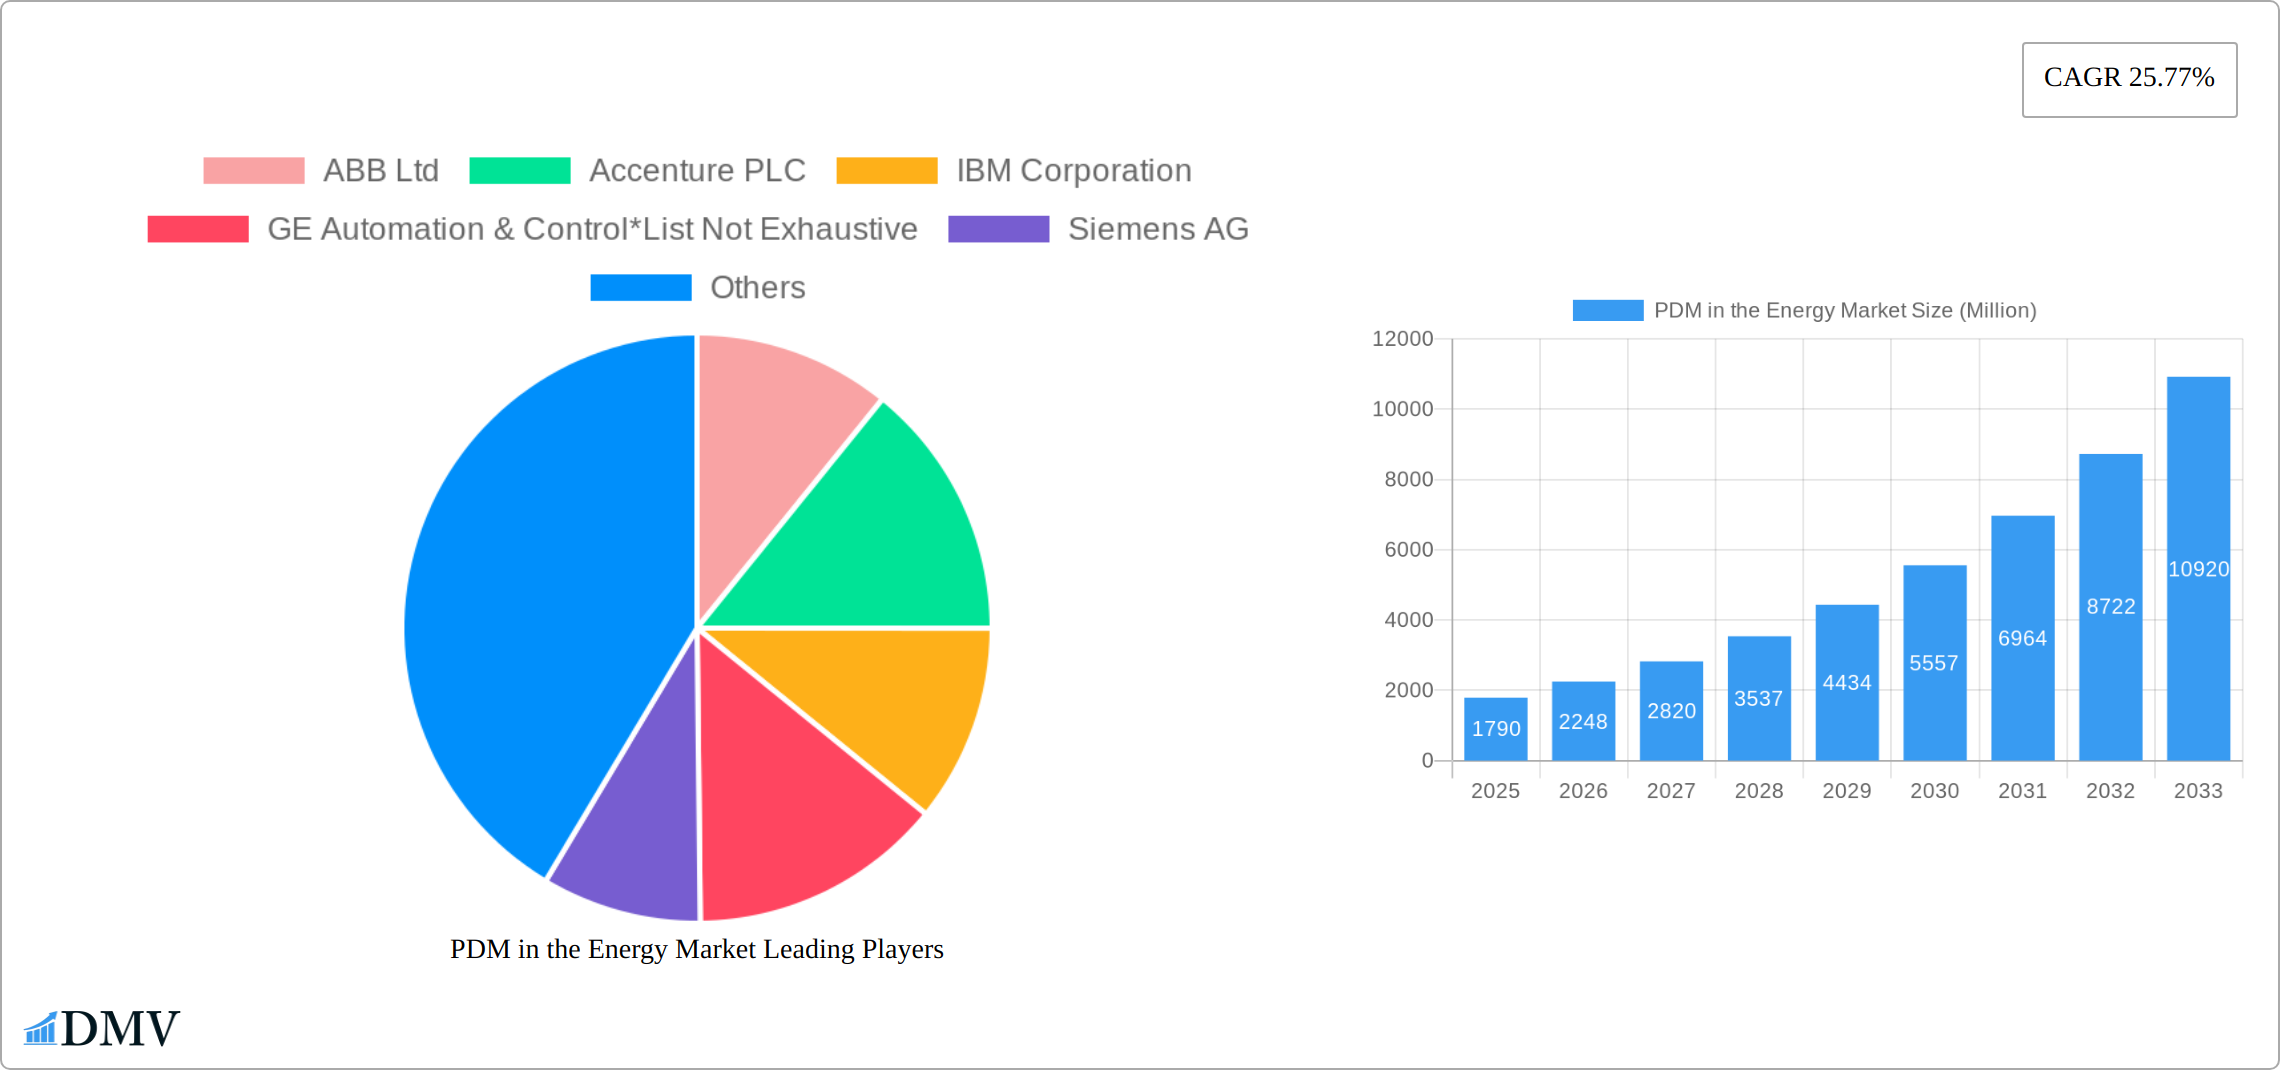
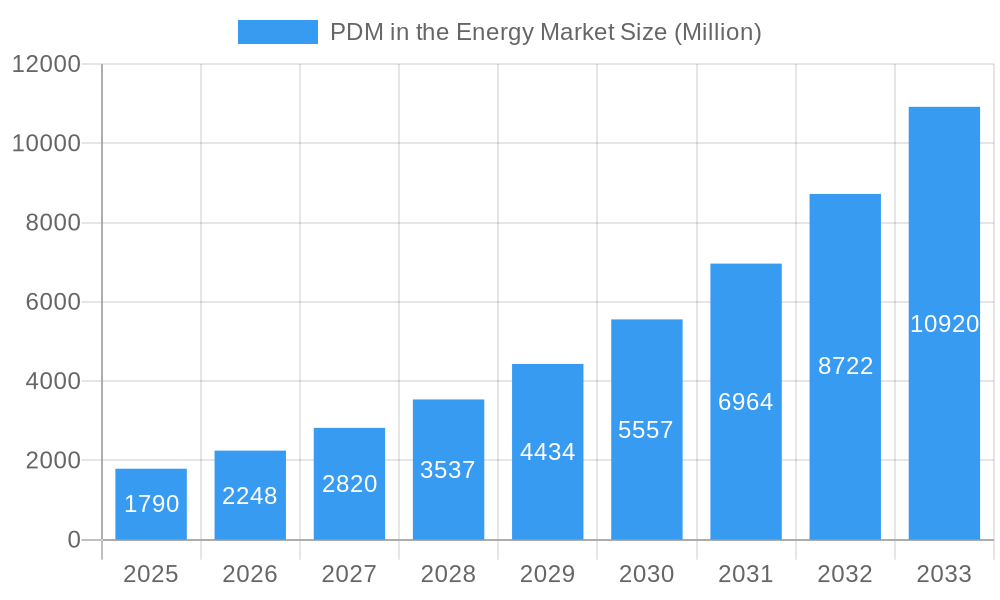
The Product Data Management (PDM) market within the energy sector is experiencing robust growth, projected to reach $1.79 billion in 2025 and maintain a Compound Annual Growth Rate (CAGR) of 25.77% from 2025 to 2033. This expansion is fueled by several key drivers. The increasing complexity of energy projects, coupled with the need for efficient collaboration across geographically dispersed teams, necessitates sophisticated PDM solutions. Furthermore, the energy industry's ongoing digital transformation initiatives, including the adoption of Industry 4.0 principles and smart grids, are significantly increasing the demand for data management systems capable of handling large volumes of diverse data. Regulations mandating enhanced data security and traceability also contribute to market growth, pushing companies to invest in robust PDM systems. The cloud-based deployment model is gaining traction, offering scalability, cost-effectiveness, and improved accessibility compared to on-premise solutions. This shift towards cloud-based solutions is expected to be a significant contributor to market expansion in the coming years. Key players like ABB, Accenture, IBM, Siemens, and Schneider Electric are actively driving innovation and market penetration through strategic partnerships, acquisitions, and the development of advanced PDM solutions tailored to the specific needs of the energy industry. Competition is fierce, emphasizing the need for continuous innovation and adaptation to market demands.
PDM in the Energy Market Market Size (In Billion)
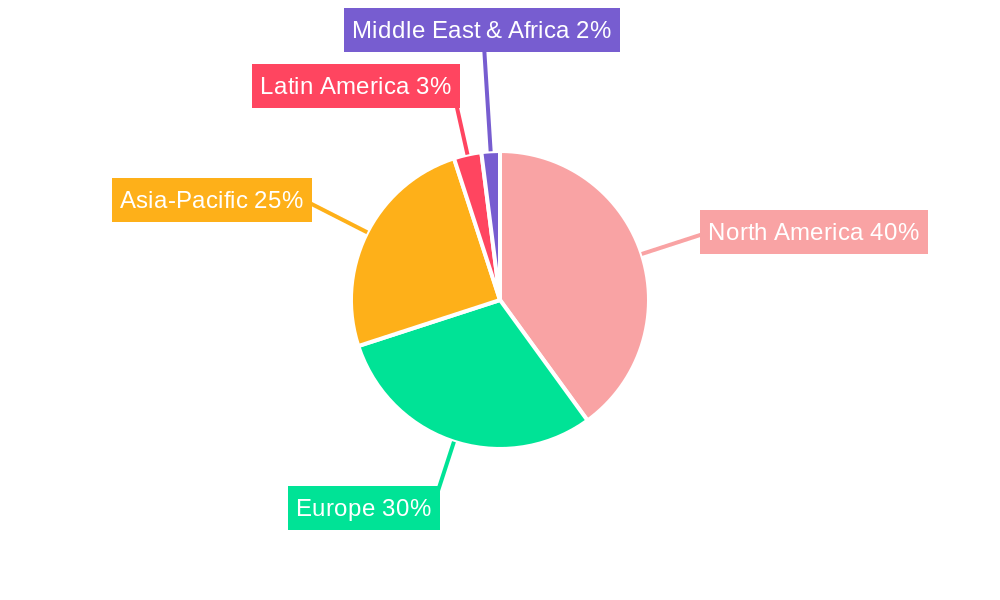
Geographic segmentation reveals North America currently holds a significant market share, driven by substantial investments in renewable energy and technological advancements in the US and Canada. However, the Asia-Pacific region is poised for substantial growth, fueled by rapid industrialization and increasing energy consumption in countries like China and India. Europe is also anticipated to witness consistent growth, supported by the ongoing transition towards sustainable energy sources and supportive government policies. While the market is segmented by offering (solutions and services) and deployment model (on-premise and cloud), the cloud-based solutions segment is witnessing significantly higher growth rates due to factors mentioned above. This dynamic landscape presents both challenges and opportunities for established players and new entrants alike, necessitating strategic planning and agility to capitalize on market trends and maintain competitiveness.
PDM in the Energy Market Company Market Share
PDM in the Energy Market: A Comprehensive Market Report (2019-2033)
This insightful report provides a detailed analysis of the Predictive Maintenance (PDM) market within the energy sector, offering a comprehensive overview of market trends, key players, and future growth prospects. The study period spans from 2019 to 2033, with 2025 serving as both the base and estimated year. The report projects a market valued at xx Million USD in 2025, experiencing significant growth during the forecast period (2025-2033). This report is invaluable for stakeholders seeking to understand and capitalize on the evolving PDM landscape in the energy industry.
PDM in the Energy Market Market Composition & Trends
The global energy sector's PDM market exhibits a moderately concentrated competitive landscape, dominated by established players like ABB Ltd, Accenture PLC, IBM Corporation, GE Automation & Control, Siemens AG, Banner Engineering Corp, Schneider Electric, Robert Bosch GmbH, Intel Corporation, and SAP SE. However, a growing number of smaller, specialized firms are entering the market, offering niche solutions and fostering innovation. This innovation is significantly driven by advancements in artificial intelligence (AI), the Internet of Things (IoT), and big data analytics, resulting in increasingly sophisticated and insightful PDM solutions. Furthermore, stringent regulatory demands for enhanced efficiency and safety within the energy industry are acting as powerful catalysts for market expansion. While substitute products are limited, primarily consisting of traditional, reactive maintenance strategies, these are rapidly becoming less economically viable compared to proactive PDM approaches. The end-user base is diverse, encompassing power generation companies, oil & gas producers, renewable energy developers, and energy grid operators. Mergers and acquisitions (M&A) activity within the PDM market has remained moderate in recent years, with average deal values approximating xx Million USD, reflecting a strategic focus on consolidation and market expansion by major players.
- Market Share Distribution (2025, Projected): ABB Ltd (xx%), Siemens AG (xx%), Schneider Electric (xx%), Others (xx%). Note: Specific percentage breakdowns are pending further market analysis.
- Average M&A Deal Value (2019-2024): xx Million USD
- Number of M&A Deals (2019-2024): xx
PDM in the Energy Market Industry Evolution
The PDM market in the energy sector is experiencing robust growth, driven by the increasing adoption of digital technologies and the need for enhanced operational efficiency and reduced downtime. The market's historical period (2019-2024) saw a Compound Annual Growth Rate (CAGR) of xx%, primarily fueled by rising energy demand and the increasing complexity of energy infrastructure. Technological advancements such as AI-powered predictive analytics, improved sensor technologies, and cloud-based platforms are further accelerating market growth. Shifting consumer demands, including a greater emphasis on sustainability and reduced environmental impact, are also influencing the adoption of PDM solutions. The forecast period (2025-2033) is expected to witness even faster growth, with a projected CAGR of xx%, driven by factors like increasing investments in renewable energy and the growing need for advanced grid management systems.
Leading Regions, Countries, or Segments in PDM in the Energy Market
North America currently holds the leading position in the energy sector's PDM market, driven by high technological adoption rates, substantial investments in modernizing energy infrastructure, and robust regulatory frameworks emphasizing safety and efficiency. Europe closely follows, benefiting from significant government support for digital transformation and green energy initiatives. The Asia-Pacific region exhibits considerable growth potential, fueled by rapid industrialization and escalating investments in renewable energy projects. This growth is further segmented as follows:
- By Offering: The Solutions segment commands the largest market share, reflecting the strong demand for comprehensive PDM platforms offering advanced analytics and seamless integration with existing energy management systems.
- By Deployment Model: Cloud-based deployments are experiencing rapid adoption due to their scalability, cost-effectiveness, and ease of access, particularly appealing to smaller energy companies and those with geographically dispersed assets.
- Key Growth Drivers:
- Substantial investments in smart grids and renewable energy infrastructure.
- Stringent government regulations focused on improving operational efficiency and safety.
- The continuous rise in global energy demand, especially within developing economies.
- Increasing focus on predictive maintenance to minimize downtime and optimize operational costs.
PDM in the Energy Market Product Innovations
Recent innovations in PDM for the energy sector include AI-powered algorithms for enhanced predictive accuracy, the integration of IoT sensors for real-time data collection, and the development of cloud-based platforms for seamless data sharing and analysis. These advancements enable more accurate predictions of equipment failures, reducing downtime and improving operational efficiency. Unique selling propositions increasingly focus on cost savings, improved asset utilization, and enhanced sustainability.
Propelling Factors for PDM in the Energy Market Growth
The expansion of the PDM market within the energy sector is propelled by several key factors: the urgent need for improved operational efficiency and reduced downtime; advancements in AI, IoT, and big data analytics, enabling more precise and timely predictions of equipment failures; regulatory pressures promoting enhanced safety and environmental compliance; the ongoing rise in energy demand, particularly in emerging markets; and the substantial investments in renewable energy and smart grid technologies. These factors collectively contribute to a robust and sustained market growth trajectory.
Obstacles in the PDM in the Energy Market Market
Despite the promising growth outlook, several challenges persist within the PDM market. These include the high upfront investment costs associated with PDM solution implementation; the requirement for skilled personnel proficient in data management and interpretation; integration complexities with legacy systems; data security concerns surrounding sensitive energy infrastructure data; and potential supply chain disruptions affecting the availability of crucial components for PDM systems, potentially leading to project delays.
Future Opportunities in the PDM in the Energy Market
Future opportunities in the PDM market for the energy sector lie in the expanding adoption of AI and ML for advanced predictive analytics, the integration of PDM solutions with energy management systems, increased utilization of IoT devices, the development of standardized platforms to ensure data interoperability, and the expansion into emerging markets particularly in developing countries which have seen significant growth in energy consumption.
Major Players in the PDM in the Energy Market Ecosystem
- ABB Ltd
- Accenture PLC
- IBM Corporation
- GE Automation & Control
- Siemens AG
- Banner Engineering Corp
- Schneider Electric
- Robert Bosch GmbH
- Intel Corporation
- SAP SE
Key Developments in PDM in the Energy Market Industry
- September 2022: Atlas AI's partnership with the Rockefeller Foundation highlights the growing focus on leveraging AI and ML technologies to address infrastructure gaps in developing economies and support the transition to cleaner energy sources. This initiative is expected to drive demand for PDM solutions in Sub-Saharan Africa.
- June 2022: Hinduja Tech's entry into the IoT market with Senseye underscores the increasing integration of AI-powered predictive maintenance solutions within the broader IoT ecosystem. This signifies a growing trend towards more comprehensive and integrated PDM offerings.
- February 2022: The European Union's significant investment in Morocco's green energy sector showcases the increasing governmental support for digital transformation initiatives within the energy industry, further stimulating the demand for PDM solutions to enhance operational efficiency and sustainability.
Strategic PDM in the Energy Market Market Forecast
The PDM market in the energy sector is projected to experience sustained growth throughout the next decade, driven by ongoing technological advancements, increasing energy demand, and persistent regulatory pressures. The convergence of AI, IoT, and cloud computing technologies will continue to fuel innovation, leading to more precise, efficient, and cost-effective PDM solutions. Expansion into new markets, particularly within developing economies, presents significant opportunities for future market expansion. This positive outlook strongly suggests a promising future for the PDM market within the energy sector.
PDM in the Energy Market Segmentation
-
1. Offering
- 1.1. Solutions
- 1.2. Services
-
2. Deployment Model
- 2.1. On-premise
- 2.2. Cloud
PDM in the Energy Market Segmentation By Geography
-
1. North America
- 1.1. United States
- 1.2. Canada
- 1.3. Mexico
-
2. South America
- 2.1. Brazil
- 2.2. Argentina
- 2.3. Rest of South America
-
3. Europe
- 3.1. United Kingdom
- 3.2. Germany
- 3.3. France
- 3.4. Italy
- 3.5. Spain
- 3.6. Russia
- 3.7. Benelux
- 3.8. Nordics
- 3.9. Rest of Europe
-
4. Middle East & Africa
- 4.1. Turkey
- 4.2. Israel
- 4.3. GCC
- 4.4. North Africa
- 4.5. South Africa
- 4.6. Rest of Middle East & Africa
-
5. Asia Pacific
- 5.1. China
- 5.2. India
- 5.3. Japan
- 5.4. South Korea
- 5.5. ASEAN
- 5.6. Oceania
- 5.7. Rest of Asia Pacific
PDM in the Energy Market Regional Market Share
Geographic Coverage of PDM in the Energy Market
PDM in the Energy Market REPORT HIGHLIGHTS
| Aspects | Details |
|---|---|
| Study Period | 2020-2034 |
| Base Year | 2025 |
| Estimated Year | 2026 |
| Forecast Period | 2026-2034 |
| Historical Period | 2020-2025 |
| Growth Rate | CAGR of 25.77% from 2020-2034 |
| Segmentation |
|
Table of Contents
- 1. Introduction
- 1.1. Research Scope
- 1.2. Market Segmentation
- 1.3. Research Objective
- 1.4. Definitions and Assumptions
- 2. Executive Summary
- 2.1. Market Snapshot
- 3. Market Dynamics
- 3.1. Market Drivers
- 3.2. Market Restrains
- 3.3. Market Trends
- 3.4. Market Opportunities
- 4. Market Factor Analysis
- 4.1. Porters Five Forces
- 4.1.1. Bargaining Power of Suppliers
- 4.1.2. Bargaining Power of Buyers
- 4.1.3. Threat of New Entrants
- 4.1.4. Threat of Substitutes
- 4.1.5. Competitive Rivalry
- 4.2. PESTEL analysis
- 4.3. BCG Analysis
- 4.3.1. Stars (High Growth, High Market Share)
- 4.3.2. Cash Cows (Low Growth, High Market Share)
- 4.3.3. Question Mark (High Growth, Low Market Share)
- 4.3.4. Dogs (Low Growth, Low Market Share)
- 4.4. Ansoff Matrix Analysis
- 4.5. Supply Chain Analysis
- 4.6. Regulatory Landscape
- 4.7. Current Market Potential and Opportunity Assessment (TAM–SAM–SOM Framework)
- 4.8. DMV Analyst Note
- 4.1. Porters Five Forces
- 5. Market Analysis, Insights and Forecast 2021-2033
- 5.1. Market Analysis, Insights and Forecast - by Offering
- 5.1.1. Solutions
- 5.1.2. Services
- 5.2. Market Analysis, Insights and Forecast - by Deployment Model
- 5.2.1. On-premise
- 5.2.2. Cloud
- 5.3. Market Analysis, Insights and Forecast - by Region
- 5.3.1. North America
- 5.3.2. South America
- 5.3.3. Europe
- 5.3.4. Middle East & Africa
- 5.3.5. Asia Pacific
- 5.1. Market Analysis, Insights and Forecast - by Offering
- 6. Global PDM in the Energy Market Analysis, Insights and Forecast, 2021-2033
- 6.1. Market Analysis, Insights and Forecast - by Offering
- 6.1.1. Solutions
- 6.1.2. Services
- 6.2. Market Analysis, Insights and Forecast - by Deployment Model
- 6.2.1. On-premise
- 6.2.2. Cloud
- 6.1. Market Analysis, Insights and Forecast - by Offering
- 7. North America PDM in the Energy Market Analysis, Insights and Forecast, 2020-2032
- 7.1. Market Analysis, Insights and Forecast - by Offering
- 7.1.1. Solutions
- 7.1.2. Services
- 7.2. Market Analysis, Insights and Forecast - by Deployment Model
- 7.2.1. On-premise
- 7.2.2. Cloud
- 7.1. Market Analysis, Insights and Forecast - by Offering
- 8. South America PDM in the Energy Market Analysis, Insights and Forecast, 2020-2032
- 8.1. Market Analysis, Insights and Forecast - by Offering
- 8.1.1. Solutions
- 8.1.2. Services
- 8.2. Market Analysis, Insights and Forecast - by Deployment Model
- 8.2.1. On-premise
- 8.2.2. Cloud
- 8.1. Market Analysis, Insights and Forecast - by Offering
- 9. Europe PDM in the Energy Market Analysis, Insights and Forecast, 2020-2032
- 9.1. Market Analysis, Insights and Forecast - by Offering
- 9.1.1. Solutions
- 9.1.2. Services
- 9.2. Market Analysis, Insights and Forecast - by Deployment Model
- 9.2.1. On-premise
- 9.2.2. Cloud
- 9.1. Market Analysis, Insights and Forecast - by Offering
- 10. Middle East & Africa PDM in the Energy Market Analysis, Insights and Forecast, 2020-2032
- 10.1. Market Analysis, Insights and Forecast - by Offering
- 10.1.1. Solutions
- 10.1.2. Services
- 10.2. Market Analysis, Insights and Forecast - by Deployment Model
- 10.2.1. On-premise
- 10.2.2. Cloud
- 10.1. Market Analysis, Insights and Forecast - by Offering
- 11. Asia Pacific PDM in the Energy Market Analysis, Insights and Forecast, 2020-2032
- 11.1. Market Analysis, Insights and Forecast - by Offering
- 11.1.1. Solutions
- 11.1.2. Services
- 11.2. Market Analysis, Insights and Forecast - by Deployment Model
- 11.2.1. On-premise
- 11.2.2. Cloud
- 11.1. Market Analysis, Insights and Forecast - by Offering
- 12. Competitive Analysis
- 12.1. Company Profiles
- 12.1.1 ABB Ltd
- 12.1.1.1. Company Overview
- 12.1.1.2. Products
- 12.1.1.3. Company Financials
- 12.1.1.4. SWOT Analysis
- 12.1.2 Accenture PLC
- 12.1.2.1. Company Overview
- 12.1.2.2. Products
- 12.1.2.3. Company Financials
- 12.1.2.4. SWOT Analysis
- 12.1.3 IBM Corporation
- 12.1.3.1. Company Overview
- 12.1.3.2. Products
- 12.1.3.3. Company Financials
- 12.1.3.4. SWOT Analysis
- 12.1.4 GE Automation & Control*List Not Exhaustive
- 12.1.4.1. Company Overview
- 12.1.4.2. Products
- 12.1.4.3. Company Financials
- 12.1.4.4. SWOT Analysis
- 12.1.5 Siemens AG
- 12.1.5.1. Company Overview
- 12.1.5.2. Products
- 12.1.5.3. Company Financials
- 12.1.5.4. SWOT Analysis
- 12.1.6 Banner Engineering Corp
- 12.1.6.1. Company Overview
- 12.1.6.2. Products
- 12.1.6.3. Company Financials
- 12.1.6.4. SWOT Analysis
- 12.1.7 Schneider Electric
- 12.1.7.1. Company Overview
- 12.1.7.2. Products
- 12.1.7.3. Company Financials
- 12.1.7.4. SWOT Analysis
- 12.1.8 Robert Bosch GmbH
- 12.1.8.1. Company Overview
- 12.1.8.2. Products
- 12.1.8.3. Company Financials
- 12.1.8.4. SWOT Analysis
- 12.1.9 Intel Corporation
- 12.1.9.1. Company Overview
- 12.1.9.2. Products
- 12.1.9.3. Company Financials
- 12.1.9.4. SWOT Analysis
- 12.1.10 SAP SE
- 12.1.10.1. Company Overview
- 12.1.10.2. Products
- 12.1.10.3. Company Financials
- 12.1.10.4. SWOT Analysis
- 12.1.1 ABB Ltd
- 12.2. Market Entropy
- 12.2.1 Company's Key Areas Served
- 12.2.2 Recent Developments
- 12.3. Company Market Share Analysis 2025
- 12.3.1 Top 5 Companies Market Share Analysis
- 12.3.2 Top 3 Companies Market Share Analysis
- 12.4. List of Potential Customers
- 13. Research Methodology
List of Figures
- Figure 1: Global PDM in the Energy Market Revenue Breakdown (Million, %) by Region 2025 & 2033
- Figure 2: North America PDM in the Energy Market Revenue (Million), by Offering 2025 & 2033
- Figure 3: North America PDM in the Energy Market Revenue Share (%), by Offering 2025 & 2033
- Figure 4: North America PDM in the Energy Market Revenue (Million), by Deployment Model 2025 & 2033
- Figure 5: North America PDM in the Energy Market Revenue Share (%), by Deployment Model 2025 & 2033
- Figure 6: North America PDM in the Energy Market Revenue (Million), by Country 2025 & 2033
- Figure 7: North America PDM in the Energy Market Revenue Share (%), by Country 2025 & 2033
- Figure 8: South America PDM in the Energy Market Revenue (Million), by Offering 2025 & 2033
- Figure 9: South America PDM in the Energy Market Revenue Share (%), by Offering 2025 & 2033
- Figure 10: South America PDM in the Energy Market Revenue (Million), by Deployment Model 2025 & 2033
- Figure 11: South America PDM in the Energy Market Revenue Share (%), by Deployment Model 2025 & 2033
- Figure 12: South America PDM in the Energy Market Revenue (Million), by Country 2025 & 2033
- Figure 13: South America PDM in the Energy Market Revenue Share (%), by Country 2025 & 2033
- Figure 14: Europe PDM in the Energy Market Revenue (Million), by Offering 2025 & 2033
- Figure 15: Europe PDM in the Energy Market Revenue Share (%), by Offering 2025 & 2033
- Figure 16: Europe PDM in the Energy Market Revenue (Million), by Deployment Model 2025 & 2033
- Figure 17: Europe PDM in the Energy Market Revenue Share (%), by Deployment Model 2025 & 2033
- Figure 18: Europe PDM in the Energy Market Revenue (Million), by Country 2025 & 2033
- Figure 19: Europe PDM in the Energy Market Revenue Share (%), by Country 2025 & 2033
- Figure 20: Middle East & Africa PDM in the Energy Market Revenue (Million), by Offering 2025 & 2033
- Figure 21: Middle East & Africa PDM in the Energy Market Revenue Share (%), by Offering 2025 & 2033
- Figure 22: Middle East & Africa PDM in the Energy Market Revenue (Million), by Deployment Model 2025 & 2033
- Figure 23: Middle East & Africa PDM in the Energy Market Revenue Share (%), by Deployment Model 2025 & 2033
- Figure 24: Middle East & Africa PDM in the Energy Market Revenue (Million), by Country 2025 & 2033
- Figure 25: Middle East & Africa PDM in the Energy Market Revenue Share (%), by Country 2025 & 2033
- Figure 26: Asia Pacific PDM in the Energy Market Revenue (Million), by Offering 2025 & 2033
- Figure 27: Asia Pacific PDM in the Energy Market Revenue Share (%), by Offering 2025 & 2033
- Figure 28: Asia Pacific PDM in the Energy Market Revenue (Million), by Deployment Model 2025 & 2033
- Figure 29: Asia Pacific PDM in the Energy Market Revenue Share (%), by Deployment Model 2025 & 2033
- Figure 30: Asia Pacific PDM in the Energy Market Revenue (Million), by Country 2025 & 2033
- Figure 31: Asia Pacific PDM in the Energy Market Revenue Share (%), by Country 2025 & 2033
List of Tables
- Table 1: Global PDM in the Energy Market Revenue Million Forecast, by Offering 2020 & 2033
- Table 2: Global PDM in the Energy Market Revenue Million Forecast, by Deployment Model 2020 & 2033
- Table 3: Global PDM in the Energy Market Revenue Million Forecast, by Region 2020 & 2033
- Table 4: Global PDM in the Energy Market Revenue Million Forecast, by Offering 2020 & 2033
- Table 5: Global PDM in the Energy Market Revenue Million Forecast, by Deployment Model 2020 & 2033
- Table 6: Global PDM in the Energy Market Revenue Million Forecast, by Country 2020 & 2033
- Table 7: United States PDM in the Energy Market Revenue (Million) Forecast, by Application 2020 & 2033
- Table 8: Canada PDM in the Energy Market Revenue (Million) Forecast, by Application 2020 & 2033
- Table 9: Mexico PDM in the Energy Market Revenue (Million) Forecast, by Application 2020 & 2033
- Table 10: Global PDM in the Energy Market Revenue Million Forecast, by Offering 2020 & 2033
- Table 11: Global PDM in the Energy Market Revenue Million Forecast, by Deployment Model 2020 & 2033
- Table 12: Global PDM in the Energy Market Revenue Million Forecast, by Country 2020 & 2033
- Table 13: Brazil PDM in the Energy Market Revenue (Million) Forecast, by Application 2020 & 2033
- Table 14: Argentina PDM in the Energy Market Revenue (Million) Forecast, by Application 2020 & 2033
- Table 15: Rest of South America PDM in the Energy Market Revenue (Million) Forecast, by Application 2020 & 2033
- Table 16: Global PDM in the Energy Market Revenue Million Forecast, by Offering 2020 & 2033
- Table 17: Global PDM in the Energy Market Revenue Million Forecast, by Deployment Model 2020 & 2033
- Table 18: Global PDM in the Energy Market Revenue Million Forecast, by Country 2020 & 2033
- Table 19: United Kingdom PDM in the Energy Market Revenue (Million) Forecast, by Application 2020 & 2033
- Table 20: Germany PDM in the Energy Market Revenue (Million) Forecast, by Application 2020 & 2033
- Table 21: France PDM in the Energy Market Revenue (Million) Forecast, by Application 2020 & 2033
- Table 22: Italy PDM in the Energy Market Revenue (Million) Forecast, by Application 2020 & 2033
- Table 23: Spain PDM in the Energy Market Revenue (Million) Forecast, by Application 2020 & 2033
- Table 24: Russia PDM in the Energy Market Revenue (Million) Forecast, by Application 2020 & 2033
- Table 25: Benelux PDM in the Energy Market Revenue (Million) Forecast, by Application 2020 & 2033
- Table 26: Nordics PDM in the Energy Market Revenue (Million) Forecast, by Application 2020 & 2033
- Table 27: Rest of Europe PDM in the Energy Market Revenue (Million) Forecast, by Application 2020 & 2033
- Table 28: Global PDM in the Energy Market Revenue Million Forecast, by Offering 2020 & 2033
- Table 29: Global PDM in the Energy Market Revenue Million Forecast, by Deployment Model 2020 & 2033
- Table 30: Global PDM in the Energy Market Revenue Million Forecast, by Country 2020 & 2033
- Table 31: Turkey PDM in the Energy Market Revenue (Million) Forecast, by Application 2020 & 2033
- Table 32: Israel PDM in the Energy Market Revenue (Million) Forecast, by Application 2020 & 2033
- Table 33: GCC PDM in the Energy Market Revenue (Million) Forecast, by Application 2020 & 2033
- Table 34: North Africa PDM in the Energy Market Revenue (Million) Forecast, by Application 2020 & 2033
- Table 35: South Africa PDM in the Energy Market Revenue (Million) Forecast, by Application 2020 & 2033
- Table 36: Rest of Middle East & Africa PDM in the Energy Market Revenue (Million) Forecast, by Application 2020 & 2033
- Table 37: Global PDM in the Energy Market Revenue Million Forecast, by Offering 2020 & 2033
- Table 38: Global PDM in the Energy Market Revenue Million Forecast, by Deployment Model 2020 & 2033
- Table 39: Global PDM in the Energy Market Revenue Million Forecast, by Country 2020 & 2033
- Table 40: China PDM in the Energy Market Revenue (Million) Forecast, by Application 2020 & 2033
- Table 41: India PDM in the Energy Market Revenue (Million) Forecast, by Application 2020 & 2033
- Table 42: Japan PDM in the Energy Market Revenue (Million) Forecast, by Application 2020 & 2033
- Table 43: South Korea PDM in the Energy Market Revenue (Million) Forecast, by Application 2020 & 2033
- Table 44: ASEAN PDM in the Energy Market Revenue (Million) Forecast, by Application 2020 & 2033
- Table 45: Oceania PDM in the Energy Market Revenue (Million) Forecast, by Application 2020 & 2033
- Table 46: Rest of Asia Pacific PDM in the Energy Market Revenue (Million) Forecast, by Application 2020 & 2033
Frequently Asked Questions
1. What is the projected Compound Annual Growth Rate (CAGR) of the PDM in the Energy Market?
The projected CAGR is approximately 25.77%.
2. Which companies are prominent players in the PDM in the Energy Market?
Key companies in the market include ABB Ltd, Accenture PLC, IBM Corporation, GE Automation & Control*List Not Exhaustive, Siemens AG, Banner Engineering Corp, Schneider Electric, Robert Bosch GmbH, Intel Corporation, SAP SE.
3. What are the main segments of the PDM in the Energy Market?
The market segments include Offering, Deployment Model.
4. Can you provide details about the market size?
The market size is estimated to be USD 1.79 Million as of 2022.
5. What are some drivers contributing to market growth?
Increasing Investments in the Energy Sector; Increasing Adoption of Automation.
6. What are the notable trends driving market growth?
Solutions Segment is Anticipated to Witness Significant Growth.
7. Are there any restraints impacting market growth?
Lack of Awareness About the Benefits of Sports Analytics Solutions.
8. Can you provide examples of recent developments in the market?
September 2022: Electricity Growth and Use in Developing Economies Atlas AI, a predictive analytics platform, partnered with the Rockefeller Foundation, a US-based energy research organization, to assist Sub-Saharan African countries such as Kenya, Rwanda, Uganda, and Nigeria in addressing the impending green infrastructure investment gap and accelerating climate action initiatives through the use of satellite data and machine learning (ML) technologies.
9. What pricing options are available for accessing the report?
Pricing options include single-user, multi-user, and enterprise licenses priced at USD 4750, USD 5250, and USD 8750 respectively.
10. Is the market size provided in terms of value or volume?
The market size is provided in terms of value, measured in Million.
11. Are there any specific market keywords associated with the report?
Yes, the market keyword associated with the report is "PDM in the Energy Market," which aids in identifying and referencing the specific market segment covered.
12. How do I determine which pricing option suits my needs best?
The pricing options vary based on user requirements and access needs. Individual users may opt for single-user licenses, while businesses requiring broader access may choose multi-user or enterprise licenses for cost-effective access to the report.
13. Are there any additional resources or data provided in the PDM in the Energy Market report?
While the report offers comprehensive insights, it's advisable to review the specific contents or supplementary materials provided to ascertain if additional resources or data are available.
14. How can I stay updated on further developments or reports in the PDM in the Energy Market?
To stay informed about further developments, trends, and reports in the PDM in the Energy Market, consider subscribing to industry newsletters, following relevant companies and organizations, or regularly checking reputable industry news sources and publications.
Methodology
Step 1 - Identification of Relevant Samples Size from Population Database


Step 2 - Approaches for Defining Global Market Size (Value, Volume* & Price*)

Note*: In applicable scenarios
Step 3 - Data Sources
Primary Research
- Web Analytics
- Survey Reports
- Research Institute
- Latest Research Reports
- Opinion Leaders
Secondary Research
- Annual Reports
- White Paper
- Latest Press Release
- Industry Association
- Paid Database
- Investor Presentations

Step 4 - Data Triangulation
Involves using different sources of information in order to increase the validity of a study
These sources are likely to be stakeholders in a program - participants, other researchers, program staff, other community members, and so on.
Then we put all data in single framework & apply various statistical tools to find out the dynamic on the market.
During the analysis stage, feedback from the stakeholder groups would be compared to determine areas of agreement as well as areas of divergence