

Key Insights
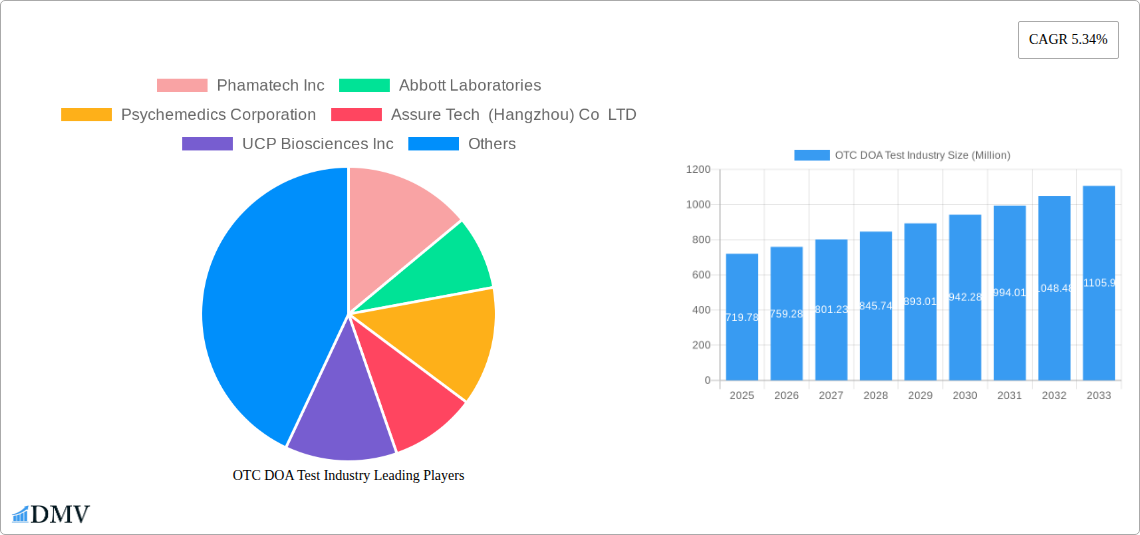
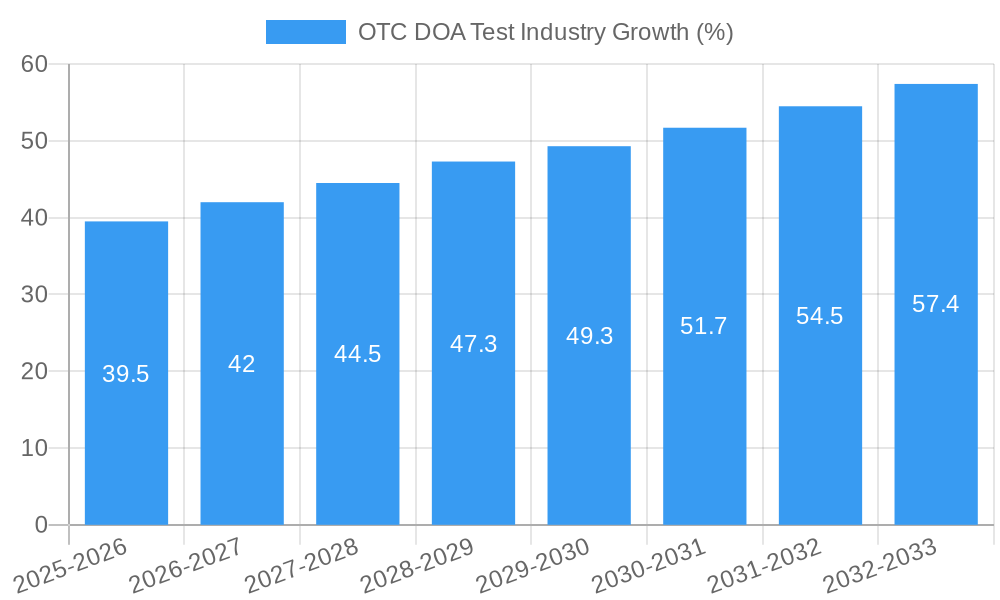
The over-the-counter (OTC) drug of abuse (DOA) testing market, valued at $719.78 million in 2025, is projected to experience robust growth, driven by increasing concerns about substance abuse and the rising demand for convenient, at-home testing solutions. The market's Compound Annual Growth Rate (CAGR) of 5.34% from 2019 to 2024 suggests a continued upward trajectory throughout the forecast period (2025-2033). Key drivers include the increasing prevalence of drug abuse across various demographics, the growing acceptance of at-home diagnostics, and the rising affordability of these tests. Technological advancements leading to improved accuracy and ease of use further fuel market expansion. The segment comprising saliva-based tests is expected to witness significant growth due to its non-invasive nature and ease of sample collection. This segment’s market share is likely greater than urine-based tests due to convenience and perceived ease of use. However, the market faces certain restraints, including concerns about the accuracy of some OTC tests and potential for misuse, leading to the need for strong regulatory oversight and consumer education. Competition is fierce amongst major players like Abbott Laboratories and Psychemedics Corporation, alongside several smaller, specialized companies, which are driving innovation and contributing to market growth through product diversification. Geographical expansion, particularly within developing economies witnessing increased awareness about drug abuse and the rising middle class, also presents promising opportunities for future growth.
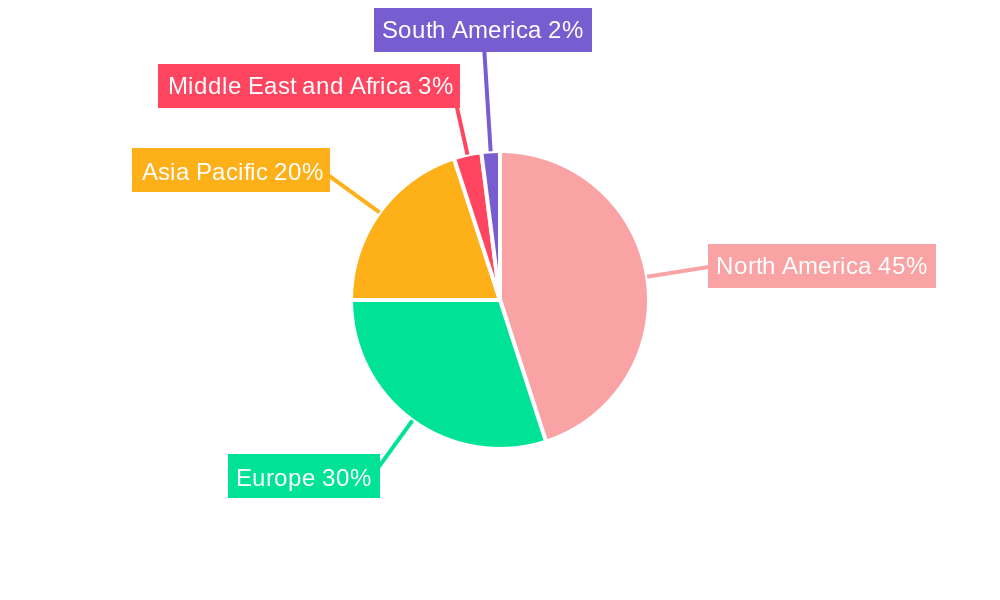
The North American region currently dominates the OTC DOA testing market, driven by high healthcare expenditure and a well-established healthcare infrastructure. However, the Asia-Pacific region is expected to showcase significant growth in the coming years, fueled by rising disposable incomes and increasing awareness of drug abuse issues. This growth is likely driven by countries such as China and India, which exhibit a substantial market potential due to their large populations and improving healthcare access. Europe, while maintaining a substantial market share, is predicted to experience a comparatively slower growth rate compared to the Asia-Pacific region, primarily due to stringent regulations and established healthcare systems that may favor professional testing over at-home options. Successful market entry into the less developed regions will hinge on addressing factors such as affordability and public awareness initiatives to drive adoption. The diverse range of testing methods (including saliva, urine, and blood tests) catering to various user preferences continues to be a major factor contributing to the overall market expansion.
OTC DOA Test Industry Market Report: 2019-2033
This comprehensive report provides an in-depth analysis of the Over-the-Counter (OTC) Drug of Abuse (DOA) Test industry, offering invaluable insights for stakeholders seeking to understand market dynamics, future trends, and strategic opportunities. The report covers the period 2019-2033, with a focus on the estimated year 2025 and a forecast period of 2025-2033. The market is segmented by test type (Test Cups, Test Strips, Others) and sample type (Saliva, Urine, Blood, Others). Key players include Phamatech Inc, Abbott Laboratories, Psychemedics Corporation, Assure Tech (Hangzhou) Co LTD, UCP Biosciences Inc, Dragerwerk AG & Co KGaA, Orient New Life Medical Co Ltd, Confirm BioSciences, and Atlas Medical GmbH. The total market value is predicted to reach xx Million by 2033.
OTC DOA Test Industry Market Composition & Trends
The OTC DOA test market exhibits a moderately concentrated landscape, with several key players holding significant market share. However, the emergence of smaller, innovative companies is increasing competition. Market share distribution in 2025 is estimated as follows: Abbott Laboratories (xx%), Phamatech Inc (xx%), Psychemedics Corporation (xx%), and Others (xx%). Innovation is driven by advancements in detection technology, improved user-friendliness, and the development of more accurate and rapid tests. Regulatory landscapes vary across regions, influencing market access and product approvals. Substitute products include professional lab-based DOA tests, but the convenience and affordability of OTC tests fuel demand. End-users primarily include individuals concerned about drug use, employers conducting workplace screenings, and healthcare providers. M&A activity has been moderate, with deal values in the past five years totaling approximately xx Million USD. Key deals include (examples of hypothetical M&A activity which must be validated):
- Acquisition of X company by Y company in 2023 for xx Million USD.
- Strategic partnership between A and B companies in 2022, focusing on joint product development.
OTC DOA Test Industry Industry Evolution
The OTC DOA test market has experienced significant growth, driven by factors such as rising awareness of drug abuse, increased demand for self-testing solutions, and advancements in testing technologies. From 2019 to 2024, the market grew at a Compound Annual Growth Rate (CAGR) of xx%, reaching xx Million USD in 2024. This growth trajectory is expected to continue, with a projected CAGR of xx% from 2025 to 2033, reaching xx Million USD by 2033. Technological advancements, such as the development of more sensitive and specific tests using advanced detection methodologies (e.g., electrochemical biosensors, microfluidics), have improved test accuracy and speed. Consumer demands are shifting towards user-friendly, rapid, and accurate tests, prompting companies to focus on product design and innovation. The growing acceptance of home-based diagnostics and the increasing availability of OTC DOA tests through online and retail channels are further stimulating market expansion. Moreover, increased government funding for drug abuse prevention and treatment initiatives is also playing a significant role in driving market growth.
Leading Regions, Countries, or Segments in OTC DOA Test Industry
The North American region currently dominates the OTC DOA test market, driven by high awareness of drug abuse, robust healthcare infrastructure, and increased regulatory support. Key drivers include:
- High prevalence of drug abuse: Leading to increased demand for self-testing and monitoring.
- Favorable regulatory environment: Enabling wider market access for OTC tests.
- Significant investments in research and development: Fueling innovation and technological advancements.
However, the European and Asia-Pacific regions are experiencing rapid growth, fueled by rising awareness, increasing healthcare spending, and the expanding availability of affordable OTC DOA tests. In terms of test type, test strips hold the largest market share due to their convenience and cost-effectiveness. Saliva-based tests are gaining popularity due to their non-invasive nature.
OTC DOA Test Industry Product Innovations
Recent innovations include improved sensitivity and specificity of tests, faster turnaround times (some providing results within minutes), and the incorporation of smartphone integration for result interpretation and data management. This trend is driven by demands for user-friendly and readily accessible testing options. Manufacturers are also focusing on developing multi-drug panels for simultaneous detection of various substances, enhancing efficiency and comprehensive testing capabilities. Unique selling propositions include rapid testing, ease of use, high accuracy, and digital connectivity.
Propelling Factors for OTC DOA Test Industry Growth
Several factors drive market growth, including technological advancements resulting in more accurate, rapid, and convenient tests, increased governmental and private funding aimed at addressing drug abuse, and growing consumer awareness and acceptance of at-home testing options. The rising prevalence of drug abuse across various demographics also necessitates efficient and accessible testing methods.
Obstacles in the OTC DOA Test Industry Market
Significant barriers include stringent regulatory approvals needed for new products, potential supply chain disruptions impacting the availability of key components, and intensive competition from established and emerging players. The accuracy and reliability of some OTC tests may also be questioned, affecting consumer trust and market adoption. These challenges could collectively impact market growth by approximately xx% annually.
Future Opportunities in OTC DOA Test Industry
Significant opportunities exist in expanding into emerging markets, developing point-of-care tests for broader accessibility, and integrating advanced technologies like AI and machine learning to improve diagnostic accuracy and interpretation. Additionally, incorporating personalized medicine approaches and developing tests catering to specific demographics and drug types could further drive market expansion.
Major Players in the OTC DOA Test Industry Ecosystem
- Abbott Laboratories
- Psychemedics Corporation
- Assure Tech (Hangzhou) Co LTD
- UCP Biosciences Inc
- Dragerwerk AG & Co KGaA
- Orient New Life Medical Co Ltd
- Confirm BioSciences
- Atlas Medical GmbH
- Phamatech Inc
Key Developments in OTC DOA Test Industry Industry
- March 2022: The Department of Health and Human Services (HHS) provided USD 58.5 Million in funding for contingency management tests for stimulant use disorder in California. This significantly boosted the market for specific DOA tests.
- October 2021: VeritequeUSA Inc. launched Verifique, its first consumer brand of narcotics and explosives testing kits, expanding the market into the consumer segment.
Strategic OTC DOA Test Industry Market Forecast
The OTC DOA test market is poised for substantial growth over the forecast period, driven by continued technological advancements, rising awareness of drug abuse, and increasing demand for convenient and affordable self-testing options. The expansion into new markets, particularly in developing economies, and the adoption of innovative testing technologies present significant opportunities for market expansion and growth. The market’s potential is considerable, with the continued need for accurate and accessible drug testing solutions.
OTC DOA Test Industry Segmentation
-
1. Type
- 1.1. Test Cups
- 1.2. Test Strips
- 1.3. Others
-
2. Sample Type
- 2.1. Saliva
- 2.2. Urine
- 2.3. Blood
- 2.4. Others
OTC DOA Test Industry Segmentation By Geography
-
1. North America
- 1.1. United States
- 1.2. Canada
- 1.3. Mexico
-
2. Europe
- 2.1. Germany
- 2.2. United Kingdom
- 2.3. France
- 2.4. Italy
- 2.5. Spain
- 2.6. Rest of Europe
-
3. Asia Pacific
- 3.1. China
- 3.2. Japan
- 3.3. India
- 3.4. Australia
- 3.5. South Korea
- 3.6. Rest of Asia Pacific
-
4. Middle East and Africa
- 4.1. GCC
- 4.2. South Africa
- 4.3. Rest of Middle East and Africa
-
5. South America
- 5.1. Brazil
- 5.2. Argentina
- 5.3. Rest of South America
OTC DOA Test Industry REPORT HIGHLIGHTS
| Aspects | Details |
|---|---|
| Study Period | 2019-2033 |
| Base Year | 2024 |
| Estimated Year | 2025 |
| Forecast Period | 2025-2033 |
| Historical Period | 2019-2024 |
| Growth Rate | CAGR of 5.34% from 2019-2033 |
| Segmentation |
|
Table of Contents
- 1. Introduction
- 1.1. Research Scope
- 1.2. Market Segmentation
- 1.3. Research Methodology
- 1.4. Definitions and Assumptions
- 2. Executive Summary
- 2.1. Introduction
- 3. Market Dynamics
- 3.1. Introduction
- 3.2. Market Drivers
- 3.2.1. Growing Use and Production of Illicit Drugs; Increasing Initiatives by Governemnt Organizations to Reduce Drug Abuse
- 3.3. Market Restrains
- 3.3.1. Lack of Awareness and Consideration of Drug Testing
- 3.4. Market Trends
- 3.4.1. Test Strip Segment is Expected to Hold a Significant Market Share Over the Forecast Period
- 4. Market Factor Analysis
- 4.1. Porters Five Forces
- 4.2. Supply/Value Chain
- 4.3. PESTEL analysis
- 4.4. Market Entropy
- 4.5. Patent/Trademark Analysis
- 5. Global OTC DOA Test Industry Analysis, Insights and Forecast, 2019-2031
- 5.1. Market Analysis, Insights and Forecast - by Type
- 5.1.1. Test Cups
- 5.1.2. Test Strips
- 5.1.3. Others
- 5.2. Market Analysis, Insights and Forecast - by Sample Type
- 5.2.1. Saliva
- 5.2.2. Urine
- 5.2.3. Blood
- 5.2.4. Others
- 5.3. Market Analysis, Insights and Forecast - by Region
- 5.3.1. North America
- 5.3.2. Europe
- 5.3.3. Asia Pacific
- 5.3.4. Middle East and Africa
- 5.3.5. South America
- 5.1. Market Analysis, Insights and Forecast - by Type
- 6. North America OTC DOA Test Industry Analysis, Insights and Forecast, 2019-2031
- 6.1. Market Analysis, Insights and Forecast - by Type
- 6.1.1. Test Cups
- 6.1.2. Test Strips
- 6.1.3. Others
- 6.2. Market Analysis, Insights and Forecast - by Sample Type
- 6.2.1. Saliva
- 6.2.2. Urine
- 6.2.3. Blood
- 6.2.4. Others
- 6.1. Market Analysis, Insights and Forecast - by Type
- 7. Europe OTC DOA Test Industry Analysis, Insights and Forecast, 2019-2031
- 7.1. Market Analysis, Insights and Forecast - by Type
- 7.1.1. Test Cups
- 7.1.2. Test Strips
- 7.1.3. Others
- 7.2. Market Analysis, Insights and Forecast - by Sample Type
- 7.2.1. Saliva
- 7.2.2. Urine
- 7.2.3. Blood
- 7.2.4. Others
- 7.1. Market Analysis, Insights and Forecast - by Type
- 8. Asia Pacific OTC DOA Test Industry Analysis, Insights and Forecast, 2019-2031
- 8.1. Market Analysis, Insights and Forecast - by Type
- 8.1.1. Test Cups
- 8.1.2. Test Strips
- 8.1.3. Others
- 8.2. Market Analysis, Insights and Forecast - by Sample Type
- 8.2.1. Saliva
- 8.2.2. Urine
- 8.2.3. Blood
- 8.2.4. Others
- 8.1. Market Analysis, Insights and Forecast - by Type
- 9. Middle East and Africa OTC DOA Test Industry Analysis, Insights and Forecast, 2019-2031
- 9.1. Market Analysis, Insights and Forecast - by Type
- 9.1.1. Test Cups
- 9.1.2. Test Strips
- 9.1.3. Others
- 9.2. Market Analysis, Insights and Forecast - by Sample Type
- 9.2.1. Saliva
- 9.2.2. Urine
- 9.2.3. Blood
- 9.2.4. Others
- 9.1. Market Analysis, Insights and Forecast - by Type
- 10. South America OTC DOA Test Industry Analysis, Insights and Forecast, 2019-2031
- 10.1. Market Analysis, Insights and Forecast - by Type
- 10.1.1. Test Cups
- 10.1.2. Test Strips
- 10.1.3. Others
- 10.2. Market Analysis, Insights and Forecast - by Sample Type
- 10.2.1. Saliva
- 10.2.2. Urine
- 10.2.3. Blood
- 10.2.4. Others
- 10.1. Market Analysis, Insights and Forecast - by Type
- 11. North America OTC DOA Test Industry Analysis, Insights and Forecast, 2019-2031
- 11.1. Market Analysis, Insights and Forecast - By Country/Sub-region
- 11.1.1 United States
- 11.1.2 Canada
- 11.1.3 Mexico
- 12. Europe OTC DOA Test Industry Analysis, Insights and Forecast, 2019-2031
- 12.1. Market Analysis, Insights and Forecast - By Country/Sub-region
- 12.1.1 Germany
- 12.1.2 United Kingdom
- 12.1.3 France
- 12.1.4 Italy
- 12.1.5 Spain
- 12.1.6 Rest of Europe
- 13. Asia Pacific OTC DOA Test Industry Analysis, Insights and Forecast, 2019-2031
- 13.1. Market Analysis, Insights and Forecast - By Country/Sub-region
- 13.1.1 China
- 13.1.2 Japan
- 13.1.3 India
- 13.1.4 Australia
- 13.1.5 South Korea
- 13.1.6 Rest of Asia Pacific
- 14. Middle East and Africa OTC DOA Test Industry Analysis, Insights and Forecast, 2019-2031
- 14.1. Market Analysis, Insights and Forecast - By Country/Sub-region
- 14.1.1 GCC
- 14.1.2 South Africa
- 14.1.3 Rest of Middle East and Africa
- 15. South America OTC DOA Test Industry Analysis, Insights and Forecast, 2019-2031
- 15.1. Market Analysis, Insights and Forecast - By Country/Sub-region
- 15.1.1 Brazil
- 15.1.2 Argentina
- 15.1.3 Rest of South America
- 16. Competitive Analysis
- 16.1. Global Market Share Analysis 2024
- 16.2. Company Profiles
- 16.2.1 Phamatech Inc
- 16.2.1.1. Overview
- 16.2.1.2. Products
- 16.2.1.3. SWOT Analysis
- 16.2.1.4. Recent Developments
- 16.2.1.5. Financials (Based on Availability)
- 16.2.2 Abbott Laboratories
- 16.2.2.1. Overview
- 16.2.2.2. Products
- 16.2.2.3. SWOT Analysis
- 16.2.2.4. Recent Developments
- 16.2.2.5. Financials (Based on Availability)
- 16.2.3 Psychemedics Corporation
- 16.2.3.1. Overview
- 16.2.3.2. Products
- 16.2.3.3. SWOT Analysis
- 16.2.3.4. Recent Developments
- 16.2.3.5. Financials (Based on Availability)
- 16.2.4 Assure Tech (Hangzhou) Co LTD
- 16.2.4.1. Overview
- 16.2.4.2. Products
- 16.2.4.3. SWOT Analysis
- 16.2.4.4. Recent Developments
- 16.2.4.5. Financials (Based on Availability)
- 16.2.5 UCP Biosciences Inc
- 16.2.5.1. Overview
- 16.2.5.2. Products
- 16.2.5.3. SWOT Analysis
- 16.2.5.4. Recent Developments
- 16.2.5.5. Financials (Based on Availability)
- 16.2.6 Dragerwerk AG & Co KGaA
- 16.2.6.1. Overview
- 16.2.6.2. Products
- 16.2.6.3. SWOT Analysis
- 16.2.6.4. Recent Developments
- 16.2.6.5. Financials (Based on Availability)
- 16.2.7 Orient New Life Medical Co Ltd
- 16.2.7.1. Overview
- 16.2.7.2. Products
- 16.2.7.3. SWOT Analysis
- 16.2.7.4. Recent Developments
- 16.2.7.5. Financials (Based on Availability)
- 16.2.8 Confirm BioSciences
- 16.2.8.1. Overview
- 16.2.8.2. Products
- 16.2.8.3. SWOT Analysis
- 16.2.8.4. Recent Developments
- 16.2.8.5. Financials (Based on Availability)
- 16.2.9 Atlas Medical GmbH
- 16.2.9.1. Overview
- 16.2.9.2. Products
- 16.2.9.3. SWOT Analysis
- 16.2.9.4. Recent Developments
- 16.2.9.5. Financials (Based on Availability)
- 16.2.1 Phamatech Inc
List of Figures
- Figure 1: Global OTC DOA Test Industry Revenue Breakdown (Million, %) by Region 2024 & 2032
- Figure 2: Global OTC DOA Test Industry Volume Breakdown (K Unit, %) by Region 2024 & 2032
- Figure 3: North America OTC DOA Test Industry Revenue (Million), by Country 2024 & 2032
- Figure 4: North America OTC DOA Test Industry Volume (K Unit), by Country 2024 & 2032
- Figure 5: North America OTC DOA Test Industry Revenue Share (%), by Country 2024 & 2032
- Figure 6: North America OTC DOA Test Industry Volume Share (%), by Country 2024 & 2032
- Figure 7: Europe OTC DOA Test Industry Revenue (Million), by Country 2024 & 2032
- Figure 8: Europe OTC DOA Test Industry Volume (K Unit), by Country 2024 & 2032
- Figure 9: Europe OTC DOA Test Industry Revenue Share (%), by Country 2024 & 2032
- Figure 10: Europe OTC DOA Test Industry Volume Share (%), by Country 2024 & 2032
- Figure 11: Asia Pacific OTC DOA Test Industry Revenue (Million), by Country 2024 & 2032
- Figure 12: Asia Pacific OTC DOA Test Industry Volume (K Unit), by Country 2024 & 2032
- Figure 13: Asia Pacific OTC DOA Test Industry Revenue Share (%), by Country 2024 & 2032
- Figure 14: Asia Pacific OTC DOA Test Industry Volume Share (%), by Country 2024 & 2032
- Figure 15: Middle East and Africa OTC DOA Test Industry Revenue (Million), by Country 2024 & 2032
- Figure 16: Middle East and Africa OTC DOA Test Industry Volume (K Unit), by Country 2024 & 2032
- Figure 17: Middle East and Africa OTC DOA Test Industry Revenue Share (%), by Country 2024 & 2032
- Figure 18: Middle East and Africa OTC DOA Test Industry Volume Share (%), by Country 2024 & 2032
- Figure 19: South America OTC DOA Test Industry Revenue (Million), by Country 2024 & 2032
- Figure 20: South America OTC DOA Test Industry Volume (K Unit), by Country 2024 & 2032
- Figure 21: South America OTC DOA Test Industry Revenue Share (%), by Country 2024 & 2032
- Figure 22: South America OTC DOA Test Industry Volume Share (%), by Country 2024 & 2032
- Figure 23: North America OTC DOA Test Industry Revenue (Million), by Type 2024 & 2032
- Figure 24: North America OTC DOA Test Industry Volume (K Unit), by Type 2024 & 2032
- Figure 25: North America OTC DOA Test Industry Revenue Share (%), by Type 2024 & 2032
- Figure 26: North America OTC DOA Test Industry Volume Share (%), by Type 2024 & 2032
- Figure 27: North America OTC DOA Test Industry Revenue (Million), by Sample Type 2024 & 2032
- Figure 28: North America OTC DOA Test Industry Volume (K Unit), by Sample Type 2024 & 2032
- Figure 29: North America OTC DOA Test Industry Revenue Share (%), by Sample Type 2024 & 2032
- Figure 30: North America OTC DOA Test Industry Volume Share (%), by Sample Type 2024 & 2032
- Figure 31: North America OTC DOA Test Industry Revenue (Million), by Country 2024 & 2032
- Figure 32: North America OTC DOA Test Industry Volume (K Unit), by Country 2024 & 2032
- Figure 33: North America OTC DOA Test Industry Revenue Share (%), by Country 2024 & 2032
- Figure 34: North America OTC DOA Test Industry Volume Share (%), by Country 2024 & 2032
- Figure 35: Europe OTC DOA Test Industry Revenue (Million), by Type 2024 & 2032
- Figure 36: Europe OTC DOA Test Industry Volume (K Unit), by Type 2024 & 2032
- Figure 37: Europe OTC DOA Test Industry Revenue Share (%), by Type 2024 & 2032
- Figure 38: Europe OTC DOA Test Industry Volume Share (%), by Type 2024 & 2032
- Figure 39: Europe OTC DOA Test Industry Revenue (Million), by Sample Type 2024 & 2032
- Figure 40: Europe OTC DOA Test Industry Volume (K Unit), by Sample Type 2024 & 2032
- Figure 41: Europe OTC DOA Test Industry Revenue Share (%), by Sample Type 2024 & 2032
- Figure 42: Europe OTC DOA Test Industry Volume Share (%), by Sample Type 2024 & 2032
- Figure 43: Europe OTC DOA Test Industry Revenue (Million), by Country 2024 & 2032
- Figure 44: Europe OTC DOA Test Industry Volume (K Unit), by Country 2024 & 2032
- Figure 45: Europe OTC DOA Test Industry Revenue Share (%), by Country 2024 & 2032
- Figure 46: Europe OTC DOA Test Industry Volume Share (%), by Country 2024 & 2032
- Figure 47: Asia Pacific OTC DOA Test Industry Revenue (Million), by Type 2024 & 2032
- Figure 48: Asia Pacific OTC DOA Test Industry Volume (K Unit), by Type 2024 & 2032
- Figure 49: Asia Pacific OTC DOA Test Industry Revenue Share (%), by Type 2024 & 2032
- Figure 50: Asia Pacific OTC DOA Test Industry Volume Share (%), by Type 2024 & 2032
- Figure 51: Asia Pacific OTC DOA Test Industry Revenue (Million), by Sample Type 2024 & 2032
- Figure 52: Asia Pacific OTC DOA Test Industry Volume (K Unit), by Sample Type 2024 & 2032
- Figure 53: Asia Pacific OTC DOA Test Industry Revenue Share (%), by Sample Type 2024 & 2032
- Figure 54: Asia Pacific OTC DOA Test Industry Volume Share (%), by Sample Type 2024 & 2032
- Figure 55: Asia Pacific OTC DOA Test Industry Revenue (Million), by Country 2024 & 2032
- Figure 56: Asia Pacific OTC DOA Test Industry Volume (K Unit), by Country 2024 & 2032
- Figure 57: Asia Pacific OTC DOA Test Industry Revenue Share (%), by Country 2024 & 2032
- Figure 58: Asia Pacific OTC DOA Test Industry Volume Share (%), by Country 2024 & 2032
- Figure 59: Middle East and Africa OTC DOA Test Industry Revenue (Million), by Type 2024 & 2032
- Figure 60: Middle East and Africa OTC DOA Test Industry Volume (K Unit), by Type 2024 & 2032
- Figure 61: Middle East and Africa OTC DOA Test Industry Revenue Share (%), by Type 2024 & 2032
- Figure 62: Middle East and Africa OTC DOA Test Industry Volume Share (%), by Type 2024 & 2032
- Figure 63: Middle East and Africa OTC DOA Test Industry Revenue (Million), by Sample Type 2024 & 2032
- Figure 64: Middle East and Africa OTC DOA Test Industry Volume (K Unit), by Sample Type 2024 & 2032
- Figure 65: Middle East and Africa OTC DOA Test Industry Revenue Share (%), by Sample Type 2024 & 2032
- Figure 66: Middle East and Africa OTC DOA Test Industry Volume Share (%), by Sample Type 2024 & 2032
- Figure 67: Middle East and Africa OTC DOA Test Industry Revenue (Million), by Country 2024 & 2032
- Figure 68: Middle East and Africa OTC DOA Test Industry Volume (K Unit), by Country 2024 & 2032
- Figure 69: Middle East and Africa OTC DOA Test Industry Revenue Share (%), by Country 2024 & 2032
- Figure 70: Middle East and Africa OTC DOA Test Industry Volume Share (%), by Country 2024 & 2032
- Figure 71: South America OTC DOA Test Industry Revenue (Million), by Type 2024 & 2032
- Figure 72: South America OTC DOA Test Industry Volume (K Unit), by Type 2024 & 2032
- Figure 73: South America OTC DOA Test Industry Revenue Share (%), by Type 2024 & 2032
- Figure 74: South America OTC DOA Test Industry Volume Share (%), by Type 2024 & 2032
- Figure 75: South America OTC DOA Test Industry Revenue (Million), by Sample Type 2024 & 2032
- Figure 76: South America OTC DOA Test Industry Volume (K Unit), by Sample Type 2024 & 2032
- Figure 77: South America OTC DOA Test Industry Revenue Share (%), by Sample Type 2024 & 2032
- Figure 78: South America OTC DOA Test Industry Volume Share (%), by Sample Type 2024 & 2032
- Figure 79: South America OTC DOA Test Industry Revenue (Million), by Country 2024 & 2032
- Figure 80: South America OTC DOA Test Industry Volume (K Unit), by Country 2024 & 2032
- Figure 81: South America OTC DOA Test Industry Revenue Share (%), by Country 2024 & 2032
- Figure 82: South America OTC DOA Test Industry Volume Share (%), by Country 2024 & 2032
List of Tables
- Table 1: Global OTC DOA Test Industry Revenue Million Forecast, by Region 2019 & 2032
- Table 2: Global OTC DOA Test Industry Volume K Unit Forecast, by Region 2019 & 2032
- Table 3: Global OTC DOA Test Industry Revenue Million Forecast, by Type 2019 & 2032
- Table 4: Global OTC DOA Test Industry Volume K Unit Forecast, by Type 2019 & 2032
- Table 5: Global OTC DOA Test Industry Revenue Million Forecast, by Sample Type 2019 & 2032
- Table 6: Global OTC DOA Test Industry Volume K Unit Forecast, by Sample Type 2019 & 2032
- Table 7: Global OTC DOA Test Industry Revenue Million Forecast, by Region 2019 & 2032
- Table 8: Global OTC DOA Test Industry Volume K Unit Forecast, by Region 2019 & 2032
- Table 9: Global OTC DOA Test Industry Revenue Million Forecast, by Country 2019 & 2032
- Table 10: Global OTC DOA Test Industry Volume K Unit Forecast, by Country 2019 & 2032
- Table 11: United States OTC DOA Test Industry Revenue (Million) Forecast, by Application 2019 & 2032
- Table 12: United States OTC DOA Test Industry Volume (K Unit) Forecast, by Application 2019 & 2032
- Table 13: Canada OTC DOA Test Industry Revenue (Million) Forecast, by Application 2019 & 2032
- Table 14: Canada OTC DOA Test Industry Volume (K Unit) Forecast, by Application 2019 & 2032
- Table 15: Mexico OTC DOA Test Industry Revenue (Million) Forecast, by Application 2019 & 2032
- Table 16: Mexico OTC DOA Test Industry Volume (K Unit) Forecast, by Application 2019 & 2032
- Table 17: Global OTC DOA Test Industry Revenue Million Forecast, by Country 2019 & 2032
- Table 18: Global OTC DOA Test Industry Volume K Unit Forecast, by Country 2019 & 2032
- Table 19: Germany OTC DOA Test Industry Revenue (Million) Forecast, by Application 2019 & 2032
- Table 20: Germany OTC DOA Test Industry Volume (K Unit) Forecast, by Application 2019 & 2032
- Table 21: United Kingdom OTC DOA Test Industry Revenue (Million) Forecast, by Application 2019 & 2032
- Table 22: United Kingdom OTC DOA Test Industry Volume (K Unit) Forecast, by Application 2019 & 2032
- Table 23: France OTC DOA Test Industry Revenue (Million) Forecast, by Application 2019 & 2032
- Table 24: France OTC DOA Test Industry Volume (K Unit) Forecast, by Application 2019 & 2032
- Table 25: Italy OTC DOA Test Industry Revenue (Million) Forecast, by Application 2019 & 2032
- Table 26: Italy OTC DOA Test Industry Volume (K Unit) Forecast, by Application 2019 & 2032
- Table 27: Spain OTC DOA Test Industry Revenue (Million) Forecast, by Application 2019 & 2032
- Table 28: Spain OTC DOA Test Industry Volume (K Unit) Forecast, by Application 2019 & 2032
- Table 29: Rest of Europe OTC DOA Test Industry Revenue (Million) Forecast, by Application 2019 & 2032
- Table 30: Rest of Europe OTC DOA Test Industry Volume (K Unit) Forecast, by Application 2019 & 2032
- Table 31: Global OTC DOA Test Industry Revenue Million Forecast, by Country 2019 & 2032
- Table 32: Global OTC DOA Test Industry Volume K Unit Forecast, by Country 2019 & 2032
- Table 33: China OTC DOA Test Industry Revenue (Million) Forecast, by Application 2019 & 2032
- Table 34: China OTC DOA Test Industry Volume (K Unit) Forecast, by Application 2019 & 2032
- Table 35: Japan OTC DOA Test Industry Revenue (Million) Forecast, by Application 2019 & 2032
- Table 36: Japan OTC DOA Test Industry Volume (K Unit) Forecast, by Application 2019 & 2032
- Table 37: India OTC DOA Test Industry Revenue (Million) Forecast, by Application 2019 & 2032
- Table 38: India OTC DOA Test Industry Volume (K Unit) Forecast, by Application 2019 & 2032
- Table 39: Australia OTC DOA Test Industry Revenue (Million) Forecast, by Application 2019 & 2032
- Table 40: Australia OTC DOA Test Industry Volume (K Unit) Forecast, by Application 2019 & 2032
- Table 41: South Korea OTC DOA Test Industry Revenue (Million) Forecast, by Application 2019 & 2032
- Table 42: South Korea OTC DOA Test Industry Volume (K Unit) Forecast, by Application 2019 & 2032
- Table 43: Rest of Asia Pacific OTC DOA Test Industry Revenue (Million) Forecast, by Application 2019 & 2032
- Table 44: Rest of Asia Pacific OTC DOA Test Industry Volume (K Unit) Forecast, by Application 2019 & 2032
- Table 45: Global OTC DOA Test Industry Revenue Million Forecast, by Country 2019 & 2032
- Table 46: Global OTC DOA Test Industry Volume K Unit Forecast, by Country 2019 & 2032
- Table 47: GCC OTC DOA Test Industry Revenue (Million) Forecast, by Application 2019 & 2032
- Table 48: GCC OTC DOA Test Industry Volume (K Unit) Forecast, by Application 2019 & 2032
- Table 49: South Africa OTC DOA Test Industry Revenue (Million) Forecast, by Application 2019 & 2032
- Table 50: South Africa OTC DOA Test Industry Volume (K Unit) Forecast, by Application 2019 & 2032
- Table 51: Rest of Middle East and Africa OTC DOA Test Industry Revenue (Million) Forecast, by Application 2019 & 2032
- Table 52: Rest of Middle East and Africa OTC DOA Test Industry Volume (K Unit) Forecast, by Application 2019 & 2032
- Table 53: Global OTC DOA Test Industry Revenue Million Forecast, by Country 2019 & 2032
- Table 54: Global OTC DOA Test Industry Volume K Unit Forecast, by Country 2019 & 2032
- Table 55: Brazil OTC DOA Test Industry Revenue (Million) Forecast, by Application 2019 & 2032
- Table 56: Brazil OTC DOA Test Industry Volume (K Unit) Forecast, by Application 2019 & 2032
- Table 57: Argentina OTC DOA Test Industry Revenue (Million) Forecast, by Application 2019 & 2032
- Table 58: Argentina OTC DOA Test Industry Volume (K Unit) Forecast, by Application 2019 & 2032
- Table 59: Rest of South America OTC DOA Test Industry Revenue (Million) Forecast, by Application 2019 & 2032
- Table 60: Rest of South America OTC DOA Test Industry Volume (K Unit) Forecast, by Application 2019 & 2032
- Table 61: Global OTC DOA Test Industry Revenue Million Forecast, by Type 2019 & 2032
- Table 62: Global OTC DOA Test Industry Volume K Unit Forecast, by Type 2019 & 2032
- Table 63: Global OTC DOA Test Industry Revenue Million Forecast, by Sample Type 2019 & 2032
- Table 64: Global OTC DOA Test Industry Volume K Unit Forecast, by Sample Type 2019 & 2032
- Table 65: Global OTC DOA Test Industry Revenue Million Forecast, by Country 2019 & 2032
- Table 66: Global OTC DOA Test Industry Volume K Unit Forecast, by Country 2019 & 2032
- Table 67: United States OTC DOA Test Industry Revenue (Million) Forecast, by Application 2019 & 2032
- Table 68: United States OTC DOA Test Industry Volume (K Unit) Forecast, by Application 2019 & 2032
- Table 69: Canada OTC DOA Test Industry Revenue (Million) Forecast, by Application 2019 & 2032
- Table 70: Canada OTC DOA Test Industry Volume (K Unit) Forecast, by Application 2019 & 2032
- Table 71: Mexico OTC DOA Test Industry Revenue (Million) Forecast, by Application 2019 & 2032
- Table 72: Mexico OTC DOA Test Industry Volume (K Unit) Forecast, by Application 2019 & 2032
- Table 73: Global OTC DOA Test Industry Revenue Million Forecast, by Type 2019 & 2032
- Table 74: Global OTC DOA Test Industry Volume K Unit Forecast, by Type 2019 & 2032
- Table 75: Global OTC DOA Test Industry Revenue Million Forecast, by Sample Type 2019 & 2032
- Table 76: Global OTC DOA Test Industry Volume K Unit Forecast, by Sample Type 2019 & 2032
- Table 77: Global OTC DOA Test Industry Revenue Million Forecast, by Country 2019 & 2032
- Table 78: Global OTC DOA Test Industry Volume K Unit Forecast, by Country 2019 & 2032
- Table 79: Germany OTC DOA Test Industry Revenue (Million) Forecast, by Application 2019 & 2032
- Table 80: Germany OTC DOA Test Industry Volume (K Unit) Forecast, by Application 2019 & 2032
- Table 81: United Kingdom OTC DOA Test Industry Revenue (Million) Forecast, by Application 2019 & 2032
- Table 82: United Kingdom OTC DOA Test Industry Volume (K Unit) Forecast, by Application 2019 & 2032
- Table 83: France OTC DOA Test Industry Revenue (Million) Forecast, by Application 2019 & 2032
- Table 84: France OTC DOA Test Industry Volume (K Unit) Forecast, by Application 2019 & 2032
- Table 85: Italy OTC DOA Test Industry Revenue (Million) Forecast, by Application 2019 & 2032
- Table 86: Italy OTC DOA Test Industry Volume (K Unit) Forecast, by Application 2019 & 2032
- Table 87: Spain OTC DOA Test Industry Revenue (Million) Forecast, by Application 2019 & 2032
- Table 88: Spain OTC DOA Test Industry Volume (K Unit) Forecast, by Application 2019 & 2032
- Table 89: Rest of Europe OTC DOA Test Industry Revenue (Million) Forecast, by Application 2019 & 2032
- Table 90: Rest of Europe OTC DOA Test Industry Volume (K Unit) Forecast, by Application 2019 & 2032
- Table 91: Global OTC DOA Test Industry Revenue Million Forecast, by Type 2019 & 2032
- Table 92: Global OTC DOA Test Industry Volume K Unit Forecast, by Type 2019 & 2032
- Table 93: Global OTC DOA Test Industry Revenue Million Forecast, by Sample Type 2019 & 2032
- Table 94: Global OTC DOA Test Industry Volume K Unit Forecast, by Sample Type 2019 & 2032
- Table 95: Global OTC DOA Test Industry Revenue Million Forecast, by Country 2019 & 2032
- Table 96: Global OTC DOA Test Industry Volume K Unit Forecast, by Country 2019 & 2032
- Table 97: China OTC DOA Test Industry Revenue (Million) Forecast, by Application 2019 & 2032
- Table 98: China OTC DOA Test Industry Volume (K Unit) Forecast, by Application 2019 & 2032
- Table 99: Japan OTC DOA Test Industry Revenue (Million) Forecast, by Application 2019 & 2032
- Table 100: Japan OTC DOA Test Industry Volume (K Unit) Forecast, by Application 2019 & 2032
- Table 101: India OTC DOA Test Industry Revenue (Million) Forecast, by Application 2019 & 2032
- Table 102: India OTC DOA Test Industry Volume (K Unit) Forecast, by Application 2019 & 2032
- Table 103: Australia OTC DOA Test Industry Revenue (Million) Forecast, by Application 2019 & 2032
- Table 104: Australia OTC DOA Test Industry Volume (K Unit) Forecast, by Application 2019 & 2032
- Table 105: South Korea OTC DOA Test Industry Revenue (Million) Forecast, by Application 2019 & 2032
- Table 106: South Korea OTC DOA Test Industry Volume (K Unit) Forecast, by Application 2019 & 2032
- Table 107: Rest of Asia Pacific OTC DOA Test Industry Revenue (Million) Forecast, by Application 2019 & 2032
- Table 108: Rest of Asia Pacific OTC DOA Test Industry Volume (K Unit) Forecast, by Application 2019 & 2032
- Table 109: Global OTC DOA Test Industry Revenue Million Forecast, by Type 2019 & 2032
- Table 110: Global OTC DOA Test Industry Volume K Unit Forecast, by Type 2019 & 2032
- Table 111: Global OTC DOA Test Industry Revenue Million Forecast, by Sample Type 2019 & 2032
- Table 112: Global OTC DOA Test Industry Volume K Unit Forecast, by Sample Type 2019 & 2032
- Table 113: Global OTC DOA Test Industry Revenue Million Forecast, by Country 2019 & 2032
- Table 114: Global OTC DOA Test Industry Volume K Unit Forecast, by Country 2019 & 2032
- Table 115: GCC OTC DOA Test Industry Revenue (Million) Forecast, by Application 2019 & 2032
- Table 116: GCC OTC DOA Test Industry Volume (K Unit) Forecast, by Application 2019 & 2032
- Table 117: South Africa OTC DOA Test Industry Revenue (Million) Forecast, by Application 2019 & 2032
- Table 118: South Africa OTC DOA Test Industry Volume (K Unit) Forecast, by Application 2019 & 2032
- Table 119: Rest of Middle East and Africa OTC DOA Test Industry Revenue (Million) Forecast, by Application 2019 & 2032
- Table 120: Rest of Middle East and Africa OTC DOA Test Industry Volume (K Unit) Forecast, by Application 2019 & 2032
- Table 121: Global OTC DOA Test Industry Revenue Million Forecast, by Type 2019 & 2032
- Table 122: Global OTC DOA Test Industry Volume K Unit Forecast, by Type 2019 & 2032
- Table 123: Global OTC DOA Test Industry Revenue Million Forecast, by Sample Type 2019 & 2032
- Table 124: Global OTC DOA Test Industry Volume K Unit Forecast, by Sample Type 2019 & 2032
- Table 125: Global OTC DOA Test Industry Revenue Million Forecast, by Country 2019 & 2032
- Table 126: Global OTC DOA Test Industry Volume K Unit Forecast, by Country 2019 & 2032
- Table 127: Brazil OTC DOA Test Industry Revenue (Million) Forecast, by Application 2019 & 2032
- Table 128: Brazil OTC DOA Test Industry Volume (K Unit) Forecast, by Application 2019 & 2032
- Table 129: Argentina OTC DOA Test Industry Revenue (Million) Forecast, by Application 2019 & 2032
- Table 130: Argentina OTC DOA Test Industry Volume (K Unit) Forecast, by Application 2019 & 2032
- Table 131: Rest of South America OTC DOA Test Industry Revenue (Million) Forecast, by Application 2019 & 2032
- Table 132: Rest of South America OTC DOA Test Industry Volume (K Unit) Forecast, by Application 2019 & 2032
Frequently Asked Questions
1. What is the projected Compound Annual Growth Rate (CAGR) of the OTC DOA Test Industry?
The projected CAGR is approximately 5.34%.
2. Which companies are prominent players in the OTC DOA Test Industry?
Key companies in the market include Phamatech Inc, Abbott Laboratories, Psychemedics Corporation, Assure Tech (Hangzhou) Co LTD, UCP Biosciences Inc, Dragerwerk AG & Co KGaA, Orient New Life Medical Co Ltd, Confirm BioSciences, Atlas Medical GmbH.
3. What are the main segments of the OTC DOA Test Industry?
The market segments include Type, Sample Type.
4. Can you provide details about the market size?
The market size is estimated to be USD 719.78 Million as of 2022.
5. What are some drivers contributing to market growth?
Growing Use and Production of Illicit Drugs; Increasing Initiatives by Governemnt Organizations to Reduce Drug Abuse.
6. What are the notable trends driving market growth?
Test Strip Segment is Expected to Hold a Significant Market Share Over the Forecast Period.
7. Are there any restraints impacting market growth?
Lack of Awareness and Consideration of Drug Testing.
8. Can you provide examples of recent developments in the market?
In March 2022, the Department of Health and Human Services (HHS) offered funding of USD 58.5 million in contingency management tests for people with stimulant use disorder in California.
9. What pricing options are available for accessing the report?
Pricing options include single-user, multi-user, and enterprise licenses priced at USD 4750, USD 5250, and USD 8750 respectively.
10. Is the market size provided in terms of value or volume?
The market size is provided in terms of value, measured in Million and volume, measured in K Unit.
11. Are there any specific market keywords associated with the report?
Yes, the market keyword associated with the report is "OTC DOA Test Industry," which aids in identifying and referencing the specific market segment covered.
12. How do I determine which pricing option suits my needs best?
The pricing options vary based on user requirements and access needs. Individual users may opt for single-user licenses, while businesses requiring broader access may choose multi-user or enterprise licenses for cost-effective access to the report.
13. Are there any additional resources or data provided in the OTC DOA Test Industry report?
While the report offers comprehensive insights, it's advisable to review the specific contents or supplementary materials provided to ascertain if additional resources or data are available.
14. How can I stay updated on further developments or reports in the OTC DOA Test Industry?
To stay informed about further developments, trends, and reports in the OTC DOA Test Industry, consider subscribing to industry newsletters, following relevant companies and organizations, or regularly checking reputable industry news sources and publications.
Methodology
Step 1 - Identification of Relevant Samples Size from Population Database


Step 2 - Approaches for Defining Global Market Size (Value, Volume* & Price*)

Note*: In applicable scenarios
Step 3 - Data Sources
Primary Research
- Web Analytics
- Survey Reports
- Research Institute
- Latest Research Reports
- Opinion Leaders
Secondary Research
- Annual Reports
- White Paper
- Latest Press Release
- Industry Association
- Paid Database
- Investor Presentations

Step 4 - Data Triangulation
Involves using different sources of information in order to increase the validity of a study
These sources are likely to be stakeholders in a program - participants, other researchers, program staff, other community members, and so on.
Then we put all data in single framework & apply various statistical tools to find out the dynamic on the market.
During the analysis stage, feedback from the stakeholder groups would be compared to determine areas of agreement as well as areas of divergence
