

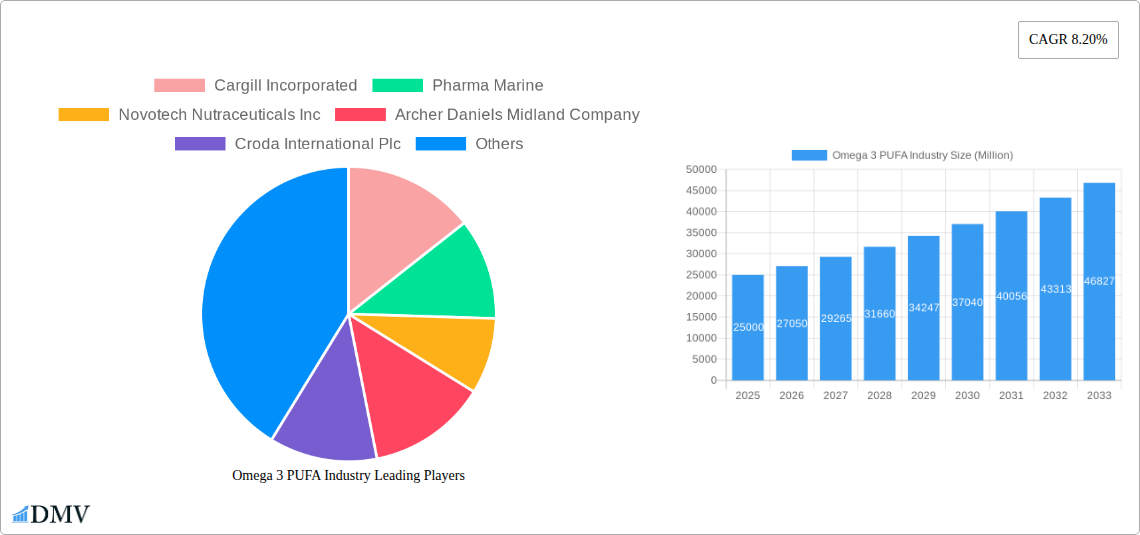
Key Insights
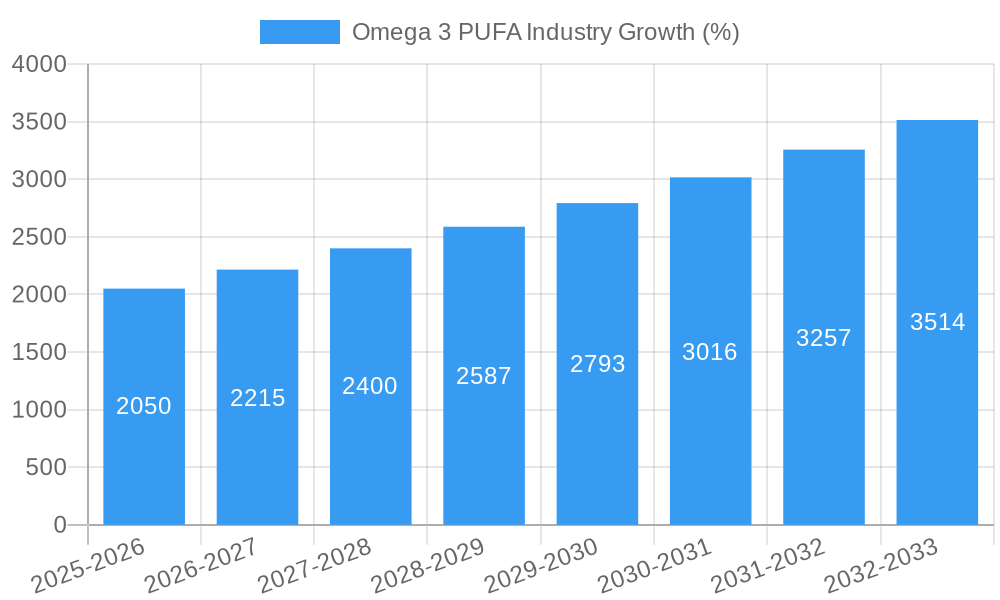
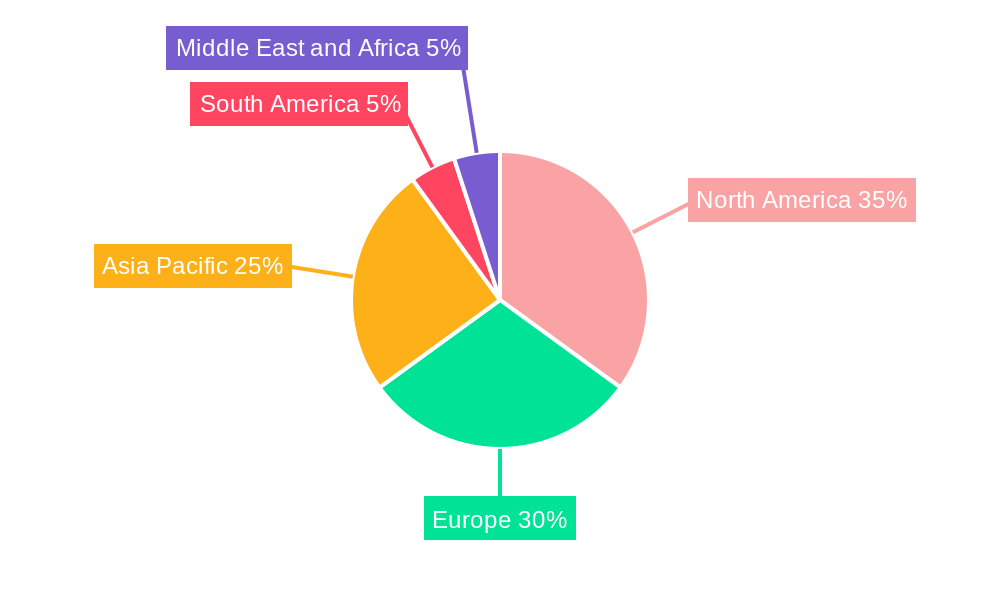
The global Omega-3 Polyunsaturated Fatty Acid (PUFA) market is experiencing robust growth, projected to reach a substantial size by 2033. A compound annual growth rate (CAGR) of 8.20% from 2019 to 2024 suggests a continuously expanding market driven by several key factors. Increasing consumer awareness of the health benefits associated with Omega-3s, particularly their role in cardiovascular health, brain function, and reducing inflammation, is a major driver. The growing prevalence of chronic diseases like heart disease and arthritis further fuels demand for Omega-3 supplements and functional foods enriched with these essential fatty acids. Expanding applications in infant formula, dietary supplements, and pharmaceuticals contribute significantly to market expansion. The market is segmented by source (plant and marine), type (DHA, EPA, ALA), concentration, and application, each presenting unique growth opportunities. The high concentration segment is expected to dominate due to its superior efficacy and higher price point. Geographically, North America and Europe currently hold significant market shares, fueled by high consumer awareness and established healthcare infrastructure. However, rapidly growing economies in the Asia-Pacific region present promising future growth potential, driven by increasing disposable incomes and rising health consciousness. While some restraints exist, such as price volatility of raw materials and stringent regulations surrounding food and supplement labeling, these are unlikely to significantly impede the overall market expansion in the forecast period (2025-2033).
The competitive landscape is characterized by the presence of both large multinational corporations and smaller specialized players. Key industry players, including Cargill, Pharma Marine, and others, are actively involved in research and development, focusing on innovations such as improved extraction technologies and enhanced product formulations. Strategic partnerships, mergers, and acquisitions are anticipated to further shape the market landscape, leading to increased consolidation and greater market share for leading players. Future growth will likely be influenced by technological advancements in Omega-3 production, enhanced product delivery systems (like liposomal formulations), and increasing focus on sustainability and traceability of sourcing. Overall, the Omega-3 PUFA market demonstrates a strong trajectory, driven by robust demand, expanding applications, and an increasingly health-conscious global population. The market is poised for significant growth throughout the projected period.
Omega-3 PUFA Industry Market Report: 2019-2033
This comprehensive report provides an in-depth analysis of the global Omega-3 PUFA industry, projecting a market valued at xx Million by 2033. Covering the period from 2019 to 2033 (base year 2025, forecast period 2025-2033), this report is essential for stakeholders seeking to understand market dynamics, future trends, and strategic opportunities within this rapidly evolving sector. The analysis delves into key segments including source (plant, marine), type (DHA, EPA, ALA, others), concentration (high, medium, low), and application (food & beverages, infant formula, dietary supplements, pharmaceuticals, animal nutrition). Leading players such as Cargill Incorporated, Pharma Marine, and others are profiled, offering insights into their strategies and market positions.
Omega-3 PUFA Industry Market Composition & Trends
The Omega-3 PUFA market is characterized by a moderately concentrated landscape, with several major players holding significant market share. Market concentration is expected to shift slightly over the forecast period due to M&A activity and new entrants. Innovation is driven by consumer demand for healthier products and advancements in extraction and purification technologies. Regulatory landscapes vary across regions, impacting product approvals and labeling requirements. Substitute products, such as plant-based alternatives, are gaining traction, increasing competition. End-users span diverse sectors, from food and beverage manufacturers to pharmaceutical companies. Significant M&A activity has shaped the industry, with deals exceeding xx Million in value in recent years.
- Market Share Distribution (2024): Cargill Incorporated (xx%), Pharma Marine (xx%), Archer Daniels Midland Company (xx%), Others (xx%). Precise figures are subject to detailed analysis within the report.
- M&A Activity (2019-2024): Significant deals include Cargill's acquisition of Croda's bio-based industrial business in 2021.
- Regulatory Landscape: Varying regulations across regions influence product development and market access.
- Substitute Products: Plant-based omega-3 sources are increasingly competitive.
Omega-3 PUFA Industry Industry Evolution
The Omega-3 PUFA market has witnessed robust growth over the past five years, driven by increasing consumer awareness of health benefits and the expanding applications across various industries. Technological advancements in extraction and purification processes have led to higher purity and yield, reducing costs and improving product quality. Consumer demand is shifting toward sustainably sourced and high-concentration products, shaping industry innovations. The market is expected to maintain a Compound Annual Growth Rate (CAGR) of xx% during the forecast period (2025-2033), reaching xx Million by 2033.
- Growth Rate (2019-2024): xx% CAGR
- Projected Growth Rate (2025-2033): xx% CAGR
- Technological Advancements: Improved extraction techniques, higher purity products, and sustainable sourcing are key drivers.
- Shifting Consumer Demands: Growing preference for sustainable, high-concentration, and plant-based alternatives.
Leading Regions, Countries, or Segments in Omega-3 PUFA Industry
The North American and European regions currently dominate the Omega-3 PUFA market, driven by high consumer awareness and established regulatory frameworks. Within the segments, marine-sourced Omega-3s, particularly EPA and DHA, hold the largest market share due to their high efficacy. High-concentrated products are also preferred, particularly in the dietary supplement and pharmaceutical segments. Growth is expected in the Asia-Pacific region, driven by rising disposable incomes and increasing health consciousness.
- Key Drivers:
- North America: High consumer awareness, established distribution networks.
- Europe: Stringent regulations promoting product quality and safety.
- Asia-Pacific: Rising disposable incomes, increasing health consciousness.
- Dominant Segments:
- Source: Marine-derived Omega-3s hold the largest market share.
- Type: EPA and DHA are the most widely consumed Omega-3 fatty acids.
- Concentration: High-concentrated products command premium pricing.
- Application: Dietary supplements represent a major application segment.
Omega-3 PUFA Industry Product Innovations
Recent innovations focus on improving the stability, bioavailability, and sustainability of Omega-3 PUFA products. New delivery systems, such as microencapsulation and liposomal formulations, enhance absorption and reduce oxidation. Sustainable sourcing practices are becoming increasingly important, with companies investing in environmentally friendly extraction methods and reducing their carbon footprint. These innovations aim to deliver superior products that cater to growing consumer demand for high-quality, sustainable Omega-3 supplements.
Propelling Factors for Omega-3 PUFA Industry Growth
The Omega-3 PUFA market is fueled by several factors. Increasing scientific evidence highlighting the health benefits of Omega-3s, coupled with rising consumer awareness, drives demand. Government regulations promoting healthy diets and the growing prevalence of chronic diseases further contribute to market growth. The expansion of the dietary supplement and functional food markets provides significant opportunities for Omega-3 PUFA producers. Technological advancements in extraction and purification also enhance the market's overall growth.
Obstacles in the Omega-3 PUFA Industry Market
The Omega-3 PUFA industry faces challenges, including volatile raw material prices, particularly for marine-sourced Omega-3s. Supply chain disruptions can impact production and pricing. Stringent regulations regarding labeling and purity standards impose costs on manufacturers. Intense competition, particularly from plant-based alternatives, also puts pressure on profit margins. Fluctuations in global fish stocks are another significant concern for sustainability.
Future Opportunities in Omega-3 PUFA Industry
Future opportunities lie in developing innovative delivery systems, such as microencapsulation for enhanced bioavailability, and sustainable sourcing practices to meet consumer demand. Expanding into new markets, particularly in developing economies with rising health consciousness, presents significant potential. Formulating products targeted at specific health conditions offers further growth prospects. Research and development in novel Omega-3 sources and applications will drive innovation and market expansion.
Major Players in the Omega-3 PUFA Industry Ecosystem
- Cargill Incorporated
- Pharma Marine
- Novotech Nutraceuticals Inc
- Archer Daniels Midland Company
- Croda International Plc
- BASF SE
- Stepan company
- Omega Protein Corporation
- Corbion NV
- Clover Corporation Ltd
Key Developments in Omega-3 PUFA Industry Industry
- 2021: Cargill Incorporated acquires Croda's biobased industrial business, expanding its product portfolio and technological capabilities in Omega-3 PUFA production.
- 2021: Pharma Marine partners with GEA to expand fish oil production on Norway's west coast, enhancing its supply chain and production capacity.
Strategic Omega-3 PUFA Industry Market Forecast
The Omega-3 PUFA market is poised for continued growth, driven by the increasing demand for health-promoting products, advancements in extraction and processing technologies, and the expansion into new applications and markets. Opportunities exist in developing innovative product formats, improving sustainability practices, and meeting the rising demand in developing economies. The market's growth trajectory is positive, and this report provides actionable insights for businesses to capitalize on the numerous opportunities ahead.
Omega 3 PUFA Industry Segmentation
-
1. Source
- 1.1. Plant
- 1.2. Marine
-
2. Type
- 2.1. Docosahexanoic acid (DHA)
- 2.2. Eicosapentanoic acid (EPA)
- 2.3. Alpha-Linolenic Acid (ALA)
- 2.4. Others
-
3. Concentration
- 3.1. High Concentrated
- 3.2. Medium Concentrated
- 3.3. Low Concentrated
-
4. Application
-
4.1. Food and Beverages
- 4.1.1. Functional Foods & Beverages
- 4.1.2. Infant Formula
- 4.2. Dietary Supplements
- 4.3. Pharmaceuticals
- 4.4. Animal Nutrition
-
4.1. Food and Beverages
Omega 3 PUFA Industry Segmentation By Geography
-
1. North America
- 1.1. United States
- 1.2. Canada
- 1.3. Mexico
- 1.4. Rest of North America
-
2. Europe
- 2.1. Spain
- 2.2. United Kingdom
- 2.3. Germany
- 2.4. France
- 2.5. Italy
- 2.6. Russia
- 2.7. Rest of Europe
-
3. Asia Pacific
- 3.1. China
- 3.2. Japan
- 3.3. India
- 3.4. Australia
- 3.5. Rest of Asia Pacific
-
4. South America
- 4.1. Brazil
- 4.2. Argentina
- 4.3. Rest of South America
-
5. Middle East and Africa
- 5.1. South Africa
- 5.2. Saudi Arabia
- 5.3. Rest of Middle East and Africa
Omega 3 PUFA Industry REPORT HIGHLIGHTS
| Aspects | Details |
|---|---|
| Study Period | 2019-2033 |
| Base Year | 2024 |
| Estimated Year | 2025 |
| Forecast Period | 2025-2033 |
| Historical Period | 2019-2024 |
| Growth Rate | CAGR of 8.20% from 2019-2033 |
| Segmentation |
|
Table of Contents
- 1. Introduction
- 1.1. Research Scope
- 1.2. Market Segmentation
- 1.3. Research Methodology
- 1.4. Definitions and Assumptions
- 2. Executive Summary
- 2.1. Introduction
- 3. Market Dynamics
- 3.1. Introduction
- 3.2. Market Drivers
- 3.2.1. Increasing Demand for Low-Fat and Low-Calorie Food; Increasing Product Innovation
- 3.3. Market Restrains
- 3.3.1. ; Threat of New Entrants; Bargaining Power of Buyers/Consumers; Bargaining Power of Suppliers; Threat of Substitute Products; Degree Of Competition
- 3.4. Market Trends
- 3.4.1. Increasing Demand for EPA Contained Food
- 4. Market Factor Analysis
- 4.1. Porters Five Forces
- 4.2. Supply/Value Chain
- 4.3. PESTEL analysis
- 4.4. Market Entropy
- 4.5. Patent/Trademark Analysis
- 5. Global Omega 3 PUFA Industry Analysis, Insights and Forecast, 2019-2031
- 5.1. Market Analysis, Insights and Forecast - by Source
- 5.1.1. Plant
- 5.1.2. Marine
- 5.2. Market Analysis, Insights and Forecast - by Type
- 5.2.1. Docosahexanoic acid (DHA)
- 5.2.2. Eicosapentanoic acid (EPA)
- 5.2.3. Alpha-Linolenic Acid (ALA)
- 5.2.4. Others
- 5.3. Market Analysis, Insights and Forecast - by Concentration
- 5.3.1. High Concentrated
- 5.3.2. Medium Concentrated
- 5.3.3. Low Concentrated
- 5.4. Market Analysis, Insights and Forecast - by Application
- 5.4.1. Food and Beverages
- 5.4.1.1. Functional Foods & Beverages
- 5.4.1.2. Infant Formula
- 5.4.2. Dietary Supplements
- 5.4.3. Pharmaceuticals
- 5.4.4. Animal Nutrition
- 5.4.1. Food and Beverages
- 5.5. Market Analysis, Insights and Forecast - by Region
- 5.5.1. North America
- 5.5.2. Europe
- 5.5.3. Asia Pacific
- 5.5.4. South America
- 5.5.5. Middle East and Africa
- 5.1. Market Analysis, Insights and Forecast - by Source
- 6. North America Omega 3 PUFA Industry Analysis, Insights and Forecast, 2019-2031
- 6.1. Market Analysis, Insights and Forecast - by Source
- 6.1.1. Plant
- 6.1.2. Marine
- 6.2. Market Analysis, Insights and Forecast - by Type
- 6.2.1. Docosahexanoic acid (DHA)
- 6.2.2. Eicosapentanoic acid (EPA)
- 6.2.3. Alpha-Linolenic Acid (ALA)
- 6.2.4. Others
- 6.3. Market Analysis, Insights and Forecast - by Concentration
- 6.3.1. High Concentrated
- 6.3.2. Medium Concentrated
- 6.3.3. Low Concentrated
- 6.4. Market Analysis, Insights and Forecast - by Application
- 6.4.1. Food and Beverages
- 6.4.1.1. Functional Foods & Beverages
- 6.4.1.2. Infant Formula
- 6.4.2. Dietary Supplements
- 6.4.3. Pharmaceuticals
- 6.4.4. Animal Nutrition
- 6.4.1. Food and Beverages
- 6.1. Market Analysis, Insights and Forecast - by Source
- 7. Europe Omega 3 PUFA Industry Analysis, Insights and Forecast, 2019-2031
- 7.1. Market Analysis, Insights and Forecast - by Source
- 7.1.1. Plant
- 7.1.2. Marine
- 7.2. Market Analysis, Insights and Forecast - by Type
- 7.2.1. Docosahexanoic acid (DHA)
- 7.2.2. Eicosapentanoic acid (EPA)
- 7.2.3. Alpha-Linolenic Acid (ALA)
- 7.2.4. Others
- 7.3. Market Analysis, Insights and Forecast - by Concentration
- 7.3.1. High Concentrated
- 7.3.2. Medium Concentrated
- 7.3.3. Low Concentrated
- 7.4. Market Analysis, Insights and Forecast - by Application
- 7.4.1. Food and Beverages
- 7.4.1.1. Functional Foods & Beverages
- 7.4.1.2. Infant Formula
- 7.4.2. Dietary Supplements
- 7.4.3. Pharmaceuticals
- 7.4.4. Animal Nutrition
- 7.4.1. Food and Beverages
- 7.1. Market Analysis, Insights and Forecast - by Source
- 8. Asia Pacific Omega 3 PUFA Industry Analysis, Insights and Forecast, 2019-2031
- 8.1. Market Analysis, Insights and Forecast - by Source
- 8.1.1. Plant
- 8.1.2. Marine
- 8.2. Market Analysis, Insights and Forecast - by Type
- 8.2.1. Docosahexanoic acid (DHA)
- 8.2.2. Eicosapentanoic acid (EPA)
- 8.2.3. Alpha-Linolenic Acid (ALA)
- 8.2.4. Others
- 8.3. Market Analysis, Insights and Forecast - by Concentration
- 8.3.1. High Concentrated
- 8.3.2. Medium Concentrated
- 8.3.3. Low Concentrated
- 8.4. Market Analysis, Insights and Forecast - by Application
- 8.4.1. Food and Beverages
- 8.4.1.1. Functional Foods & Beverages
- 8.4.1.2. Infant Formula
- 8.4.2. Dietary Supplements
- 8.4.3. Pharmaceuticals
- 8.4.4. Animal Nutrition
- 8.4.1. Food and Beverages
- 8.1. Market Analysis, Insights and Forecast - by Source
- 9. South America Omega 3 PUFA Industry Analysis, Insights and Forecast, 2019-2031
- 9.1. Market Analysis, Insights and Forecast - by Source
- 9.1.1. Plant
- 9.1.2. Marine
- 9.2. Market Analysis, Insights and Forecast - by Type
- 9.2.1. Docosahexanoic acid (DHA)
- 9.2.2. Eicosapentanoic acid (EPA)
- 9.2.3. Alpha-Linolenic Acid (ALA)
- 9.2.4. Others
- 9.3. Market Analysis, Insights and Forecast - by Concentration
- 9.3.1. High Concentrated
- 9.3.2. Medium Concentrated
- 9.3.3. Low Concentrated
- 9.4. Market Analysis, Insights and Forecast - by Application
- 9.4.1. Food and Beverages
- 9.4.1.1. Functional Foods & Beverages
- 9.4.1.2. Infant Formula
- 9.4.2. Dietary Supplements
- 9.4.3. Pharmaceuticals
- 9.4.4. Animal Nutrition
- 9.4.1. Food and Beverages
- 9.1. Market Analysis, Insights and Forecast - by Source
- 10. Middle East and Africa Omega 3 PUFA Industry Analysis, Insights and Forecast, 2019-2031
- 10.1. Market Analysis, Insights and Forecast - by Source
- 10.1.1. Plant
- 10.1.2. Marine
- 10.2. Market Analysis, Insights and Forecast - by Type
- 10.2.1. Docosahexanoic acid (DHA)
- 10.2.2. Eicosapentanoic acid (EPA)
- 10.2.3. Alpha-Linolenic Acid (ALA)
- 10.2.4. Others
- 10.3. Market Analysis, Insights and Forecast - by Concentration
- 10.3.1. High Concentrated
- 10.3.2. Medium Concentrated
- 10.3.3. Low Concentrated
- 10.4. Market Analysis, Insights and Forecast - by Application
- 10.4.1. Food and Beverages
- 10.4.1.1. Functional Foods & Beverages
- 10.4.1.2. Infant Formula
- 10.4.2. Dietary Supplements
- 10.4.3. Pharmaceuticals
- 10.4.4. Animal Nutrition
- 10.4.1. Food and Beverages
- 10.1. Market Analysis, Insights and Forecast - by Source
- 11. North America Omega 3 PUFA Industry Analysis, Insights and Forecast, 2019-2031
- 11.1. Market Analysis, Insights and Forecast - By Country/Sub-region
- 11.1.1 United States
- 11.1.2 Canada
- 11.1.3 Mexico
- 11.1.4 Rest of North America
- 12. Europe Omega 3 PUFA Industry Analysis, Insights and Forecast, 2019-2031
- 12.1. Market Analysis, Insights and Forecast - By Country/Sub-region
- 12.1.1 Spain
- 12.1.2 United Kingdom
- 12.1.3 Germany
- 12.1.4 France
- 12.1.5 Italy
- 12.1.6 Russia
- 12.1.7 Rest of Europe
- 13. Asia Pacific Omega 3 PUFA Industry Analysis, Insights and Forecast, 2019-2031
- 13.1. Market Analysis, Insights and Forecast - By Country/Sub-region
- 13.1.1 China
- 13.1.2 Japan
- 13.1.3 India
- 13.1.4 Australia
- 13.1.5 Rest of Asia Pacific
- 14. South America Omega 3 PUFA Industry Analysis, Insights and Forecast, 2019-2031
- 14.1. Market Analysis, Insights and Forecast - By Country/Sub-region
- 14.1.1 Brazil
- 14.1.2 Argentina
- 14.1.3 Rest of South America
- 15. Middle East and Africa Omega 3 PUFA Industry Analysis, Insights and Forecast, 2019-2031
- 15.1. Market Analysis, Insights and Forecast - By Country/Sub-region
- 15.1.1 South Africa
- 15.1.2 Saudi Arabia
- 15.1.3 Rest of Middle East and Africa
- 16. Competitive Analysis
- 16.1. Global Market Share Analysis 2024
- 16.2. Company Profiles
- 16.2.1 Cargill Incorporated
- 16.2.1.1. Overview
- 16.2.1.2. Products
- 16.2.1.3. SWOT Analysis
- 16.2.1.4. Recent Developments
- 16.2.1.5. Financials (Based on Availability)
- 16.2.2 Pharma Marine
- 16.2.2.1. Overview
- 16.2.2.2. Products
- 16.2.2.3. SWOT Analysis
- 16.2.2.4. Recent Developments
- 16.2.2.5. Financials (Based on Availability)
- 16.2.3 Novotech Nutraceuticals Inc
- 16.2.3.1. Overview
- 16.2.3.2. Products
- 16.2.3.3. SWOT Analysis
- 16.2.3.4. Recent Developments
- 16.2.3.5. Financials (Based on Availability)
- 16.2.4 Archer Daniels Midland Company
- 16.2.4.1. Overview
- 16.2.4.2. Products
- 16.2.4.3. SWOT Analysis
- 16.2.4.4. Recent Developments
- 16.2.4.5. Financials (Based on Availability)
- 16.2.5 Croda International Plc
- 16.2.5.1. Overview
- 16.2.5.2. Products
- 16.2.5.3. SWOT Analysis
- 16.2.5.4. Recent Developments
- 16.2.5.5. Financials (Based on Availability)
- 16.2.6 BASF SE
- 16.2.6.1. Overview
- 16.2.6.2. Products
- 16.2.6.3. SWOT Analysis
- 16.2.6.4. Recent Developments
- 16.2.6.5. Financials (Based on Availability)
- 16.2.7 Stepan company
- 16.2.7.1. Overview
- 16.2.7.2. Products
- 16.2.7.3. SWOT Analysis
- 16.2.7.4. Recent Developments
- 16.2.7.5. Financials (Based on Availability)
- 16.2.8 Omega Protein Corporation
- 16.2.8.1. Overview
- 16.2.8.2. Products
- 16.2.8.3. SWOT Analysis
- 16.2.8.4. Recent Developments
- 16.2.8.5. Financials (Based on Availability)
- 16.2.9 Corbion NV
- 16.2.9.1. Overview
- 16.2.9.2. Products
- 16.2.9.3. SWOT Analysis
- 16.2.9.4. Recent Developments
- 16.2.9.5. Financials (Based on Availability)
- 16.2.10 Clover Corporation Ltd*List Not Exhaustive
- 16.2.10.1. Overview
- 16.2.10.2. Products
- 16.2.10.3. SWOT Analysis
- 16.2.10.4. Recent Developments
- 16.2.10.5. Financials (Based on Availability)
- 16.2.1 Cargill Incorporated
List of Figures
- Figure 1: Global Omega 3 PUFA Industry Revenue Breakdown (Million, %) by Region 2024 & 2032
- Figure 2: North America Omega 3 PUFA Industry Revenue (Million), by Country 2024 & 2032
- Figure 3: North America Omega 3 PUFA Industry Revenue Share (%), by Country 2024 & 2032
- Figure 4: Europe Omega 3 PUFA Industry Revenue (Million), by Country 2024 & 2032
- Figure 5: Europe Omega 3 PUFA Industry Revenue Share (%), by Country 2024 & 2032
- Figure 6: Asia Pacific Omega 3 PUFA Industry Revenue (Million), by Country 2024 & 2032
- Figure 7: Asia Pacific Omega 3 PUFA Industry Revenue Share (%), by Country 2024 & 2032
- Figure 8: South America Omega 3 PUFA Industry Revenue (Million), by Country 2024 & 2032
- Figure 9: South America Omega 3 PUFA Industry Revenue Share (%), by Country 2024 & 2032
- Figure 10: Middle East and Africa Omega 3 PUFA Industry Revenue (Million), by Country 2024 & 2032
- Figure 11: Middle East and Africa Omega 3 PUFA Industry Revenue Share (%), by Country 2024 & 2032
- Figure 12: North America Omega 3 PUFA Industry Revenue (Million), by Source 2024 & 2032
- Figure 13: North America Omega 3 PUFA Industry Revenue Share (%), by Source 2024 & 2032
- Figure 14: North America Omega 3 PUFA Industry Revenue (Million), by Type 2024 & 2032
- Figure 15: North America Omega 3 PUFA Industry Revenue Share (%), by Type 2024 & 2032
- Figure 16: North America Omega 3 PUFA Industry Revenue (Million), by Concentration 2024 & 2032
- Figure 17: North America Omega 3 PUFA Industry Revenue Share (%), by Concentration 2024 & 2032
- Figure 18: North America Omega 3 PUFA Industry Revenue (Million), by Application 2024 & 2032
- Figure 19: North America Omega 3 PUFA Industry Revenue Share (%), by Application 2024 & 2032
- Figure 20: North America Omega 3 PUFA Industry Revenue (Million), by Country 2024 & 2032
- Figure 21: North America Omega 3 PUFA Industry Revenue Share (%), by Country 2024 & 2032
- Figure 22: Europe Omega 3 PUFA Industry Revenue (Million), by Source 2024 & 2032
- Figure 23: Europe Omega 3 PUFA Industry Revenue Share (%), by Source 2024 & 2032
- Figure 24: Europe Omega 3 PUFA Industry Revenue (Million), by Type 2024 & 2032
- Figure 25: Europe Omega 3 PUFA Industry Revenue Share (%), by Type 2024 & 2032
- Figure 26: Europe Omega 3 PUFA Industry Revenue (Million), by Concentration 2024 & 2032
- Figure 27: Europe Omega 3 PUFA Industry Revenue Share (%), by Concentration 2024 & 2032
- Figure 28: Europe Omega 3 PUFA Industry Revenue (Million), by Application 2024 & 2032
- Figure 29: Europe Omega 3 PUFA Industry Revenue Share (%), by Application 2024 & 2032
- Figure 30: Europe Omega 3 PUFA Industry Revenue (Million), by Country 2024 & 2032
- Figure 31: Europe Omega 3 PUFA Industry Revenue Share (%), by Country 2024 & 2032
- Figure 32: Asia Pacific Omega 3 PUFA Industry Revenue (Million), by Source 2024 & 2032
- Figure 33: Asia Pacific Omega 3 PUFA Industry Revenue Share (%), by Source 2024 & 2032
- Figure 34: Asia Pacific Omega 3 PUFA Industry Revenue (Million), by Type 2024 & 2032
- Figure 35: Asia Pacific Omega 3 PUFA Industry Revenue Share (%), by Type 2024 & 2032
- Figure 36: Asia Pacific Omega 3 PUFA Industry Revenue (Million), by Concentration 2024 & 2032
- Figure 37: Asia Pacific Omega 3 PUFA Industry Revenue Share (%), by Concentration 2024 & 2032
- Figure 38: Asia Pacific Omega 3 PUFA Industry Revenue (Million), by Application 2024 & 2032
- Figure 39: Asia Pacific Omega 3 PUFA Industry Revenue Share (%), by Application 2024 & 2032
- Figure 40: Asia Pacific Omega 3 PUFA Industry Revenue (Million), by Country 2024 & 2032
- Figure 41: Asia Pacific Omega 3 PUFA Industry Revenue Share (%), by Country 2024 & 2032
- Figure 42: South America Omega 3 PUFA Industry Revenue (Million), by Source 2024 & 2032
- Figure 43: South America Omega 3 PUFA Industry Revenue Share (%), by Source 2024 & 2032
- Figure 44: South America Omega 3 PUFA Industry Revenue (Million), by Type 2024 & 2032
- Figure 45: South America Omega 3 PUFA Industry Revenue Share (%), by Type 2024 & 2032
- Figure 46: South America Omega 3 PUFA Industry Revenue (Million), by Concentration 2024 & 2032
- Figure 47: South America Omega 3 PUFA Industry Revenue Share (%), by Concentration 2024 & 2032
- Figure 48: South America Omega 3 PUFA Industry Revenue (Million), by Application 2024 & 2032
- Figure 49: South America Omega 3 PUFA Industry Revenue Share (%), by Application 2024 & 2032
- Figure 50: South America Omega 3 PUFA Industry Revenue (Million), by Country 2024 & 2032
- Figure 51: South America Omega 3 PUFA Industry Revenue Share (%), by Country 2024 & 2032
- Figure 52: Middle East and Africa Omega 3 PUFA Industry Revenue (Million), by Source 2024 & 2032
- Figure 53: Middle East and Africa Omega 3 PUFA Industry Revenue Share (%), by Source 2024 & 2032
- Figure 54: Middle East and Africa Omega 3 PUFA Industry Revenue (Million), by Type 2024 & 2032
- Figure 55: Middle East and Africa Omega 3 PUFA Industry Revenue Share (%), by Type 2024 & 2032
- Figure 56: Middle East and Africa Omega 3 PUFA Industry Revenue (Million), by Concentration 2024 & 2032
- Figure 57: Middle East and Africa Omega 3 PUFA Industry Revenue Share (%), by Concentration 2024 & 2032
- Figure 58: Middle East and Africa Omega 3 PUFA Industry Revenue (Million), by Application 2024 & 2032
- Figure 59: Middle East and Africa Omega 3 PUFA Industry Revenue Share (%), by Application 2024 & 2032
- Figure 60: Middle East and Africa Omega 3 PUFA Industry Revenue (Million), by Country 2024 & 2032
- Figure 61: Middle East and Africa Omega 3 PUFA Industry Revenue Share (%), by Country 2024 & 2032
List of Tables
- Table 1: Global Omega 3 PUFA Industry Revenue Million Forecast, by Region 2019 & 2032
- Table 2: Global Omega 3 PUFA Industry Revenue Million Forecast, by Source 2019 & 2032
- Table 3: Global Omega 3 PUFA Industry Revenue Million Forecast, by Type 2019 & 2032
- Table 4: Global Omega 3 PUFA Industry Revenue Million Forecast, by Concentration 2019 & 2032
- Table 5: Global Omega 3 PUFA Industry Revenue Million Forecast, by Application 2019 & 2032
- Table 6: Global Omega 3 PUFA Industry Revenue Million Forecast, by Region 2019 & 2032
- Table 7: Global Omega 3 PUFA Industry Revenue Million Forecast, by Country 2019 & 2032
- Table 8: United States Omega 3 PUFA Industry Revenue (Million) Forecast, by Application 2019 & 2032
- Table 9: Canada Omega 3 PUFA Industry Revenue (Million) Forecast, by Application 2019 & 2032
- Table 10: Mexico Omega 3 PUFA Industry Revenue (Million) Forecast, by Application 2019 & 2032
- Table 11: Rest of North America Omega 3 PUFA Industry Revenue (Million) Forecast, by Application 2019 & 2032
- Table 12: Global Omega 3 PUFA Industry Revenue Million Forecast, by Country 2019 & 2032
- Table 13: Spain Omega 3 PUFA Industry Revenue (Million) Forecast, by Application 2019 & 2032
- Table 14: United Kingdom Omega 3 PUFA Industry Revenue (Million) Forecast, by Application 2019 & 2032
- Table 15: Germany Omega 3 PUFA Industry Revenue (Million) Forecast, by Application 2019 & 2032
- Table 16: France Omega 3 PUFA Industry Revenue (Million) Forecast, by Application 2019 & 2032
- Table 17: Italy Omega 3 PUFA Industry Revenue (Million) Forecast, by Application 2019 & 2032
- Table 18: Russia Omega 3 PUFA Industry Revenue (Million) Forecast, by Application 2019 & 2032
- Table 19: Rest of Europe Omega 3 PUFA Industry Revenue (Million) Forecast, by Application 2019 & 2032
- Table 20: Global Omega 3 PUFA Industry Revenue Million Forecast, by Country 2019 & 2032
- Table 21: China Omega 3 PUFA Industry Revenue (Million) Forecast, by Application 2019 & 2032
- Table 22: Japan Omega 3 PUFA Industry Revenue (Million) Forecast, by Application 2019 & 2032
- Table 23: India Omega 3 PUFA Industry Revenue (Million) Forecast, by Application 2019 & 2032
- Table 24: Australia Omega 3 PUFA Industry Revenue (Million) Forecast, by Application 2019 & 2032
- Table 25: Rest of Asia Pacific Omega 3 PUFA Industry Revenue (Million) Forecast, by Application 2019 & 2032
- Table 26: Global Omega 3 PUFA Industry Revenue Million Forecast, by Country 2019 & 2032
- Table 27: Brazil Omega 3 PUFA Industry Revenue (Million) Forecast, by Application 2019 & 2032
- Table 28: Argentina Omega 3 PUFA Industry Revenue (Million) Forecast, by Application 2019 & 2032
- Table 29: Rest of South America Omega 3 PUFA Industry Revenue (Million) Forecast, by Application 2019 & 2032
- Table 30: Global Omega 3 PUFA Industry Revenue Million Forecast, by Country 2019 & 2032
- Table 31: South Africa Omega 3 PUFA Industry Revenue (Million) Forecast, by Application 2019 & 2032
- Table 32: Saudi Arabia Omega 3 PUFA Industry Revenue (Million) Forecast, by Application 2019 & 2032
- Table 33: Rest of Middle East and Africa Omega 3 PUFA Industry Revenue (Million) Forecast, by Application 2019 & 2032
- Table 34: Global Omega 3 PUFA Industry Revenue Million Forecast, by Source 2019 & 2032
- Table 35: Global Omega 3 PUFA Industry Revenue Million Forecast, by Type 2019 & 2032
- Table 36: Global Omega 3 PUFA Industry Revenue Million Forecast, by Concentration 2019 & 2032
- Table 37: Global Omega 3 PUFA Industry Revenue Million Forecast, by Application 2019 & 2032
- Table 38: Global Omega 3 PUFA Industry Revenue Million Forecast, by Country 2019 & 2032
- Table 39: United States Omega 3 PUFA Industry Revenue (Million) Forecast, by Application 2019 & 2032
- Table 40: Canada Omega 3 PUFA Industry Revenue (Million) Forecast, by Application 2019 & 2032
- Table 41: Mexico Omega 3 PUFA Industry Revenue (Million) Forecast, by Application 2019 & 2032
- Table 42: Rest of North America Omega 3 PUFA Industry Revenue (Million) Forecast, by Application 2019 & 2032
- Table 43: Global Omega 3 PUFA Industry Revenue Million Forecast, by Source 2019 & 2032
- Table 44: Global Omega 3 PUFA Industry Revenue Million Forecast, by Type 2019 & 2032
- Table 45: Global Omega 3 PUFA Industry Revenue Million Forecast, by Concentration 2019 & 2032
- Table 46: Global Omega 3 PUFA Industry Revenue Million Forecast, by Application 2019 & 2032
- Table 47: Global Omega 3 PUFA Industry Revenue Million Forecast, by Country 2019 & 2032
- Table 48: Spain Omega 3 PUFA Industry Revenue (Million) Forecast, by Application 2019 & 2032
- Table 49: United Kingdom Omega 3 PUFA Industry Revenue (Million) Forecast, by Application 2019 & 2032
- Table 50: Germany Omega 3 PUFA Industry Revenue (Million) Forecast, by Application 2019 & 2032
- Table 51: France Omega 3 PUFA Industry Revenue (Million) Forecast, by Application 2019 & 2032
- Table 52: Italy Omega 3 PUFA Industry Revenue (Million) Forecast, by Application 2019 & 2032
- Table 53: Russia Omega 3 PUFA Industry Revenue (Million) Forecast, by Application 2019 & 2032
- Table 54: Rest of Europe Omega 3 PUFA Industry Revenue (Million) Forecast, by Application 2019 & 2032
- Table 55: Global Omega 3 PUFA Industry Revenue Million Forecast, by Source 2019 & 2032
- Table 56: Global Omega 3 PUFA Industry Revenue Million Forecast, by Type 2019 & 2032
- Table 57: Global Omega 3 PUFA Industry Revenue Million Forecast, by Concentration 2019 & 2032
- Table 58: Global Omega 3 PUFA Industry Revenue Million Forecast, by Application 2019 & 2032
- Table 59: Global Omega 3 PUFA Industry Revenue Million Forecast, by Country 2019 & 2032
- Table 60: China Omega 3 PUFA Industry Revenue (Million) Forecast, by Application 2019 & 2032
- Table 61: Japan Omega 3 PUFA Industry Revenue (Million) Forecast, by Application 2019 & 2032
- Table 62: India Omega 3 PUFA Industry Revenue (Million) Forecast, by Application 2019 & 2032
- Table 63: Australia Omega 3 PUFA Industry Revenue (Million) Forecast, by Application 2019 & 2032
- Table 64: Rest of Asia Pacific Omega 3 PUFA Industry Revenue (Million) Forecast, by Application 2019 & 2032
- Table 65: Global Omega 3 PUFA Industry Revenue Million Forecast, by Source 2019 & 2032
- Table 66: Global Omega 3 PUFA Industry Revenue Million Forecast, by Type 2019 & 2032
- Table 67: Global Omega 3 PUFA Industry Revenue Million Forecast, by Concentration 2019 & 2032
- Table 68: Global Omega 3 PUFA Industry Revenue Million Forecast, by Application 2019 & 2032
- Table 69: Global Omega 3 PUFA Industry Revenue Million Forecast, by Country 2019 & 2032
- Table 70: Brazil Omega 3 PUFA Industry Revenue (Million) Forecast, by Application 2019 & 2032
- Table 71: Argentina Omega 3 PUFA Industry Revenue (Million) Forecast, by Application 2019 & 2032
- Table 72: Rest of South America Omega 3 PUFA Industry Revenue (Million) Forecast, by Application 2019 & 2032
- Table 73: Global Omega 3 PUFA Industry Revenue Million Forecast, by Source 2019 & 2032
- Table 74: Global Omega 3 PUFA Industry Revenue Million Forecast, by Type 2019 & 2032
- Table 75: Global Omega 3 PUFA Industry Revenue Million Forecast, by Concentration 2019 & 2032
- Table 76: Global Omega 3 PUFA Industry Revenue Million Forecast, by Application 2019 & 2032
- Table 77: Global Omega 3 PUFA Industry Revenue Million Forecast, by Country 2019 & 2032
- Table 78: South Africa Omega 3 PUFA Industry Revenue (Million) Forecast, by Application 2019 & 2032
- Table 79: Saudi Arabia Omega 3 PUFA Industry Revenue (Million) Forecast, by Application 2019 & 2032
- Table 80: Rest of Middle East and Africa Omega 3 PUFA Industry Revenue (Million) Forecast, by Application 2019 & 2032
Frequently Asked Questions
1. What is the projected Compound Annual Growth Rate (CAGR) of the Omega 3 PUFA Industry?
The projected CAGR is approximately 8.20%.
2. Which companies are prominent players in the Omega 3 PUFA Industry?
Key companies in the market include Cargill Incorporated, Pharma Marine, Novotech Nutraceuticals Inc, Archer Daniels Midland Company, Croda International Plc, BASF SE, Stepan company, Omega Protein Corporation, Corbion NV, Clover Corporation Ltd*List Not Exhaustive.
3. What are the main segments of the Omega 3 PUFA Industry?
The market segments include Source, Type, Concentration, Application.
4. Can you provide details about the market size?
The market size is estimated to be USD XX Million as of 2022.
5. What are some drivers contributing to market growth?
Increasing Demand for Low-Fat and Low-Calorie Food; Increasing Product Innovation.
6. What are the notable trends driving market growth?
Increasing Demand for EPA Contained Food.
7. Are there any restraints impacting market growth?
; Threat of New Entrants; Bargaining Power of Buyers/Consumers; Bargaining Power of Suppliers; Threat of Substitute Products; Degree Of Competition.
8. Can you provide examples of recent developments in the market?
In 2021, Cargill, Incorporated has acquired Croda's Biobased industrial business. The key strategy behind the acquisition of Croda's technologies and chemical business will be useful in developing new products which will be beneficial in meeting the varying requirements of the consumers around the globe, as using different technologies the company can offer numerous innovative omega-3 PUFA supplements to the consumer and also it will play a major role in business expansion.
9. What pricing options are available for accessing the report?
Pricing options include single-user, multi-user, and enterprise licenses priced at USD 4750, USD 5250, and USD 8750 respectively.
10. Is the market size provided in terms of value or volume?
The market size is provided in terms of value, measured in Million.
11. Are there any specific market keywords associated with the report?
Yes, the market keyword associated with the report is "Omega 3 PUFA Industry," which aids in identifying and referencing the specific market segment covered.
12. How do I determine which pricing option suits my needs best?
The pricing options vary based on user requirements and access needs. Individual users may opt for single-user licenses, while businesses requiring broader access may choose multi-user or enterprise licenses for cost-effective access to the report.
13. Are there any additional resources or data provided in the Omega 3 PUFA Industry report?
While the report offers comprehensive insights, it's advisable to review the specific contents or supplementary materials provided to ascertain if additional resources or data are available.
14. How can I stay updated on further developments or reports in the Omega 3 PUFA Industry?
To stay informed about further developments, trends, and reports in the Omega 3 PUFA Industry, consider subscribing to industry newsletters, following relevant companies and organizations, or regularly checking reputable industry news sources and publications.
Methodology
Step 1 - Identification of Relevant Samples Size from Population Database


Step 2 - Approaches for Defining Global Market Size (Value, Volume* & Price*)

Note*: In applicable scenarios
Step 3 - Data Sources
Primary Research
- Web Analytics
- Survey Reports
- Research Institute
- Latest Research Reports
- Opinion Leaders
Secondary Research
- Annual Reports
- White Paper
- Latest Press Release
- Industry Association
- Paid Database
- Investor Presentations

Step 4 - Data Triangulation
Involves using different sources of information in order to increase the validity of a study
These sources are likely to be stakeholders in a program - participants, other researchers, program staff, other community members, and so on.
Then we put all data in single framework & apply various statistical tools to find out the dynamic on the market.
During the analysis stage, feedback from the stakeholder groups would be compared to determine areas of agreement as well as areas of divergence
