

Key Insights
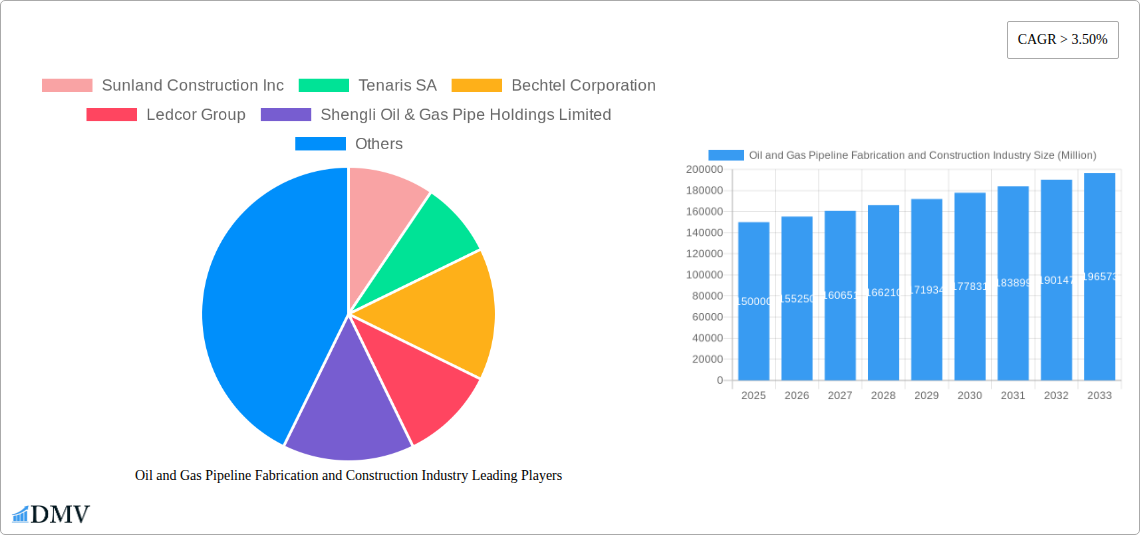
The Oil and Gas Pipeline Fabrication and Construction industry is experiencing robust growth, driven by increasing global energy demand and the ongoing need for efficient energy transportation infrastructure. A CAGR exceeding 3.5% suggests a consistently expanding market, projected to reach significant value over the forecast period (2025-2033). Key drivers include burgeoning investments in renewable energy sources (requiring new pipelines for hydrogen and carbon capture), government initiatives promoting energy security and infrastructure development, and the continued reliance on fossil fuels in many regions. Trends shaping the industry include the adoption of advanced technologies such as automation, robotics, and digital twins for improved efficiency and safety in pipeline construction and maintenance. Furthermore, a growing focus on sustainable practices and environmentally friendly construction methods is influencing project selection and execution. While challenges exist, such as fluctuating oil and gas prices, geopolitical instability, and stringent environmental regulations, the long-term outlook remains positive. The industry's segmentation by application (Oil and Gas) highlights the crucial role of pipelines in both sectors. Major players, including Sunland Construction Inc., Tenaris SA, and Bechtel Corporation, are leveraging their expertise and experience to meet the growing demand, often collaborating on large-scale projects. Regional variations in market share are likely influenced by factors such as existing infrastructure, regulatory frameworks, and the level of investment in energy projects. North America and Asia-Pacific are expected to dominate the market, driven by significant energy production and consumption in these regions.
The considerable investments in pipeline infrastructure across various regions are a major factor in market growth. Stringent safety regulations and a focus on minimizing environmental impact are shaping industry practices. The successful integration of innovative technologies promises to improve efficiency, reduce costs, and enhance the overall safety of pipeline fabrication and construction. The long-term prospects are promising, but companies need to adapt to changing market dynamics and regulatory requirements to maintain a competitive edge. This includes fostering partnerships, adopting advanced technologies, and prioritizing sustainability initiatives. Understanding regional variations in growth trajectory will be crucial for targeted investments and strategic business planning. The industry is expected to witness ongoing consolidation, with larger firms potentially acquiring smaller companies to expand their geographical reach and service portfolio.
Oil and Gas Pipeline Fabrication and Construction Industry: A Comprehensive Market Report (2019-2033)
This insightful report provides a comprehensive analysis of the Oil and Gas Pipeline Fabrication and Construction industry, offering a detailed forecast from 2025 to 2033. With a meticulous study period covering 2019-2024 (historical period) and a base year of 2025, this report is invaluable for stakeholders seeking to understand market trends, competitive landscapes, and future growth opportunities. The global market size is estimated at $XX Million in 2025, poised for significant expansion in the coming years.
Oil and Gas Pipeline Fabrication and Construction Industry Market Composition & Trends
This section delves into the intricate dynamics of the Oil and Gas Pipeline Fabrication and Construction market, examining key aspects that shape its trajectory. We analyze market concentration, revealing the market share distribution among leading players such as Sunland Construction Inc, Tenaris SA, Bechtel Corporation, Ledcor Group, Shengli Oil & Gas Pipe Holdings Limited, Barnard Construction Company Inc, Snelson Companies Inc, Larsen & Toubro Limited, Gateway Pipeline LLC, and Pumpco Inc. The report further investigates the impact of innovation catalysts, including advancements in materials science and construction techniques, on market growth. Regulatory landscapes across different regions, the influence of substitute products, and detailed end-user profiles are also examined. Finally, we analyze M&A activities within the industry, providing insights into deal values (totalling $XX Million in the period 2019-2024) and their implications for market consolidation.
- Market Share Distribution: Sunland Construction Inc holds an estimated XX% market share, followed by Tenaris SA at XX%, and Bechtel Corporation at XX%. (Detailed breakdown provided in the full report)
- M&A Activity: The period 2019-2024 witnessed $XX Million in M&A deals, primarily driven by consolidation efforts and expansion strategies among major players. (Specific deals detailed in the full report)
- Innovation Catalysts: Advancements in robotic welding and automated pipeline inspection systems are reshaping industry practices.
- Regulatory Landscape: Stringent environmental regulations and safety standards significantly impact operational costs and project timelines.
Oil and Gas Pipeline Fabrication and Construction Industry Industry Evolution
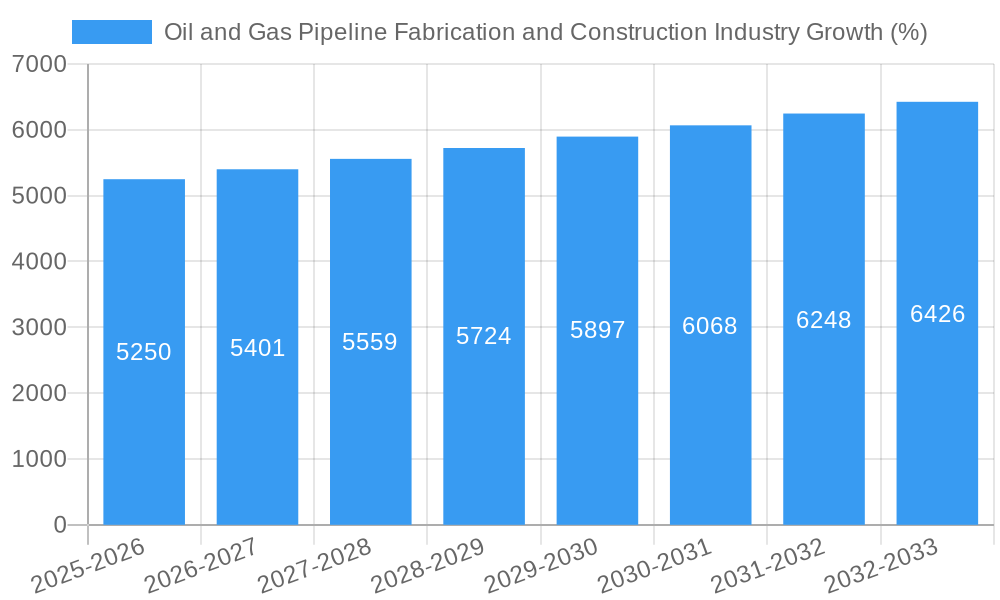
This section provides a detailed analysis of the market's evolutionary path from 2019 to 2033. We explore market growth trajectories, revealing a CAGR of XX% during the historical period (2019-2024) and projecting a CAGR of XX% during the forecast period (2025-2033). Technological advancements, such as the increased adoption of advanced materials (XX% adoption rate in 2024, projected to reach XX% by 2033) and digitalization initiatives, are driving efficiency and reducing operational costs. Shifting consumer demands, particularly towards sustainable and environmentally friendly practices, are shaping industry strategies and investment decisions. The report delves into these trends, providing granular data points to paint a complete picture of industry evolution.
Leading Regions, Countries, or Segments in Oil and Gas Pipeline Fabrication and Construction Industry
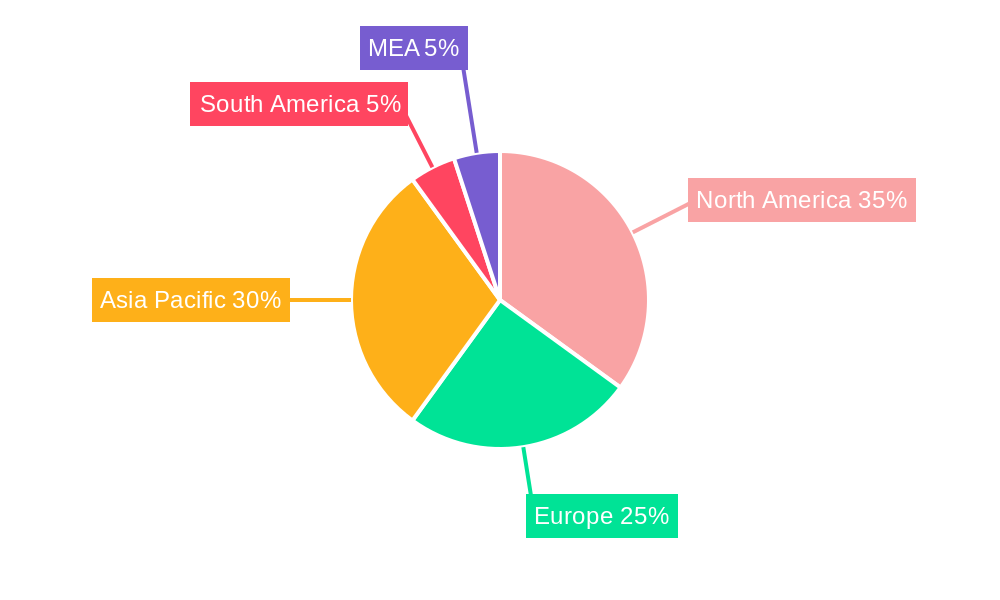
North America currently dominates the Oil and Gas Pipeline Fabrication and Construction market, driven by significant investments in oil and gas infrastructure projects.
- Key Drivers in North America:
- Robust investment in pipeline expansion and modernization projects.
- Favorable regulatory environment supporting energy infrastructure development.
- High demand for oil and gas transportation solutions.
The dominance of North America is further analyzed, exploring the contributing factors like government policies, investment climate, and technological advancements. While other regions like Asia-Pacific show promising growth potential, North America's established infrastructure and sustained investment make it the leading region in the forecast period. A detailed regional and segment-wise analysis (by application: Oil and Gas) is presented, highlighting market size, growth drivers, and future projections.
Oil and Gas Pipeline Fabrication and Construction Industry Product Innovations
Recent innovations have focused on enhancing pipeline durability, safety, and efficiency. This includes the development of advanced coating materials that offer superior corrosion resistance and the integration of smart sensors for real-time monitoring and leak detection. These innovations contribute to reduced maintenance costs, improved safety protocols, and extended pipeline lifespans. Furthermore, the adoption of modular construction techniques is accelerating project completion times and minimizing on-site risks.
Propelling Factors for Oil and Gas Pipeline Fabrication and Construction Industry Growth
The industry’s growth is fueled by several key factors. Increased global energy demand drives the need for efficient oil and gas transportation networks. Government initiatives promoting energy infrastructure development and investment in pipeline projects further stimulate market expansion. Technological advancements, such as the use of robotics and advanced materials, enhance efficiency and reduce project costs.
Obstacles in the Oil and Gas Pipeline Fabrication and Construction Industry Market
Significant challenges hamper industry growth. Stringent environmental regulations and obtaining necessary permits can lead to project delays and increased costs. Supply chain disruptions, especially regarding specialized materials and skilled labor, impact project timelines and profitability. Intense competition among established players and the emergence of new entrants create pressure on pricing and margins. These challenges collectively affect the overall market dynamics.
Future Opportunities in Oil and Gas Pipeline Fabrication and Construction Industry
Emerging opportunities abound, especially in the development of carbon capture and storage (CCS) pipelines and the expansion into renewable energy infrastructure projects. Advancements in materials science and digital technologies present possibilities for enhanced pipeline efficiency and longevity. Furthermore, exploring new markets in developing economies with growing energy demands offers significant growth potential.
Major Players in the Oil and Gas Pipeline Fabrication and Construction Industry Ecosystem
- Sunland Construction Inc
- Tenaris SA
- Bechtel Corporation
- Ledcor Group
- Shengli Oil & Gas Pipe Holdings Limited
- Barnard Construction Company Inc
- Snelson Companies Inc
- Larsen & Toubro Limited
- Gateway Pipeline LLC
- Pumpco Inc
Key Developments in Oil and Gas Pipeline Fabrication and Construction Industry Industry
- 2022 Q4: Bechtel Corporation announces a major pipeline expansion project in North America.
- 2023 Q1: Tenaris SA unveils a new generation of corrosion-resistant pipeline coating.
- 2024 Q2: A significant merger between two mid-sized pipeline construction firms is completed. (Further details in the full report).
Strategic Oil and Gas Pipeline Fabrication and Construction Industry Market Forecast
The Oil and Gas Pipeline Fabrication and Construction market is poised for substantial growth driven by increasing global energy demand, government investments in energy infrastructure, and ongoing technological advancements. The market's future hinges on successful navigation of regulatory hurdles, efficient supply chain management, and the adoption of sustainable practices. The projected CAGR of XX% in the forecast period indicates significant market expansion and lucrative opportunities for industry players.
Oil and Gas Pipeline Fabrication and Construction Industry Segmentation
-
1. Application
- 1.1. Oil
- 1.2. Gas
Oil and Gas Pipeline Fabrication and Construction Industry Segmentation By Geography
- 1. North America
- 2. Europe
- 3. Asia Pacific
- 4. South America
- 5. Middle East and Africa
Oil and Gas Pipeline Fabrication and Construction Industry REPORT HIGHLIGHTS
| Aspects | Details |
|---|---|
| Study Period | 2019-2033 |
| Base Year | 2024 |
| Estimated Year | 2025 |
| Forecast Period | 2025-2033 |
| Historical Period | 2019-2024 |
| Growth Rate | CAGR of > 3.50% from 2019-2033 |
| Segmentation |
|
Table of Contents
- 1. Introduction
- 1.1. Research Scope
- 1.2. Market Segmentation
- 1.3. Research Methodology
- 1.4. Definitions and Assumptions
- 2. Executive Summary
- 2.1. Introduction
- 3. Market Dynamics
- 3.1. Introduction
- 3.2. Market Drivers
- 3.2.1 4.; Increasing Investment in LNG Infrastructure4.; Rising Demand for LNG in Bunkering
- 3.2.2 Road Transportation
- 3.2.3 and Off-grid Power
- 3.3. Market Restrains
- 3.3.1. 4.; Lack of Supporting Infrastructure in the Regions such as the Middle East and Africa
- 3.4. Market Trends
- 3.4.1. Gas Segment to Record Significant Growth
- 4. Market Factor Analysis
- 4.1. Porters Five Forces
- 4.2. Supply/Value Chain
- 4.3. PESTEL analysis
- 4.4. Market Entropy
- 4.5. Patent/Trademark Analysis
- 5. Global Oil and Gas Pipeline Fabrication and Construction Industry Analysis, Insights and Forecast, 2019-2031
- 5.1. Market Analysis, Insights and Forecast - by Application
- 5.1.1. Oil
- 5.1.2. Gas
- 5.2. Market Analysis, Insights and Forecast - by Region
- 5.2.1. North America
- 5.2.2. Europe
- 5.2.3. Asia Pacific
- 5.2.4. South America
- 5.2.5. Middle East and Africa
- 5.1. Market Analysis, Insights and Forecast - by Application
- 6. North America Oil and Gas Pipeline Fabrication and Construction Industry Analysis, Insights and Forecast, 2019-2031
- 6.1. Market Analysis, Insights and Forecast - by Application
- 6.1.1. Oil
- 6.1.2. Gas
- 6.1. Market Analysis, Insights and Forecast - by Application
- 7. Europe Oil and Gas Pipeline Fabrication and Construction Industry Analysis, Insights and Forecast, 2019-2031
- 7.1. Market Analysis, Insights and Forecast - by Application
- 7.1.1. Oil
- 7.1.2. Gas
- 7.1. Market Analysis, Insights and Forecast - by Application
- 8. Asia Pacific Oil and Gas Pipeline Fabrication and Construction Industry Analysis, Insights and Forecast, 2019-2031
- 8.1. Market Analysis, Insights and Forecast - by Application
- 8.1.1. Oil
- 8.1.2. Gas
- 8.1. Market Analysis, Insights and Forecast - by Application
- 9. South America Oil and Gas Pipeline Fabrication and Construction Industry Analysis, Insights and Forecast, 2019-2031
- 9.1. Market Analysis, Insights and Forecast - by Application
- 9.1.1. Oil
- 9.1.2. Gas
- 9.1. Market Analysis, Insights and Forecast - by Application
- 10. Middle East and Africa Oil and Gas Pipeline Fabrication and Construction Industry Analysis, Insights and Forecast, 2019-2031
- 10.1. Market Analysis, Insights and Forecast - by Application
- 10.1.1. Oil
- 10.1.2. Gas
- 10.1. Market Analysis, Insights and Forecast - by Application
- 11. North America Oil and Gas Pipeline Fabrication and Construction Industry Analysis, Insights and Forecast, 2019-2031
- 11.1. Market Analysis, Insights and Forecast - By Country/Sub-region
- 11.1.1 United States
- 11.1.2 Canada
- 11.1.3 Mexico
- 12. Europe Oil and Gas Pipeline Fabrication and Construction Industry Analysis, Insights and Forecast, 2019-2031
- 12.1. Market Analysis, Insights and Forecast - By Country/Sub-region
- 12.1.1 Germany
- 12.1.2 United Kingdom
- 12.1.3 France
- 12.1.4 Spain
- 12.1.5 Italy
- 12.1.6 Spain
- 12.1.7 Belgium
- 12.1.8 Netherland
- 12.1.9 Nordics
- 12.1.10 Rest of Europe
- 13. Asia Pacific Oil and Gas Pipeline Fabrication and Construction Industry Analysis, Insights and Forecast, 2019-2031
- 13.1. Market Analysis, Insights and Forecast - By Country/Sub-region
- 13.1.1 China
- 13.1.2 Japan
- 13.1.3 India
- 13.1.4 South Korea
- 13.1.5 Southeast Asia
- 13.1.6 Australia
- 13.1.7 Indonesia
- 13.1.8 Phillipes
- 13.1.9 Singapore
- 13.1.10 Thailandc
- 13.1.11 Rest of Asia Pacific
- 14. South America Oil and Gas Pipeline Fabrication and Construction Industry Analysis, Insights and Forecast, 2019-2031
- 14.1. Market Analysis, Insights and Forecast - By Country/Sub-region
- 14.1.1 Brazil
- 14.1.2 Argentina
- 14.1.3 Peru
- 14.1.4 Chile
- 14.1.5 Colombia
- 14.1.6 Ecuador
- 14.1.7 Venezuela
- 14.1.8 Rest of South America
- 15. North America Oil and Gas Pipeline Fabrication and Construction Industry Analysis, Insights and Forecast, 2019-2031
- 15.1. Market Analysis, Insights and Forecast - By Country/Sub-region
- 15.1.1 United States
- 15.1.2 Canada
- 15.1.3 Mexico
- 16. MEA Oil and Gas Pipeline Fabrication and Construction Industry Analysis, Insights and Forecast, 2019-2031
- 16.1. Market Analysis, Insights and Forecast - By Country/Sub-region
- 16.1.1 United Arab Emirates
- 16.1.2 Saudi Arabia
- 16.1.3 South Africa
- 16.1.4 Rest of Middle East and Africa
- 17. Competitive Analysis
- 17.1. Global Market Share Analysis 2024
- 17.2. Company Profiles
- 17.2.1 Sunland Construction Inc
- 17.2.1.1. Overview
- 17.2.1.2. Products
- 17.2.1.3. SWOT Analysis
- 17.2.1.4. Recent Developments
- 17.2.1.5. Financials (Based on Availability)
- 17.2.2 Tenaris SA
- 17.2.2.1. Overview
- 17.2.2.2. Products
- 17.2.2.3. SWOT Analysis
- 17.2.2.4. Recent Developments
- 17.2.2.5. Financials (Based on Availability)
- 17.2.3 Bechtel Corporation
- 17.2.3.1. Overview
- 17.2.3.2. Products
- 17.2.3.3. SWOT Analysis
- 17.2.3.4. Recent Developments
- 17.2.3.5. Financials (Based on Availability)
- 17.2.4 Ledcor Group
- 17.2.4.1. Overview
- 17.2.4.2. Products
- 17.2.4.3. SWOT Analysis
- 17.2.4.4. Recent Developments
- 17.2.4.5. Financials (Based on Availability)
- 17.2.5 Shengli Oil & Gas Pipe Holdings Limited
- 17.2.5.1. Overview
- 17.2.5.2. Products
- 17.2.5.3. SWOT Analysis
- 17.2.5.4. Recent Developments
- 17.2.5.5. Financials (Based on Availability)
- 17.2.6 Barnard Construction Company Inc
- 17.2.6.1. Overview
- 17.2.6.2. Products
- 17.2.6.3. SWOT Analysis
- 17.2.6.4. Recent Developments
- 17.2.6.5. Financials (Based on Availability)
- 17.2.7 Snelson Companies Inc
- 17.2.7.1. Overview
- 17.2.7.2. Products
- 17.2.7.3. SWOT Analysis
- 17.2.7.4. Recent Developments
- 17.2.7.5. Financials (Based on Availability)
- 17.2.8 Larsen & Toubro Limited*List Not Exhaustive
- 17.2.8.1. Overview
- 17.2.8.2. Products
- 17.2.8.3. SWOT Analysis
- 17.2.8.4. Recent Developments
- 17.2.8.5. Financials (Based on Availability)
- 17.2.9 Gateway Pipeline LLC
- 17.2.9.1. Overview
- 17.2.9.2. Products
- 17.2.9.3. SWOT Analysis
- 17.2.9.4. Recent Developments
- 17.2.9.5. Financials (Based on Availability)
- 17.2.10 Pumpco Inc
- 17.2.10.1. Overview
- 17.2.10.2. Products
- 17.2.10.3. SWOT Analysis
- 17.2.10.4. Recent Developments
- 17.2.10.5. Financials (Based on Availability)
- 17.2.1 Sunland Construction Inc
List of Figures
- Figure 1: Global Oil and Gas Pipeline Fabrication and Construction Industry Revenue Breakdown (Million, %) by Region 2024 & 2032
- Figure 2: North America Oil and Gas Pipeline Fabrication and Construction Industry Revenue (Million), by Country 2024 & 2032
- Figure 3: North America Oil and Gas Pipeline Fabrication and Construction Industry Revenue Share (%), by Country 2024 & 2032
- Figure 4: Europe Oil and Gas Pipeline Fabrication and Construction Industry Revenue (Million), by Country 2024 & 2032
- Figure 5: Europe Oil and Gas Pipeline Fabrication and Construction Industry Revenue Share (%), by Country 2024 & 2032
- Figure 6: Asia Pacific Oil and Gas Pipeline Fabrication and Construction Industry Revenue (Million), by Country 2024 & 2032
- Figure 7: Asia Pacific Oil and Gas Pipeline Fabrication and Construction Industry Revenue Share (%), by Country 2024 & 2032
- Figure 8: South America Oil and Gas Pipeline Fabrication and Construction Industry Revenue (Million), by Country 2024 & 2032
- Figure 9: South America Oil and Gas Pipeline Fabrication and Construction Industry Revenue Share (%), by Country 2024 & 2032
- Figure 10: North America Oil and Gas Pipeline Fabrication and Construction Industry Revenue (Million), by Country 2024 & 2032
- Figure 11: North America Oil and Gas Pipeline Fabrication and Construction Industry Revenue Share (%), by Country 2024 & 2032
- Figure 12: MEA Oil and Gas Pipeline Fabrication and Construction Industry Revenue (Million), by Country 2024 & 2032
- Figure 13: MEA Oil and Gas Pipeline Fabrication and Construction Industry Revenue Share (%), by Country 2024 & 2032
- Figure 14: North America Oil and Gas Pipeline Fabrication and Construction Industry Revenue (Million), by Application 2024 & 2032
- Figure 15: North America Oil and Gas Pipeline Fabrication and Construction Industry Revenue Share (%), by Application 2024 & 2032
- Figure 16: North America Oil and Gas Pipeline Fabrication and Construction Industry Revenue (Million), by Country 2024 & 2032
- Figure 17: North America Oil and Gas Pipeline Fabrication and Construction Industry Revenue Share (%), by Country 2024 & 2032
- Figure 18: Europe Oil and Gas Pipeline Fabrication and Construction Industry Revenue (Million), by Application 2024 & 2032
- Figure 19: Europe Oil and Gas Pipeline Fabrication and Construction Industry Revenue Share (%), by Application 2024 & 2032
- Figure 20: Europe Oil and Gas Pipeline Fabrication and Construction Industry Revenue (Million), by Country 2024 & 2032
- Figure 21: Europe Oil and Gas Pipeline Fabrication and Construction Industry Revenue Share (%), by Country 2024 & 2032
- Figure 22: Asia Pacific Oil and Gas Pipeline Fabrication and Construction Industry Revenue (Million), by Application 2024 & 2032
- Figure 23: Asia Pacific Oil and Gas Pipeline Fabrication and Construction Industry Revenue Share (%), by Application 2024 & 2032
- Figure 24: Asia Pacific Oil and Gas Pipeline Fabrication and Construction Industry Revenue (Million), by Country 2024 & 2032
- Figure 25: Asia Pacific Oil and Gas Pipeline Fabrication and Construction Industry Revenue Share (%), by Country 2024 & 2032
- Figure 26: South America Oil and Gas Pipeline Fabrication and Construction Industry Revenue (Million), by Application 2024 & 2032
- Figure 27: South America Oil and Gas Pipeline Fabrication and Construction Industry Revenue Share (%), by Application 2024 & 2032
- Figure 28: South America Oil and Gas Pipeline Fabrication and Construction Industry Revenue (Million), by Country 2024 & 2032
- Figure 29: South America Oil and Gas Pipeline Fabrication and Construction Industry Revenue Share (%), by Country 2024 & 2032
- Figure 30: Middle East and Africa Oil and Gas Pipeline Fabrication and Construction Industry Revenue (Million), by Application 2024 & 2032
- Figure 31: Middle East and Africa Oil and Gas Pipeline Fabrication and Construction Industry Revenue Share (%), by Application 2024 & 2032
- Figure 32: Middle East and Africa Oil and Gas Pipeline Fabrication and Construction Industry Revenue (Million), by Country 2024 & 2032
- Figure 33: Middle East and Africa Oil and Gas Pipeline Fabrication and Construction Industry Revenue Share (%), by Country 2024 & 2032
List of Tables
- Table 1: Global Oil and Gas Pipeline Fabrication and Construction Industry Revenue Million Forecast, by Region 2019 & 2032
- Table 2: Global Oil and Gas Pipeline Fabrication and Construction Industry Revenue Million Forecast, by Application 2019 & 2032
- Table 3: Global Oil and Gas Pipeline Fabrication and Construction Industry Revenue Million Forecast, by Region 2019 & 2032
- Table 4: Global Oil and Gas Pipeline Fabrication and Construction Industry Revenue Million Forecast, by Country 2019 & 2032
- Table 5: United States Oil and Gas Pipeline Fabrication and Construction Industry Revenue (Million) Forecast, by Application 2019 & 2032
- Table 6: Canada Oil and Gas Pipeline Fabrication and Construction Industry Revenue (Million) Forecast, by Application 2019 & 2032
- Table 7: Mexico Oil and Gas Pipeline Fabrication and Construction Industry Revenue (Million) Forecast, by Application 2019 & 2032
- Table 8: Global Oil and Gas Pipeline Fabrication and Construction Industry Revenue Million Forecast, by Country 2019 & 2032
- Table 9: Germany Oil and Gas Pipeline Fabrication and Construction Industry Revenue (Million) Forecast, by Application 2019 & 2032
- Table 10: United Kingdom Oil and Gas Pipeline Fabrication and Construction Industry Revenue (Million) Forecast, by Application 2019 & 2032
- Table 11: France Oil and Gas Pipeline Fabrication and Construction Industry Revenue (Million) Forecast, by Application 2019 & 2032
- Table 12: Spain Oil and Gas Pipeline Fabrication and Construction Industry Revenue (Million) Forecast, by Application 2019 & 2032
- Table 13: Italy Oil and Gas Pipeline Fabrication and Construction Industry Revenue (Million) Forecast, by Application 2019 & 2032
- Table 14: Spain Oil and Gas Pipeline Fabrication and Construction Industry Revenue (Million) Forecast, by Application 2019 & 2032
- Table 15: Belgium Oil and Gas Pipeline Fabrication and Construction Industry Revenue (Million) Forecast, by Application 2019 & 2032
- Table 16: Netherland Oil and Gas Pipeline Fabrication and Construction Industry Revenue (Million) Forecast, by Application 2019 & 2032
- Table 17: Nordics Oil and Gas Pipeline Fabrication and Construction Industry Revenue (Million) Forecast, by Application 2019 & 2032
- Table 18: Rest of Europe Oil and Gas Pipeline Fabrication and Construction Industry Revenue (Million) Forecast, by Application 2019 & 2032
- Table 19: Global Oil and Gas Pipeline Fabrication and Construction Industry Revenue Million Forecast, by Country 2019 & 2032
- Table 20: China Oil and Gas Pipeline Fabrication and Construction Industry Revenue (Million) Forecast, by Application 2019 & 2032
- Table 21: Japan Oil and Gas Pipeline Fabrication and Construction Industry Revenue (Million) Forecast, by Application 2019 & 2032
- Table 22: India Oil and Gas Pipeline Fabrication and Construction Industry Revenue (Million) Forecast, by Application 2019 & 2032
- Table 23: South Korea Oil and Gas Pipeline Fabrication and Construction Industry Revenue (Million) Forecast, by Application 2019 & 2032
- Table 24: Southeast Asia Oil and Gas Pipeline Fabrication and Construction Industry Revenue (Million) Forecast, by Application 2019 & 2032
- Table 25: Australia Oil and Gas Pipeline Fabrication and Construction Industry Revenue (Million) Forecast, by Application 2019 & 2032
- Table 26: Indonesia Oil and Gas Pipeline Fabrication and Construction Industry Revenue (Million) Forecast, by Application 2019 & 2032
- Table 27: Phillipes Oil and Gas Pipeline Fabrication and Construction Industry Revenue (Million) Forecast, by Application 2019 & 2032
- Table 28: Singapore Oil and Gas Pipeline Fabrication and Construction Industry Revenue (Million) Forecast, by Application 2019 & 2032
- Table 29: Thailandc Oil and Gas Pipeline Fabrication and Construction Industry Revenue (Million) Forecast, by Application 2019 & 2032
- Table 30: Rest of Asia Pacific Oil and Gas Pipeline Fabrication and Construction Industry Revenue (Million) Forecast, by Application 2019 & 2032
- Table 31: Global Oil and Gas Pipeline Fabrication and Construction Industry Revenue Million Forecast, by Country 2019 & 2032
- Table 32: Brazil Oil and Gas Pipeline Fabrication and Construction Industry Revenue (Million) Forecast, by Application 2019 & 2032
- Table 33: Argentina Oil and Gas Pipeline Fabrication and Construction Industry Revenue (Million) Forecast, by Application 2019 & 2032
- Table 34: Peru Oil and Gas Pipeline Fabrication and Construction Industry Revenue (Million) Forecast, by Application 2019 & 2032
- Table 35: Chile Oil and Gas Pipeline Fabrication and Construction Industry Revenue (Million) Forecast, by Application 2019 & 2032
- Table 36: Colombia Oil and Gas Pipeline Fabrication and Construction Industry Revenue (Million) Forecast, by Application 2019 & 2032
- Table 37: Ecuador Oil and Gas Pipeline Fabrication and Construction Industry Revenue (Million) Forecast, by Application 2019 & 2032
- Table 38: Venezuela Oil and Gas Pipeline Fabrication and Construction Industry Revenue (Million) Forecast, by Application 2019 & 2032
- Table 39: Rest of South America Oil and Gas Pipeline Fabrication and Construction Industry Revenue (Million) Forecast, by Application 2019 & 2032
- Table 40: Global Oil and Gas Pipeline Fabrication and Construction Industry Revenue Million Forecast, by Country 2019 & 2032
- Table 41: United States Oil and Gas Pipeline Fabrication and Construction Industry Revenue (Million) Forecast, by Application 2019 & 2032
- Table 42: Canada Oil and Gas Pipeline Fabrication and Construction Industry Revenue (Million) Forecast, by Application 2019 & 2032
- Table 43: Mexico Oil and Gas Pipeline Fabrication and Construction Industry Revenue (Million) Forecast, by Application 2019 & 2032
- Table 44: Global Oil and Gas Pipeline Fabrication and Construction Industry Revenue Million Forecast, by Country 2019 & 2032
- Table 45: United Arab Emirates Oil and Gas Pipeline Fabrication and Construction Industry Revenue (Million) Forecast, by Application 2019 & 2032
- Table 46: Saudi Arabia Oil and Gas Pipeline Fabrication and Construction Industry Revenue (Million) Forecast, by Application 2019 & 2032
- Table 47: South Africa Oil and Gas Pipeline Fabrication and Construction Industry Revenue (Million) Forecast, by Application 2019 & 2032
- Table 48: Rest of Middle East and Africa Oil and Gas Pipeline Fabrication and Construction Industry Revenue (Million) Forecast, by Application 2019 & 2032
- Table 49: Global Oil and Gas Pipeline Fabrication and Construction Industry Revenue Million Forecast, by Application 2019 & 2032
- Table 50: Global Oil and Gas Pipeline Fabrication and Construction Industry Revenue Million Forecast, by Country 2019 & 2032
- Table 51: Global Oil and Gas Pipeline Fabrication and Construction Industry Revenue Million Forecast, by Application 2019 & 2032
- Table 52: Global Oil and Gas Pipeline Fabrication and Construction Industry Revenue Million Forecast, by Country 2019 & 2032
- Table 53: Global Oil and Gas Pipeline Fabrication and Construction Industry Revenue Million Forecast, by Application 2019 & 2032
- Table 54: Global Oil and Gas Pipeline Fabrication and Construction Industry Revenue Million Forecast, by Country 2019 & 2032
- Table 55: Global Oil and Gas Pipeline Fabrication and Construction Industry Revenue Million Forecast, by Application 2019 & 2032
- Table 56: Global Oil and Gas Pipeline Fabrication and Construction Industry Revenue Million Forecast, by Country 2019 & 2032
- Table 57: Global Oil and Gas Pipeline Fabrication and Construction Industry Revenue Million Forecast, by Application 2019 & 2032
- Table 58: Global Oil and Gas Pipeline Fabrication and Construction Industry Revenue Million Forecast, by Country 2019 & 2032
Frequently Asked Questions
1. What is the projected Compound Annual Growth Rate (CAGR) of the Oil and Gas Pipeline Fabrication and Construction Industry?
The projected CAGR is approximately > 3.50%.
2. Which companies are prominent players in the Oil and Gas Pipeline Fabrication and Construction Industry?
Key companies in the market include Sunland Construction Inc, Tenaris SA, Bechtel Corporation, Ledcor Group, Shengli Oil & Gas Pipe Holdings Limited, Barnard Construction Company Inc, Snelson Companies Inc, Larsen & Toubro Limited*List Not Exhaustive, Gateway Pipeline LLC, Pumpco Inc.
3. What are the main segments of the Oil and Gas Pipeline Fabrication and Construction Industry?
The market segments include Application.
4. Can you provide details about the market size?
The market size is estimated to be USD XX Million as of 2022.
5. What are some drivers contributing to market growth?
4.; Increasing Investment in LNG Infrastructure4.; Rising Demand for LNG in Bunkering. Road Transportation. and Off-grid Power.
6. What are the notable trends driving market growth?
Gas Segment to Record Significant Growth.
7. Are there any restraints impacting market growth?
4.; Lack of Supporting Infrastructure in the Regions such as the Middle East and Africa.
8. Can you provide examples of recent developments in the market?
N/A
9. What pricing options are available for accessing the report?
Pricing options include single-user, multi-user, and enterprise licenses priced at USD 4750, USD 5250, and USD 8750 respectively.
10. Is the market size provided in terms of value or volume?
The market size is provided in terms of value, measured in Million.
11. Are there any specific market keywords associated with the report?
Yes, the market keyword associated with the report is "Oil and Gas Pipeline Fabrication and Construction Industry," which aids in identifying and referencing the specific market segment covered.
12. How do I determine which pricing option suits my needs best?
The pricing options vary based on user requirements and access needs. Individual users may opt for single-user licenses, while businesses requiring broader access may choose multi-user or enterprise licenses for cost-effective access to the report.
13. Are there any additional resources or data provided in the Oil and Gas Pipeline Fabrication and Construction Industry report?
While the report offers comprehensive insights, it's advisable to review the specific contents or supplementary materials provided to ascertain if additional resources or data are available.
14. How can I stay updated on further developments or reports in the Oil and Gas Pipeline Fabrication and Construction Industry?
To stay informed about further developments, trends, and reports in the Oil and Gas Pipeline Fabrication and Construction Industry, consider subscribing to industry newsletters, following relevant companies and organizations, or regularly checking reputable industry news sources and publications.
Methodology
Step 1 - Identification of Relevant Samples Size from Population Database


Step 2 - Approaches for Defining Global Market Size (Value, Volume* & Price*)

Note*: In applicable scenarios
Step 3 - Data Sources
Primary Research
- Web Analytics
- Survey Reports
- Research Institute
- Latest Research Reports
- Opinion Leaders
Secondary Research
- Annual Reports
- White Paper
- Latest Press Release
- Industry Association
- Paid Database
- Investor Presentations

Step 4 - Data Triangulation
Involves using different sources of information in order to increase the validity of a study
These sources are likely to be stakeholders in a program - participants, other researchers, program staff, other community members, and so on.
Then we put all data in single framework & apply various statistical tools to find out the dynamic on the market.
During the analysis stage, feedback from the stakeholder groups would be compared to determine areas of agreement as well as areas of divergence
