

Key Insights
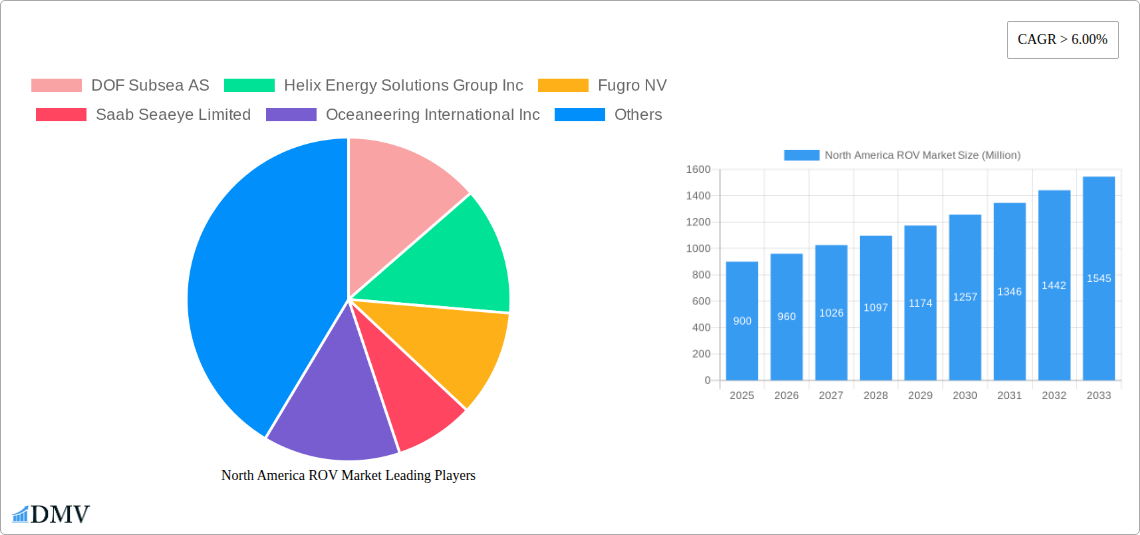
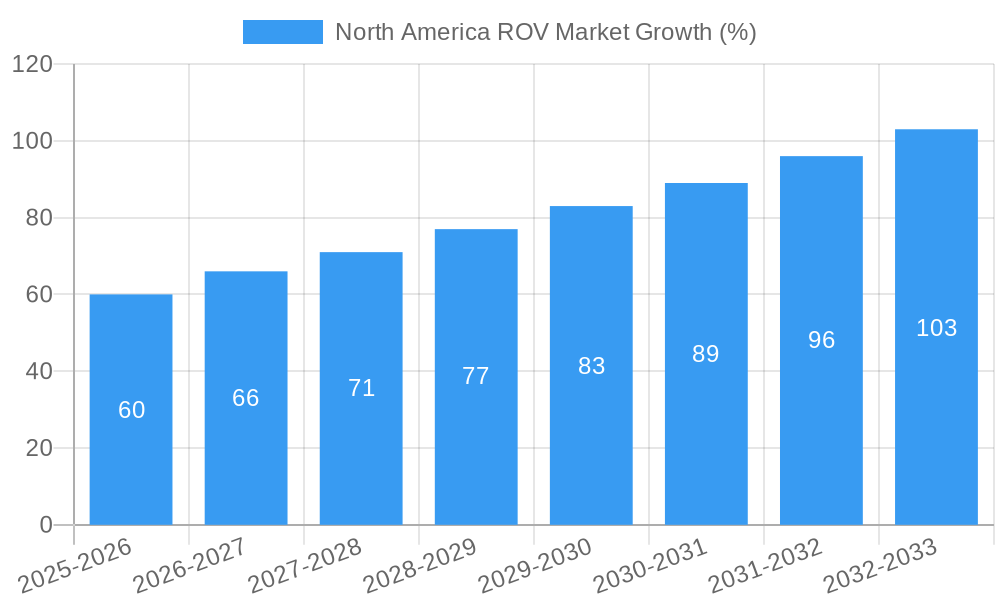
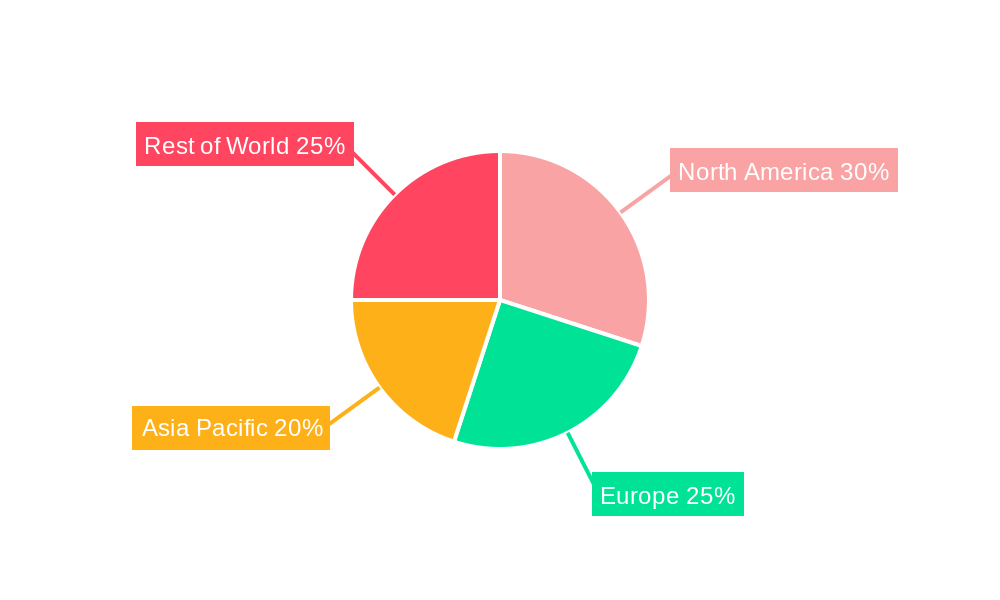
The North American remotely operated vehicle (ROV) market is experiencing robust growth, driven by increasing offshore oil and gas exploration and production activities, coupled with rising demand for subsea infrastructure inspection and maintenance. The market's expansion is further fueled by advancements in ROV technology, including enhanced maneuverability, improved sensor capabilities, and greater operational depths. Specifically, the Work Class ROV segment dominates due to its versatility in handling complex subsea tasks, while the Oil and Gas application sector remains the largest contributor to market revenue. The projected CAGR of over 6% indicates a sustained growth trajectory throughout the forecast period (2025-2033). While regulatory hurdles and potential environmental concerns could present challenges, the overall market outlook remains positive, particularly with the ongoing emphasis on subsea infrastructure development and the increasing adoption of ROVs in other sectors like defense and scientific research. Key players like Oceaneering International Inc., DOF Subsea AS, and Fugro NV are well-positioned to benefit from this growth, leveraging their expertise and technological advancements to cater to the evolving needs of the market. The United States, as the largest economy in North America, is expected to be the dominant market within the region, followed by Canada and Mexico. Within the activities segment, survey, inspection, repair, and maintenance (SIMR) activities are the primary drivers, reflecting the crucial role ROVs play in ensuring the safety and efficiency of subsea operations.
The North American ROV market is segmented by type (Work Class and Observatory Class), application (Oil and Gas, Defense, and Other), and activity (SIMR, burial and trenching, and other activities). While precise market size data for North America in 2025 is unavailable, a reasonable estimation, considering the global market size and North America's significant share in offshore activities, would place the 2025 North American market value in the range of $800 million to $1 billion USD. This estimate assumes a consistent proportion of the global market held by North America over the past years and future years. The continued expansion of the Oil and Gas sector, alongside the growth of renewable energy projects requiring subsea infrastructure development, will ensure continued growth for the North American ROV market in the coming years. Further market diversification into sectors like defense and scientific research presents significant opportunities for future expansion.
North America ROV Market Market Composition & Trends
This comprehensive report offers an in-depth analysis of the North America ROV market, encompassing the period from 2019 to 2033. The study meticulously examines market concentration, revealing a moderately consolidated landscape with key players such as DOF Subsea AS, Oceaneering International Inc, and Fugro NV holding significant market share. Precise market share distribution figures for 2024 are currently unavailable (xx%), but the report provides a detailed breakdown based on available data and expert estimations. Innovation in ROV technology, driven by advancements in sensor technology, AI-powered navigation, and improved manipulation capabilities, is a key catalyst for market growth. The regulatory landscape, particularly concerning safety standards and environmental regulations, plays a crucial role in shaping market dynamics. Substitute products, while limited, include AUVs and divers, and their impact on ROV market share is analyzed. The report profiles end-users across various sectors, including oil and gas, defense, and other applications, assessing their specific ROV needs and preferences. Finally, the report analyzes recent M&A activities within the industry, examining deal values and their influence on market structure. Data from 2019-2024 shows fluctuating M&A activity with an estimated total deal value of $xx Million over this period.
North America ROV Market Industry Evolution
The North America ROV market has witnessed significant evolution from 2019 to 2024, marked by fluctuating growth trajectories mirroring the broader energy sector's trends. The historical period (2019-2024) showed a Compound Annual Growth Rate (CAGR) of xx%, influenced by oil price volatility and project investment cycles. Technological advancements, including improved sensor technologies, enhanced control systems, and the integration of AI, have significantly impacted ROV capabilities and operational efficiency. This evolution has led to increased adoption of advanced ROV systems across various applications, particularly in deepwater oil and gas exploration and defense operations. The report meticulously tracks this growth, analyzing market penetration rates for different ROV types and applications. The forecast period (2025-2033) projects a CAGR of xx%, driven by factors such as increasing offshore energy exploration, rising demand for underwater infrastructure inspections, and growing government investment in defense and maritime surveillance. The shift in consumer demands towards increased automation, enhanced safety features, and cost-effective solutions further influences the market trajectory. Specific data points, including adoption rates of new technologies and market segment growth forecasts, are detailed within the report.
Leading Regions, Countries, or Segments in North America ROV Market
Dominant Segment: The Work Class ROV segment dominates the market due to its versatility and application across various sectors. This is fueled by the extensive use of Work Class ROVs in the Oil and Gas industry for subsea inspection, repair, and maintenance (IRM).
Leading Region: The Gulf of Mexico maintains its position as the leading region due to its high concentration of offshore oil and gas activities, driving a significant demand for ROV services.
Key Drivers:
- Substantial investment in offshore energy infrastructure projects.
- Stringent safety regulations mandating regular underwater inspections.
- Growing interest in underwater renewable energy projects, such as offshore wind farms.
The dominance of the Gulf of Mexico stems from a combination of factors, including its rich reserves of hydrocarbons, extensive existing infrastructure, and supportive regulatory frameworks. The Oil and Gas application segment contributes significantly to overall market growth, driven by the continuous need for subsea operations. The US government's investments in defense and naval capabilities further contribute to the growth of the Defense application segment.
North America ROV Market Product Innovations
Recent years have witnessed considerable innovation in ROV technology, including the introduction of more compact and versatile models, enhanced manipulator arms with improved dexterity, and advanced sensor integration for improved situational awareness. The integration of AI and machine learning for autonomous navigation and object recognition is rapidly gaining traction, significantly improving operational efficiency and reducing human intervention. These innovations are enhancing ROV capabilities in challenging environments, expanding applications in various sectors beyond traditional oil and gas operations. Unique selling propositions of new ROV models typically focus on improvements in maneuverability, payload capacity, and the incorporation of cutting-edge sensor technologies. The report meticulously assesses the performance metrics of leading ROV models, considering factors such as depth rating, endurance, and operational speed.
Propelling Factors for North America ROV Market Growth
Several factors contribute to the North America ROV market's growth. Technological advancements like AI-powered navigation and improved sensors enhance efficiency and capabilities, opening new applications. Economic drivers include rising offshore energy exploration and increasing investments in underwater infrastructure development. Favorable government policies and regulatory support promoting maritime safety and environmental protection further fuel market expansion. For example, the US Navy's standardization of VideoRay Defender systems reflects a clear trend towards advanced ROV technology adoption within the defense sector.
Obstacles in the North America ROV Market Market
The North America ROV market faces challenges, including supply chain disruptions affecting component availability and increasing manufacturing costs. Stringent safety and environmental regulations increase operational complexity and costs. Intense competition among established players and emerging technology providers puts pressure on pricing and profit margins. These factors can collectively impact market growth, although the specific quantifiable impact varies and is analyzed in detail within the report, including projected cost increases for specific components or regulatory compliance.
Future Opportunities in North America ROV Market
Emerging opportunities abound in the North America ROV market. Expansion into new sectors, such as aquaculture and underwater archaeology, is expected. Advancements in autonomous operations and AI will further drive market growth. Increasing demand for subsea infrastructure inspection, repair, and maintenance will sustain the growth of the market. Moreover, the development of specialized ROVs for specific tasks, such as pipeline inspection and seabed mapping, will create lucrative opportunities for market players.
Major Players in the North America ROV Market Ecosystem
- DOF Subsea AS
- Helix Energy Solutions Group Inc
- Fugro NV
- Saab Seaeye Limited
- Oceaneering International Inc
- Delta SubSea LLC
- Saipem SpA
- DeepOcean AS
- Forum Energy Technologies Inc
- ROVOP
- TechnipFMC PLC
- Bourbon Corporation SA
Key Developments in North America ROV Market Industry
- August 2022: VideoRay, LLC, receives a large order for Defender ROVs from the US Navy, signifying the growing adoption of advanced ROVs in the defense sector.
- October 2021: ECA Group launches the R7 ROV, combining the benefits of mini and observation-class ROVs, indicating a trend toward more versatile and efficient systems.
- March 2021: Oceaneering International secures a contract for integrated rig services in the US Gulf of Mexico, highlighting the continued demand for ROV services in the oil and gas industry.
Strategic North America ROV Market Market Forecast
The North America ROV market is poised for sustained growth, fueled by technological advancements, increasing offshore energy exploration activities, and growing demand for subsea inspections across various sectors. The forecast period (2025-2033) anticipates robust expansion, driven by the adoption of innovative solutions and government investments. This growth will be further propelled by the continued development of advanced autonomous capabilities and the increasing focus on environmental sustainability in underwater operations. The market presents significant opportunities for established players and emerging companies alike, offering substantial potential for market expansion and technological innovation.
North America ROV Market Segmentation
-
1. Type
- 1.1. Work Class ROV
- 1.2. Observatory Class ROV
-
2. Application
- 2.1. Oil and Gas
- 2.2. Defense
- 2.3. Other Applications
-
3. Activity
- 3.1. Survey
- 3.2. Inspection, Repair, and Maintenance
- 3.3. Burial and Trenching
- 3.4. Other Activities
-
4. Geography
- 4.1. United States
- 4.2. Canada
- 4.3. Rest of North America
North America ROV Market Segmentation By Geography
- 1. United States
- 2. Canada
- 3. Rest of North America
North America ROV Market REPORT HIGHLIGHTS
| Aspects | Details |
|---|---|
| Study Period | 2019-2033 |
| Base Year | 2024 |
| Estimated Year | 2025 |
| Forecast Period | 2025-2033 |
| Historical Period | 2019-2024 |
| Growth Rate | CAGR of > 6.00% from 2019-2033 |
| Segmentation |
|
Table of Contents
- 1. Introduction
- 1.1. Research Scope
- 1.2. Market Segmentation
- 1.3. Research Methodology
- 1.4. Definitions and Assumptions
- 2. Executive Summary
- 2.1. Introduction
- 3. Market Dynamics
- 3.1. Introduction
- 3.2. Market Drivers
- 3.2.1 4.; Increasing Offshore Oil and Gas Exploration Activities in the American
- 3.2.2 Asia-Pacific
- 3.2.3 and Middle-East and African Regions4.; Growing Offshore Renewable Technologies
- 3.3. Market Restrains
- 3.3.1. 4.; Ban on Offshore Exploration and Production Activities in Multiple Regions
- 3.4. Market Trends
- 3.4.1. Oil & Gas Application to Dominate the Market
- 4. Market Factor Analysis
- 4.1. Porters Five Forces
- 4.2. Supply/Value Chain
- 4.3. PESTEL analysis
- 4.4. Market Entropy
- 4.5. Patent/Trademark Analysis
- 5. North America ROV Market Analysis, Insights and Forecast, 2019-2031
- 5.1. Market Analysis, Insights and Forecast - by Type
- 5.1.1. Work Class ROV
- 5.1.2. Observatory Class ROV
- 5.2. Market Analysis, Insights and Forecast - by Application
- 5.2.1. Oil and Gas
- 5.2.2. Defense
- 5.2.3. Other Applications
- 5.3. Market Analysis, Insights and Forecast - by Activity
- 5.3.1. Survey
- 5.3.2. Inspection, Repair, and Maintenance
- 5.3.3. Burial and Trenching
- 5.3.4. Other Activities
- 5.4. Market Analysis, Insights and Forecast - by Geography
- 5.4.1. United States
- 5.4.2. Canada
- 5.4.3. Rest of North America
- 5.5. Market Analysis, Insights and Forecast - by Region
- 5.5.1. United States
- 5.5.2. Canada
- 5.5.3. Rest of North America
- 5.1. Market Analysis, Insights and Forecast - by Type
- 6. United States North America ROV Market Analysis, Insights and Forecast, 2019-2031
- 6.1. Market Analysis, Insights and Forecast - by Type
- 6.1.1. Work Class ROV
- 6.1.2. Observatory Class ROV
- 6.2. Market Analysis, Insights and Forecast - by Application
- 6.2.1. Oil and Gas
- 6.2.2. Defense
- 6.2.3. Other Applications
- 6.3. Market Analysis, Insights and Forecast - by Activity
- 6.3.1. Survey
- 6.3.2. Inspection, Repair, and Maintenance
- 6.3.3. Burial and Trenching
- 6.3.4. Other Activities
- 6.4. Market Analysis, Insights and Forecast - by Geography
- 6.4.1. United States
- 6.4.2. Canada
- 6.4.3. Rest of North America
- 6.1. Market Analysis, Insights and Forecast - by Type
- 7. Canada North America ROV Market Analysis, Insights and Forecast, 2019-2031
- 7.1. Market Analysis, Insights and Forecast - by Type
- 7.1.1. Work Class ROV
- 7.1.2. Observatory Class ROV
- 7.2. Market Analysis, Insights and Forecast - by Application
- 7.2.1. Oil and Gas
- 7.2.2. Defense
- 7.2.3. Other Applications
- 7.3. Market Analysis, Insights and Forecast - by Activity
- 7.3.1. Survey
- 7.3.2. Inspection, Repair, and Maintenance
- 7.3.3. Burial and Trenching
- 7.3.4. Other Activities
- 7.4. Market Analysis, Insights and Forecast - by Geography
- 7.4.1. United States
- 7.4.2. Canada
- 7.4.3. Rest of North America
- 7.1. Market Analysis, Insights and Forecast - by Type
- 8. Rest of North America North America ROV Market Analysis, Insights and Forecast, 2019-2031
- 8.1. Market Analysis, Insights and Forecast - by Type
- 8.1.1. Work Class ROV
- 8.1.2. Observatory Class ROV
- 8.2. Market Analysis, Insights and Forecast - by Application
- 8.2.1. Oil and Gas
- 8.2.2. Defense
- 8.2.3. Other Applications
- 8.3. Market Analysis, Insights and Forecast - by Activity
- 8.3.1. Survey
- 8.3.2. Inspection, Repair, and Maintenance
- 8.3.3. Burial and Trenching
- 8.3.4. Other Activities
- 8.4. Market Analysis, Insights and Forecast - by Geography
- 8.4.1. United States
- 8.4.2. Canada
- 8.4.3. Rest of North America
- 8.1. Market Analysis, Insights and Forecast - by Type
- 9. United States North America ROV Market Analysis, Insights and Forecast, 2019-2031
- 10. Canada North America ROV Market Analysis, Insights and Forecast, 2019-2031
- 11. Mexico North America ROV Market Analysis, Insights and Forecast, 2019-2031
- 12. Rest of North America North America ROV Market Analysis, Insights and Forecast, 2019-2031
- 13. Competitive Analysis
- 13.1. Market Share Analysis 2024
- 13.2. Company Profiles
- 13.2.1 DOF Subsea AS
- 13.2.1.1. Overview
- 13.2.1.2. Products
- 13.2.1.3. SWOT Analysis
- 13.2.1.4. Recent Developments
- 13.2.1.5. Financials (Based on Availability)
- 13.2.2 Helix Energy Solutions Group Inc
- 13.2.2.1. Overview
- 13.2.2.2. Products
- 13.2.2.3. SWOT Analysis
- 13.2.2.4. Recent Developments
- 13.2.2.5. Financials (Based on Availability)
- 13.2.3 Fugro NV
- 13.2.3.1. Overview
- 13.2.3.2. Products
- 13.2.3.3. SWOT Analysis
- 13.2.3.4. Recent Developments
- 13.2.3.5. Financials (Based on Availability)
- 13.2.4 Saab Seaeye Limited
- 13.2.4.1. Overview
- 13.2.4.2. Products
- 13.2.4.3. SWOT Analysis
- 13.2.4.4. Recent Developments
- 13.2.4.5. Financials (Based on Availability)
- 13.2.5 Oceaneering International Inc
- 13.2.5.1. Overview
- 13.2.5.2. Products
- 13.2.5.3. SWOT Analysis
- 13.2.5.4. Recent Developments
- 13.2.5.5. Financials (Based on Availability)
- 13.2.6 Delta SubSea LLC
- 13.2.6.1. Overview
- 13.2.6.2. Products
- 13.2.6.3. SWOT Analysis
- 13.2.6.4. Recent Developments
- 13.2.6.5. Financials (Based on Availability)
- 13.2.7 Saipem SpA
- 13.2.7.1. Overview
- 13.2.7.2. Products
- 13.2.7.3. SWOT Analysis
- 13.2.7.4. Recent Developments
- 13.2.7.5. Financials (Based on Availability)
- 13.2.8 DeepOcean AS
- 13.2.8.1. Overview
- 13.2.8.2. Products
- 13.2.8.3. SWOT Analysis
- 13.2.8.4. Recent Developments
- 13.2.8.5. Financials (Based on Availability)
- 13.2.9 Forum Energy Technologies Inc
- 13.2.9.1. Overview
- 13.2.9.2. Products
- 13.2.9.3. SWOT Analysis
- 13.2.9.4. Recent Developments
- 13.2.9.5. Financials (Based on Availability)
- 13.2.10 ROVOP*List Not Exhaustive
- 13.2.10.1. Overview
- 13.2.10.2. Products
- 13.2.10.3. SWOT Analysis
- 13.2.10.4. Recent Developments
- 13.2.10.5. Financials (Based on Availability)
- 13.2.11 TechnipFMC PLC
- 13.2.11.1. Overview
- 13.2.11.2. Products
- 13.2.11.3. SWOT Analysis
- 13.2.11.4. Recent Developments
- 13.2.11.5. Financials (Based on Availability)
- 13.2.12 Bourbon Corporation SA
- 13.2.12.1. Overview
- 13.2.12.2. Products
- 13.2.12.3. SWOT Analysis
- 13.2.12.4. Recent Developments
- 13.2.12.5. Financials (Based on Availability)
- 13.2.1 DOF Subsea AS
List of Figures
- Figure 1: North America ROV Market Revenue Breakdown (Million, %) by Product 2024 & 2032
- Figure 2: North America ROV Market Share (%) by Company 2024
List of Tables
- Table 1: North America ROV Market Revenue Million Forecast, by Region 2019 & 2032
- Table 2: North America ROV Market Volume K Unit Forecast, by Region 2019 & 2032
- Table 3: North America ROV Market Revenue Million Forecast, by Type 2019 & 2032
- Table 4: North America ROV Market Volume K Unit Forecast, by Type 2019 & 2032
- Table 5: North America ROV Market Revenue Million Forecast, by Application 2019 & 2032
- Table 6: North America ROV Market Volume K Unit Forecast, by Application 2019 & 2032
- Table 7: North America ROV Market Revenue Million Forecast, by Activity 2019 & 2032
- Table 8: North America ROV Market Volume K Unit Forecast, by Activity 2019 & 2032
- Table 9: North America ROV Market Revenue Million Forecast, by Geography 2019 & 2032
- Table 10: North America ROV Market Volume K Unit Forecast, by Geography 2019 & 2032
- Table 11: North America ROV Market Revenue Million Forecast, by Region 2019 & 2032
- Table 12: North America ROV Market Volume K Unit Forecast, by Region 2019 & 2032
- Table 13: North America ROV Market Revenue Million Forecast, by Country 2019 & 2032
- Table 14: North America ROV Market Volume K Unit Forecast, by Country 2019 & 2032
- Table 15: United States North America ROV Market Revenue (Million) Forecast, by Application 2019 & 2032
- Table 16: United States North America ROV Market Volume (K Unit) Forecast, by Application 2019 & 2032
- Table 17: Canada North America ROV Market Revenue (Million) Forecast, by Application 2019 & 2032
- Table 18: Canada North America ROV Market Volume (K Unit) Forecast, by Application 2019 & 2032
- Table 19: Mexico North America ROV Market Revenue (Million) Forecast, by Application 2019 & 2032
- Table 20: Mexico North America ROV Market Volume (K Unit) Forecast, by Application 2019 & 2032
- Table 21: Rest of North America North America ROV Market Revenue (Million) Forecast, by Application 2019 & 2032
- Table 22: Rest of North America North America ROV Market Volume (K Unit) Forecast, by Application 2019 & 2032
- Table 23: North America ROV Market Revenue Million Forecast, by Type 2019 & 2032
- Table 24: North America ROV Market Volume K Unit Forecast, by Type 2019 & 2032
- Table 25: North America ROV Market Revenue Million Forecast, by Application 2019 & 2032
- Table 26: North America ROV Market Volume K Unit Forecast, by Application 2019 & 2032
- Table 27: North America ROV Market Revenue Million Forecast, by Activity 2019 & 2032
- Table 28: North America ROV Market Volume K Unit Forecast, by Activity 2019 & 2032
- Table 29: North America ROV Market Revenue Million Forecast, by Geography 2019 & 2032
- Table 30: North America ROV Market Volume K Unit Forecast, by Geography 2019 & 2032
- Table 31: North America ROV Market Revenue Million Forecast, by Country 2019 & 2032
- Table 32: North America ROV Market Volume K Unit Forecast, by Country 2019 & 2032
- Table 33: North America ROV Market Revenue Million Forecast, by Type 2019 & 2032
- Table 34: North America ROV Market Volume K Unit Forecast, by Type 2019 & 2032
- Table 35: North America ROV Market Revenue Million Forecast, by Application 2019 & 2032
- Table 36: North America ROV Market Volume K Unit Forecast, by Application 2019 & 2032
- Table 37: North America ROV Market Revenue Million Forecast, by Activity 2019 & 2032
- Table 38: North America ROV Market Volume K Unit Forecast, by Activity 2019 & 2032
- Table 39: North America ROV Market Revenue Million Forecast, by Geography 2019 & 2032
- Table 40: North America ROV Market Volume K Unit Forecast, by Geography 2019 & 2032
- Table 41: North America ROV Market Revenue Million Forecast, by Country 2019 & 2032
- Table 42: North America ROV Market Volume K Unit Forecast, by Country 2019 & 2032
- Table 43: North America ROV Market Revenue Million Forecast, by Type 2019 & 2032
- Table 44: North America ROV Market Volume K Unit Forecast, by Type 2019 & 2032
- Table 45: North America ROV Market Revenue Million Forecast, by Application 2019 & 2032
- Table 46: North America ROV Market Volume K Unit Forecast, by Application 2019 & 2032
- Table 47: North America ROV Market Revenue Million Forecast, by Activity 2019 & 2032
- Table 48: North America ROV Market Volume K Unit Forecast, by Activity 2019 & 2032
- Table 49: North America ROV Market Revenue Million Forecast, by Geography 2019 & 2032
- Table 50: North America ROV Market Volume K Unit Forecast, by Geography 2019 & 2032
- Table 51: North America ROV Market Revenue Million Forecast, by Country 2019 & 2032
- Table 52: North America ROV Market Volume K Unit Forecast, by Country 2019 & 2032
Frequently Asked Questions
1. What is the projected Compound Annual Growth Rate (CAGR) of the North America ROV Market?
The projected CAGR is approximately > 6.00%.
2. Which companies are prominent players in the North America ROV Market?
Key companies in the market include DOF Subsea AS, Helix Energy Solutions Group Inc, Fugro NV, Saab Seaeye Limited, Oceaneering International Inc, Delta SubSea LLC, Saipem SpA, DeepOcean AS, Forum Energy Technologies Inc, ROVOP*List Not Exhaustive, TechnipFMC PLC, Bourbon Corporation SA.
3. What are the main segments of the North America ROV Market?
The market segments include Type, Application, Activity, Geography.
4. Can you provide details about the market size?
The market size is estimated to be USD XX Million as of 2022.
5. What are some drivers contributing to market growth?
4.; Increasing Offshore Oil and Gas Exploration Activities in the American. Asia-Pacific. and Middle-East and African Regions4.; Growing Offshore Renewable Technologies.
6. What are the notable trends driving market growth?
Oil & Gas Application to Dominate the Market.
7. Are there any restraints impacting market growth?
4.; Ban on Offshore Exploration and Production Activities in Multiple Regions.
8. Can you provide examples of recent developments in the market?
In August 2022, VideoRay, LLC, reported a large and diverse order for its Defender remotely operated vehicles (ROVs) by the United States Navy. The Navy is standardizing on VideoRay Defender Mission Specialist systems due to the superior capabilities, flexibility and upgradeability of many systems deployed since 2019. VideoRay's customer support of the Navy includes training facilities and staffing on the East Coast in Pottstown, Pennsylvania, and the West Coast in San Diego.
9. What pricing options are available for accessing the report?
Pricing options include single-user, multi-user, and enterprise licenses priced at USD 4750, USD 5250, and USD 8750 respectively.
10. Is the market size provided in terms of value or volume?
The market size is provided in terms of value, measured in Million and volume, measured in K Unit.
11. Are there any specific market keywords associated with the report?
Yes, the market keyword associated with the report is "North America ROV Market," which aids in identifying and referencing the specific market segment covered.
12. How do I determine which pricing option suits my needs best?
The pricing options vary based on user requirements and access needs. Individual users may opt for single-user licenses, while businesses requiring broader access may choose multi-user or enterprise licenses for cost-effective access to the report.
13. Are there any additional resources or data provided in the North America ROV Market report?
While the report offers comprehensive insights, it's advisable to review the specific contents or supplementary materials provided to ascertain if additional resources or data are available.
14. How can I stay updated on further developments or reports in the North America ROV Market?
To stay informed about further developments, trends, and reports in the North America ROV Market, consider subscribing to industry newsletters, following relevant companies and organizations, or regularly checking reputable industry news sources and publications.
Methodology
Step 1 - Identification of Relevant Samples Size from Population Database


Step 2 - Approaches for Defining Global Market Size (Value, Volume* & Price*)

Note*: In applicable scenarios
Step 3 - Data Sources
Primary Research
- Web Analytics
- Survey Reports
- Research Institute
- Latest Research Reports
- Opinion Leaders
Secondary Research
- Annual Reports
- White Paper
- Latest Press Release
- Industry Association
- Paid Database
- Investor Presentations

Step 4 - Data Triangulation
Involves using different sources of information in order to increase the validity of a study
These sources are likely to be stakeholders in a program - participants, other researchers, program staff, other community members, and so on.
Then we put all data in single framework & apply various statistical tools to find out the dynamic on the market.
During the analysis stage, feedback from the stakeholder groups would be compared to determine areas of agreement as well as areas of divergence
