

Key Insights
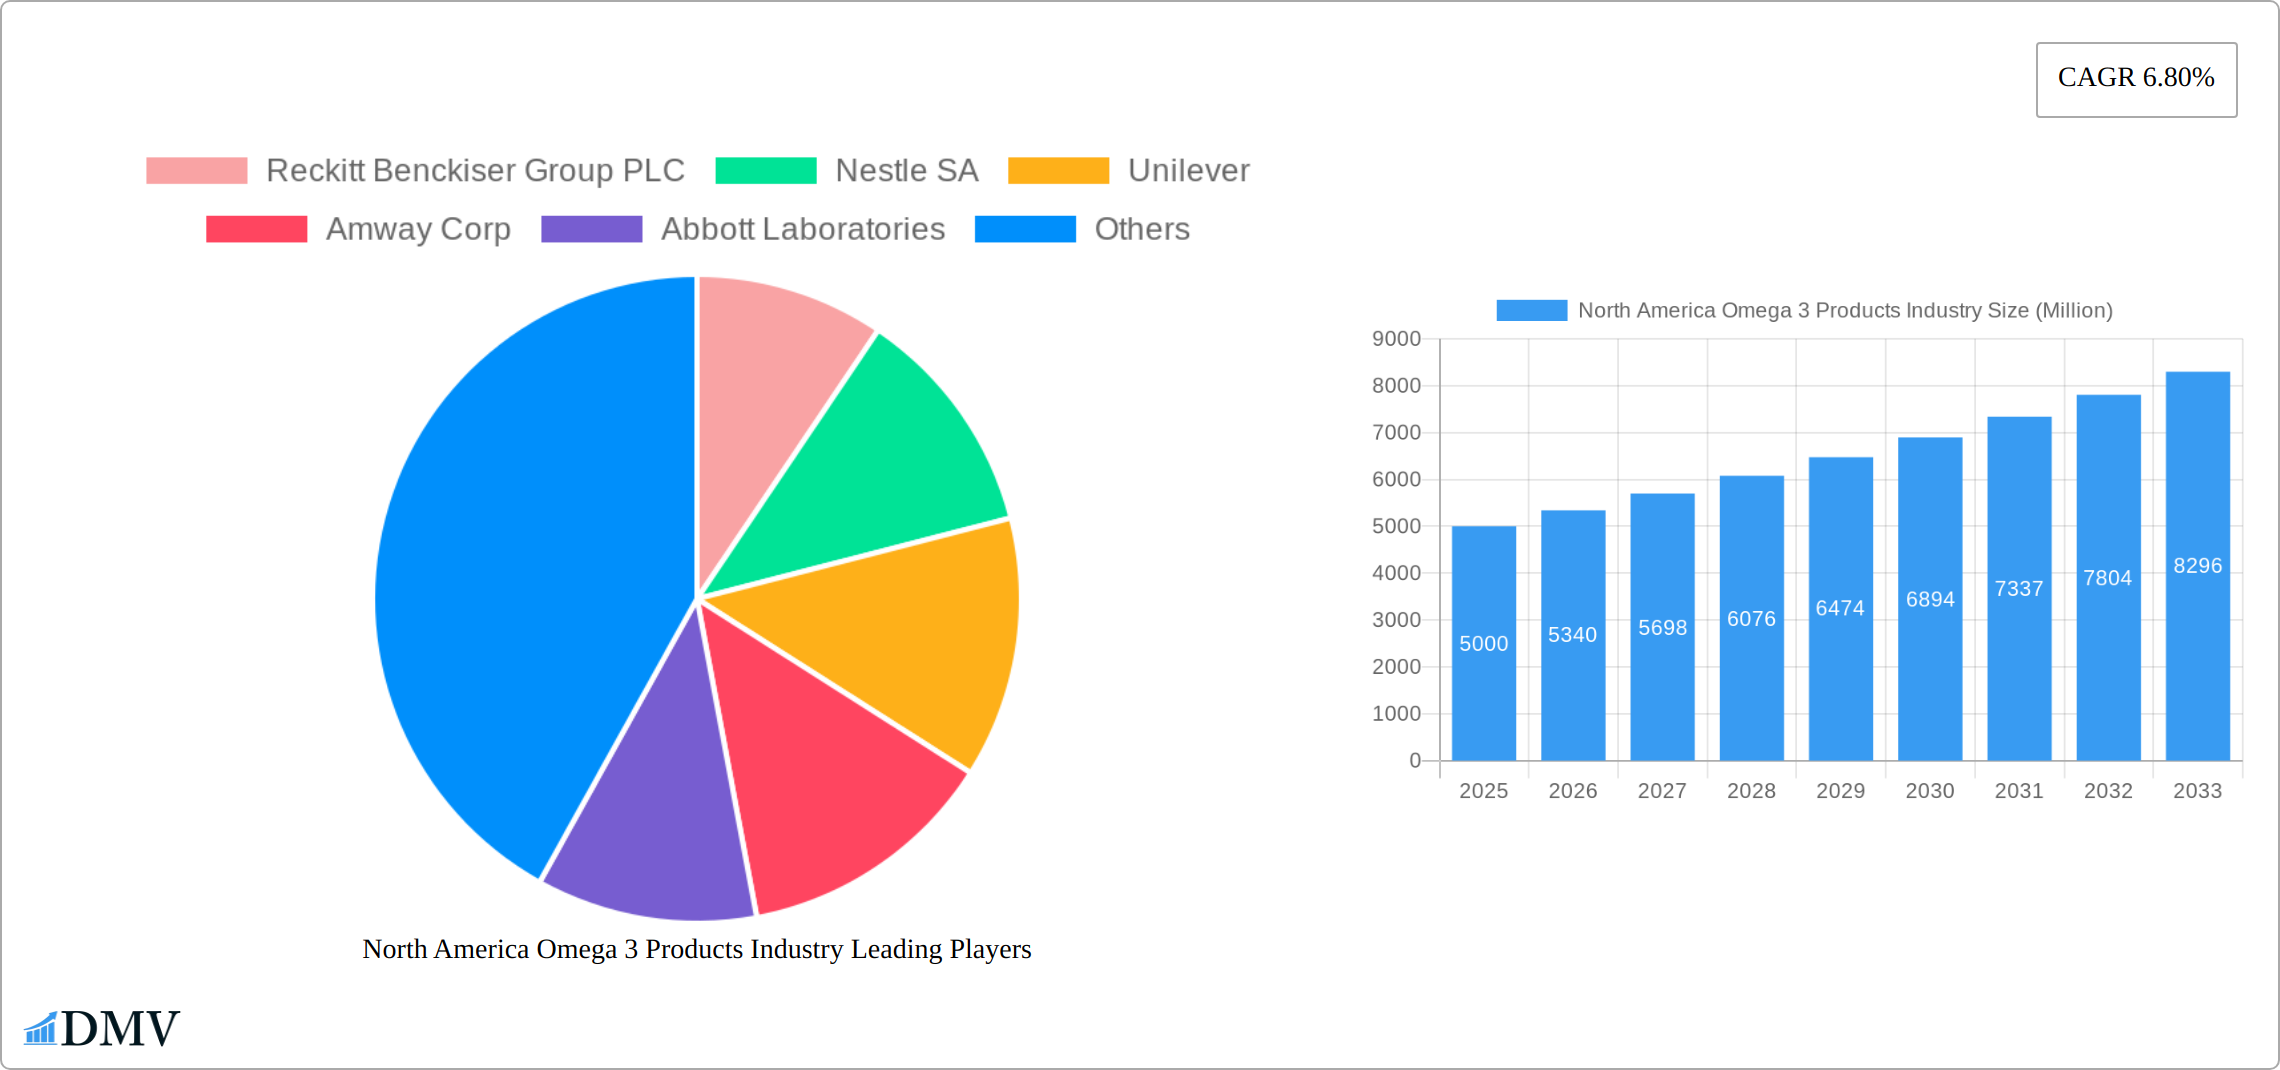
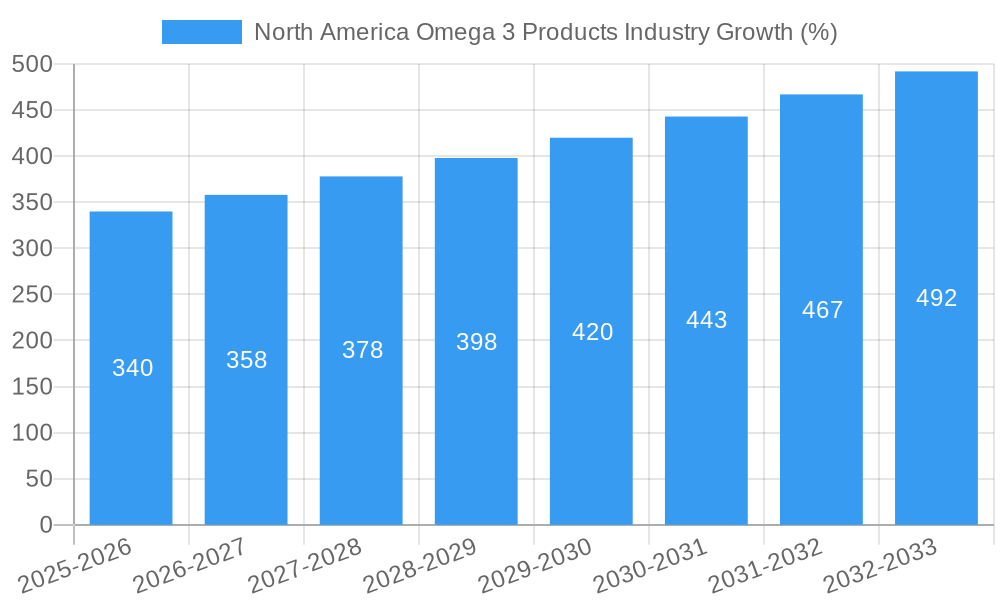
The North American omega-3 products market, valued at approximately $5 billion in 2025, is projected to experience robust growth, exhibiting a compound annual growth rate (CAGR) of 6.80% from 2025 to 2033. This expansion is fueled by several key drivers. Increasing consumer awareness of the health benefits of omega-3 fatty acids, particularly their role in cardiovascular health, brain function, and reducing inflammation, is a major catalyst. The rising prevalence of chronic diseases like heart disease and arthritis further fuels demand. The market is witnessing a significant shift towards convenient and functional food formats, such as omega-3 enriched beverages and snacks, appealing to health-conscious consumers seeking seamless integration into their lifestyles. Furthermore, the growing popularity of dietary supplements, driven by the increasing adoption of personalized nutrition plans, contributes significantly to market growth. While pricing pressures and potential fluctuations in raw material costs present some challenges, the overall market outlook remains positive, driven by sustained consumer demand and innovative product development across segments like functional foods, dietary supplements, and pet food.
The market is segmented by product type (functional foods, dietary supplements, infant nutrition, pet food and feed, pharmaceuticals) and distribution channel (grocery retailers, pharmacies and health stores, internet retailing). Dietary supplements and functional foods currently dominate the market, reflecting strong consumer preference for these delivery methods. However, significant opportunities exist within infant nutrition and pet food, driven by increasing awareness of omega-3 benefits for early childhood development and pet health. Internet retailing is a rapidly expanding distribution channel, benefiting from convenience and broad reach. Key players like Reckitt Benckiser, Nestlé, Unilever, and Abbott Laboratories are strategically leveraging their strong brand equity and distribution networks to capture market share. Geographic focus is concentrated on the United States, Canada, and Mexico, which account for the largest proportion of market value within North America, reflecting high per capita consumption and strong consumer demand.
North America Omega 3 Products Industry Market Composition & Trends
The North America Omega 3 Products Industry is witnessing a dynamic shift influenced by various factors such as market concentration, innovation catalysts, and regulatory landscapes. The market is characterized by a moderate concentration with leading companies like Reckitt Benckiser Group PLC, Nestle SA, and Unilever holding significant market shares. Innovation is propelled by a growing demand for functional foods and dietary supplements, with a focus on sustainable sourcing of omega-3 fatty acids. Regulatory frameworks in the United States and Canada are increasingly supportive, promoting transparency and quality assurance in omega-3 products.
- Market Share Distribution: The top five companies account for approximately 40% of the market share, with Reckitt Benckiser Group PLC leading at 12%.
- M&A Activities: Over the past five years, M&A deals worth over 2 Billion have reshaped the industry landscape, with notable acquisitions like Nutrigold Inc. by a major health conglomerate.
- Substitute Products: Plant-based alternatives are gaining traction, yet omega-3 from marine sources remains dominant due to its proven health benefits.
- End-User Profiles: The primary consumers are health-conscious adults aged 30-55, with a growing segment of millennials showing interest in omega-3 for cognitive health.
- Regulatory Landscape: The FDA and Health Canada have set stringent guidelines for labeling and health claims, ensuring consumer safety and trust.
North America Omega 3 Products Industry Industry Evolution
The evolution of the North America Omega 3 Products Industry from 2019 to 2033 has been marked by significant growth trajectories, technological advancements, and shifting consumer demands. Over the historical period of 2019-2024, the market grew at a compound annual growth rate (CAGR) of 6.5%, reaching a valuation of 5 Billion by 2024. This growth is attributed to increased awareness of omega-3's health benefits, particularly in preventing cardiovascular diseases and supporting brain health. Technological advancements have led to improved extraction methods and formulation techniques, allowing for higher concentrations of EPA and DHA in products. The base year of 2025 is projected to see a market size of 5.5 Billion, with a forecasted CAGR of 7% from 2025 to 2033, driven by innovations in product delivery systems such as microencapsulation.
Consumer demands have shifted towards personalized nutrition, prompting companies to offer tailored omega-3 supplements based on individual health needs. The rise of e-commerce has facilitated broader market reach, with internet retailing growing at a CAGR of 10% during the forecast period. Additionally, the integration of omega-3 into functional foods has seen a surge, with products like omega-3 fortified dairy and bakery items gaining popularity. This trend is expected to continue, with the functional food segment projected to grow at a CAGR of 8% through 2033.
Leading Regions, Countries, or Segments in North America Omega 3 Products Industry
In North America, the United States emerges as the dominant region in the Omega 3 Products Industry, driven by high consumer awareness and a robust health and wellness market. The dietary supplements segment holds the largest market share, accounting for 35% of the total market in 2025, with a projected growth rate of 7.5% through 2033.
- Key Drivers:
- Investment Trends: Significant investments in research and development, with over 1 Billion allocated annually to improve omega-3 extraction and formulation technologies.
- Regulatory Support: Favorable regulations by the FDA, including the approval of new health claims, have boosted consumer confidence and market growth.
- Consumer Health Trends: A growing focus on preventive healthcare and the rise of chronic diseases have increased demand for omega-3 products.
The dominance of the dietary supplements segment can be attributed to several factors. Firstly, the convenience and targeted health benefits of supplements appeal to a broad demographic. Secondly, the segment benefits from extensive marketing efforts and endorsements by health professionals. Additionally, the availability of a wide range of products catering to different health needs, such as heart health, cognitive function, and joint health, has solidified the segment's position. The pharmacies and health stores distribution channel also plays a crucial role, holding a 30% share in 2025, driven by the trust consumers place in these outlets for purchasing health-related products.
North America Omega 3 Products Industry Product Innovations
Recent product innovations in the North America Omega 3 Products Industry include the development of algae-based omega-3 supplements, offering a sustainable and vegan-friendly alternative to traditional fish oil. These products have shown promising performance metrics, with studies indicating comparable efficacy to marine sources. Additionally, advancements in microencapsulation technology have improved the stability and bioavailability of omega-3, enhancing its integration into various food products. These innovations not only cater to evolving consumer preferences but also address environmental concerns associated with overfishing.
Propelling Factors for North America Omega 3 Products Industry Growth
Several key factors are driving the growth of the North America Omega 3 Products Industry. Technologically, advancements in extraction and formulation techniques have led to higher quality and more effective products. Economically, rising disposable incomes and increased health expenditure are boosting demand. Regulatory influences, such as the FDA's approval of new health claims, have also played a significant role in market expansion. For instance, the introduction of omega-3 fortified foods has seen a surge due to consumer interest in functional nutrition.
Obstacles in the North America Omega 3 Products Industry Market
The North America Omega 3 Products Industry faces several obstacles. Regulatory challenges, such as stringent labeling requirements, can hinder market entry for new players. Supply chain disruptions, particularly related to sourcing sustainable fish oil, pose significant risks. Competitive pressures are intense, with major players like Nestle SA and Unilever continuously innovating to maintain market share. These factors have quantifiable impacts, with supply chain issues alone estimated to cost the industry up to 500 Million annually.
Future Opportunities in North America Omega 3 Products Industry
Emerging opportunities in the North America Omega 3 Products Industry include the expansion into new markets like pet nutrition, where omega-3 supplements for pets are gaining popularity. Technological advancements, such as the development of personalized nutrition solutions, offer potential for growth. Additionally, shifting consumer trends towards plant-based diets are driving demand for algae-based omega-3 products, presenting a significant opportunity for market expansion.
Major Players in the North America Omega 3 Products Industry Ecosystem
- Reckitt Benckiser Group PLC
- Nestle SA
- Unilever
- Amway Corp
- Abbott Laboratories
- Herbalife Nutrition
- Nutrigold Inc.
- GNC
Key Developments in North America Omega 3 Products Industry Industry
- January 2023: Nestle SA launched a new line of omega-3 fortified dairy products, enhancing its presence in the functional food segment.
- March 2024: Unilever acquired a leading algae-based omega-3 producer, expanding its portfolio of sustainable products.
- June 2025: Abbott Laboratories introduced a new omega-3 supplement specifically designed for cognitive health, targeting the aging population.
Strategic North America Omega 3 Products Industry Market Forecast
The strategic forecast for the North America Omega 3 Products Industry highlights significant growth potential through 2033. Key catalysts include the continued rise in health consciousness, technological innovations in product delivery, and the expansion into new market segments like pet nutrition. The industry is poised to capitalize on emerging opportunities, particularly in personalized nutrition and sustainable sourcing, positioning it for robust growth in the coming years.
North America Omega 3 Products Industry Segmentation
-
1. Product Type
- 1.1. Functional Food
- 1.2. Dietary Supplements
- 1.3. Infant Nutrition
- 1.4. Pet Food and Feed
- 1.5. Pharmaceuticals
-
2. Distribution Channel
- 2.1. Grocery Retailers
- 2.2. Pharmacies and Health Stores
- 2.3. Internet Retailing
- 2.4. Other Distribution Channels
-
3. Geography
-
3.1. North America
- 3.1.1. United States
- 3.1.2. Canada
- 3.1.3. Mexico
- 3.1.4. Rest of North America
-
3.1. North America
North America Omega 3 Products Industry Segmentation By Geography
-
1. North America
- 1.1. United States
- 1.2. Canada
- 1.3. Mexico
- 1.4. Rest of North America

North America Omega 3 Products Industry REPORT HIGHLIGHTS
| Aspects | Details |
|---|---|
| Study Period | 2019-2033 |
| Base Year | 2024 |
| Estimated Year | 2025 |
| Forecast Period | 2025-2033 |
| Historical Period | 2019-2024 |
| Growth Rate | CAGR of 6.80% from 2019-2033 |
| Segmentation |
|
Table of Contents
- 1. Introduction
- 1.1. Research Scope
- 1.2. Market Segmentation
- 1.3. Research Methodology
- 1.4. Definitions and Assumptions
- 2. Executive Summary
- 2.1. Introduction
- 3. Market Dynamics
- 3.1. Introduction
- 3.2. Market Drivers
- 3.2.1. Increasing awareness of the health benefits of Omega-3 fatty acids; Rising Prevalence of Chronic Diseases
- 3.3. Market Restrains
- 3.3.1. Omega-3 supplements can be expensive compared to other nutritional products
- 3.4. Market Trends
- 3.4.1. Growing interest in plant-based diets and veganism is driving demand for plant-derived Omega-3 sources
- 4. Market Factor Analysis
- 4.1. Porters Five Forces
- 4.2. Supply/Value Chain
- 4.3. PESTEL analysis
- 4.4. Market Entropy
- 4.5. Patent/Trademark Analysis
- 5. North America Omega 3 Products Industry Analysis, Insights and Forecast, 2019-2031
- 5.1. Market Analysis, Insights and Forecast - by Product Type
- 5.1.1. Functional Food
- 5.1.2. Dietary Supplements
- 5.1.3. Infant Nutrition
- 5.1.4. Pet Food and Feed
- 5.1.5. Pharmaceuticals
- 5.2. Market Analysis, Insights and Forecast - by Distribution Channel
- 5.2.1. Grocery Retailers
- 5.2.2. Pharmacies and Health Stores
- 5.2.3. Internet Retailing
- 5.2.4. Other Distribution Channels
- 5.3. Market Analysis, Insights and Forecast - by Geography
- 5.3.1. North America
- 5.3.1.1. United States
- 5.3.1.2. Canada
- 5.3.1.3. Mexico
- 5.3.1.4. Rest of North America
- 5.3.1. North America
- 5.4. Market Analysis, Insights and Forecast - by Region
- 5.4.1. North America
- 5.1. Market Analysis, Insights and Forecast - by Product Type
- 6. United States North America Omega 3 Products Industry Analysis, Insights and Forecast, 2019-2031
- 7. Canada North America Omega 3 Products Industry Analysis, Insights and Forecast, 2019-2031
- 8. Mexico North America Omega 3 Products Industry Analysis, Insights and Forecast, 2019-2031
- 9. Rest of North America North America Omega 3 Products Industry Analysis, Insights and Forecast, 2019-2031
- 10. Competitive Analysis
- 10.1. Market Share Analysis 2024
- 10.2. Company Profiles
- 10.2.1 Reckitt Benckiser Group PLC
- 10.2.1.1. Overview
- 10.2.1.2. Products
- 10.2.1.3. SWOT Analysis
- 10.2.1.4. Recent Developments
- 10.2.1.5. Financials (Based on Availability)
- 10.2.2 Nestle SA
- 10.2.2.1. Overview
- 10.2.2.2. Products
- 10.2.2.3. SWOT Analysis
- 10.2.2.4. Recent Developments
- 10.2.2.5. Financials (Based on Availability)
- 10.2.3 Unilever
- 10.2.3.1. Overview
- 10.2.3.2. Products
- 10.2.3.3. SWOT Analysis
- 10.2.3.4. Recent Developments
- 10.2.3.5. Financials (Based on Availability)
- 10.2.4 Amway Corp
- 10.2.4.1. Overview
- 10.2.4.2. Products
- 10.2.4.3. SWOT Analysis
- 10.2.4.4. Recent Developments
- 10.2.4.5. Financials (Based on Availability)
- 10.2.5 Abbott Laboratories
- 10.2.5.1. Overview
- 10.2.5.2. Products
- 10.2.5.3. SWOT Analysis
- 10.2.5.4. Recent Developments
- 10.2.5.5. Financials (Based on Availability)
- 10.2.6 Herbalife Nutrition
- 10.2.6.1. Overview
- 10.2.6.2. Products
- 10.2.6.3. SWOT Analysis
- 10.2.6.4. Recent Developments
- 10.2.6.5. Financials (Based on Availability)
- 10.2.7 Nutrigold Inc.
- 10.2.7.1. Overview
- 10.2.7.2. Products
- 10.2.7.3. SWOT Analysis
- 10.2.7.4. Recent Developments
- 10.2.7.5. Financials (Based on Availability)
- 10.2.8 GNC
- 10.2.8.1. Overview
- 10.2.8.2. Products
- 10.2.8.3. SWOT Analysis
- 10.2.8.4. Recent Developments
- 10.2.8.5. Financials (Based on Availability)
- 10.2.1 Reckitt Benckiser Group PLC
List of Figures
- Figure 1: North America Omega 3 Products Industry Revenue Breakdown (Million, %) by Product 2024 & 2032
- Figure 2: North America Omega 3 Products Industry Share (%) by Company 2024
List of Tables
- Table 1: North America Omega 3 Products Industry Revenue Million Forecast, by Region 2019 & 2032
- Table 2: North America Omega 3 Products Industry Revenue Million Forecast, by Product Type 2019 & 2032
- Table 3: North America Omega 3 Products Industry Revenue Million Forecast, by Distribution Channel 2019 & 2032
- Table 4: North America Omega 3 Products Industry Revenue Million Forecast, by Geography 2019 & 2032
- Table 5: North America Omega 3 Products Industry Revenue Million Forecast, by Region 2019 & 2032
- Table 6: North America Omega 3 Products Industry Revenue Million Forecast, by Country 2019 & 2032
- Table 7: United States North America Omega 3 Products Industry Revenue (Million) Forecast, by Application 2019 & 2032
- Table 8: Canada North America Omega 3 Products Industry Revenue (Million) Forecast, by Application 2019 & 2032
- Table 9: Mexico North America Omega 3 Products Industry Revenue (Million) Forecast, by Application 2019 & 2032
- Table 10: Rest of North America North America Omega 3 Products Industry Revenue (Million) Forecast, by Application 2019 & 2032
- Table 11: North America Omega 3 Products Industry Revenue Million Forecast, by Product Type 2019 & 2032
- Table 12: North America Omega 3 Products Industry Revenue Million Forecast, by Distribution Channel 2019 & 2032
- Table 13: North America Omega 3 Products Industry Revenue Million Forecast, by Geography 2019 & 2032
- Table 14: North America Omega 3 Products Industry Revenue Million Forecast, by Country 2019 & 2032
- Table 15: United States North America Omega 3 Products Industry Revenue (Million) Forecast, by Application 2019 & 2032
- Table 16: Canada North America Omega 3 Products Industry Revenue (Million) Forecast, by Application 2019 & 2032
- Table 17: Mexico North America Omega 3 Products Industry Revenue (Million) Forecast, by Application 2019 & 2032
- Table 18: Rest of North America North America Omega 3 Products Industry Revenue (Million) Forecast, by Application 2019 & 2032
Frequently Asked Questions
1. What is the projected Compound Annual Growth Rate (CAGR) of the North America Omega 3 Products Industry?
The projected CAGR is approximately 6.80%.
2. Which companies are prominent players in the North America Omega 3 Products Industry?
Key companies in the market include Reckitt Benckiser Group PLC, Nestle SA, Unilever, Amway Corp, Abbott Laboratories, Herbalife Nutrition, Nutrigold Inc., GNC.
3. What are the main segments of the North America Omega 3 Products Industry?
The market segments include Product Type, Distribution Channel, Geography.
4. Can you provide details about the market size?
The market size is estimated to be USD XX Million as of 2022.
5. What are some drivers contributing to market growth?
Increasing awareness of the health benefits of Omega-3 fatty acids; Rising Prevalence of Chronic Diseases.
6. What are the notable trends driving market growth?
Growing interest in plant-based diets and veganism is driving demand for plant-derived Omega-3 sources.
7. Are there any restraints impacting market growth?
Omega-3 supplements can be expensive compared to other nutritional products.
8. Can you provide examples of recent developments in the market?
N/A
9. What pricing options are available for accessing the report?
Pricing options include single-user, multi-user, and enterprise licenses priced at USD 4750, USD 5250, and USD 8750 respectively.
10. Is the market size provided in terms of value or volume?
The market size is provided in terms of value, measured in Million.
11. Are there any specific market keywords associated with the report?
Yes, the market keyword associated with the report is "North America Omega 3 Products Industry," which aids in identifying and referencing the specific market segment covered.
12. How do I determine which pricing option suits my needs best?
The pricing options vary based on user requirements and access needs. Individual users may opt for single-user licenses, while businesses requiring broader access may choose multi-user or enterprise licenses for cost-effective access to the report.
13. Are there any additional resources or data provided in the North America Omega 3 Products Industry report?
While the report offers comprehensive insights, it's advisable to review the specific contents or supplementary materials provided to ascertain if additional resources or data are available.
14. How can I stay updated on further developments or reports in the North America Omega 3 Products Industry?
To stay informed about further developments, trends, and reports in the North America Omega 3 Products Industry, consider subscribing to industry newsletters, following relevant companies and organizations, or regularly checking reputable industry news sources and publications.
Methodology
Step 1 - Identification of Relevant Samples Size from Population Database


Step 2 - Approaches for Defining Global Market Size (Value, Volume* & Price*)

Note*: In applicable scenarios
Step 3 - Data Sources
Primary Research
- Web Analytics
- Survey Reports
- Research Institute
- Latest Research Reports
- Opinion Leaders
Secondary Research
- Annual Reports
- White Paper
- Latest Press Release
- Industry Association
- Paid Database
- Investor Presentations

Step 4 - Data Triangulation
Involves using different sources of information in order to increase the validity of a study
These sources are likely to be stakeholders in a program - participants, other researchers, program staff, other community members, and so on.
Then we put all data in single framework & apply various statistical tools to find out the dynamic on the market.
During the analysis stage, feedback from the stakeholder groups would be compared to determine areas of agreement as well as areas of divergence
