

Key Insights
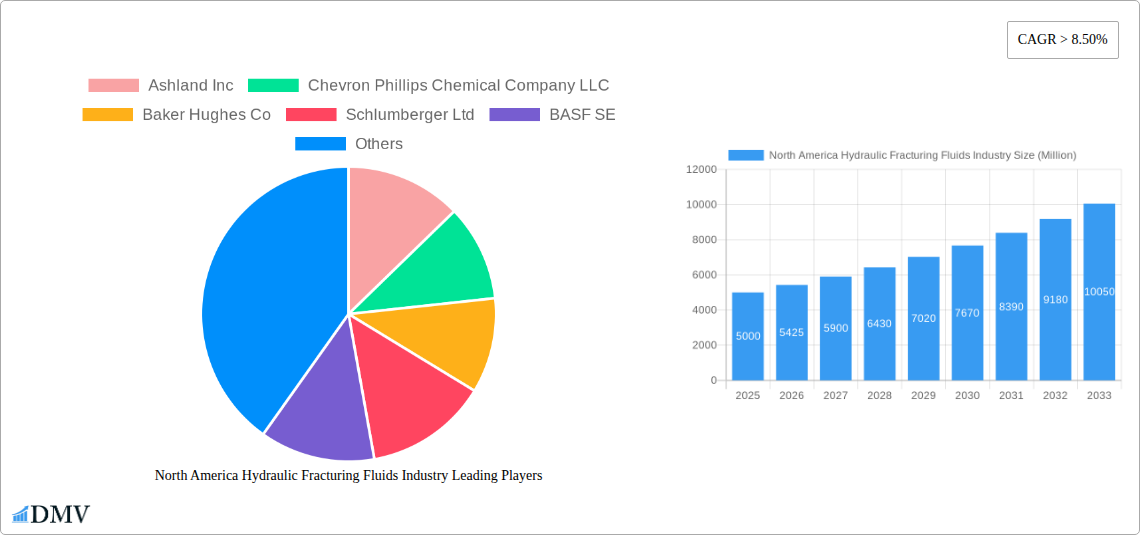
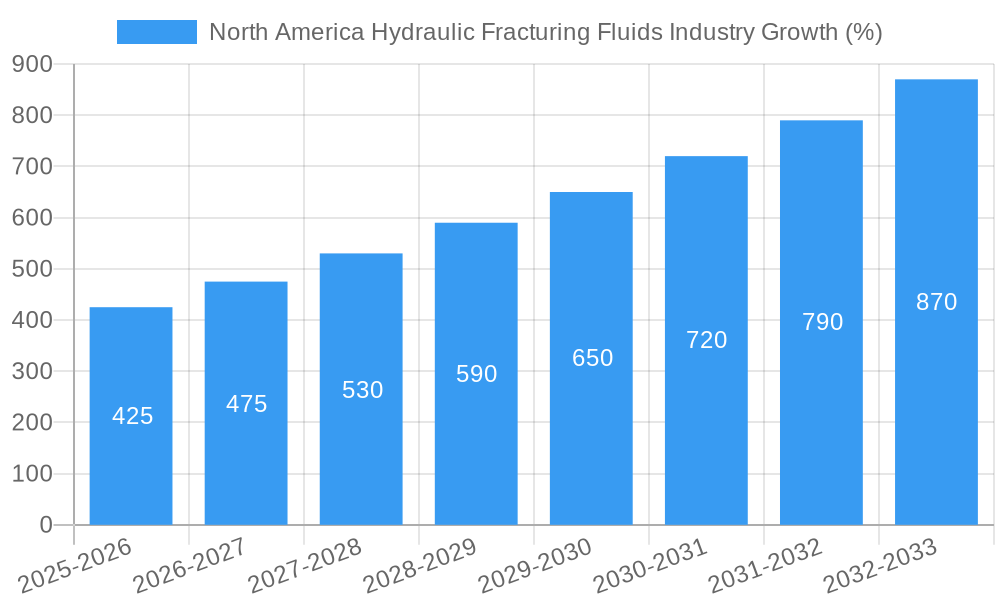
The North American hydraulic fracturing fluids market, valued at approximately $5 billion in 2025, is projected to experience robust growth, exhibiting a Compound Annual Growth Rate (CAGR) exceeding 8.5% from 2025 to 2033. This expansion is fueled by several key factors. The ongoing surge in shale gas and oil extraction within the United States and Canada, driven by sustained energy demand and geopolitical factors, is a primary driver. Technological advancements in fracturing fluid formulations, leading to improved efficiency and reduced environmental impact (e.g., the increased adoption of slickwater-based fluids), further contribute to market growth. The increasing focus on horizontal drilling techniques, offering greater reach and extraction potential, also boosts demand for these specialized fluids. While regulatory scrutiny regarding environmental concerns and potential water usage constraints represent potential restraints, the overall market outlook remains positive, driven by the persistent need for efficient hydrocarbon extraction.
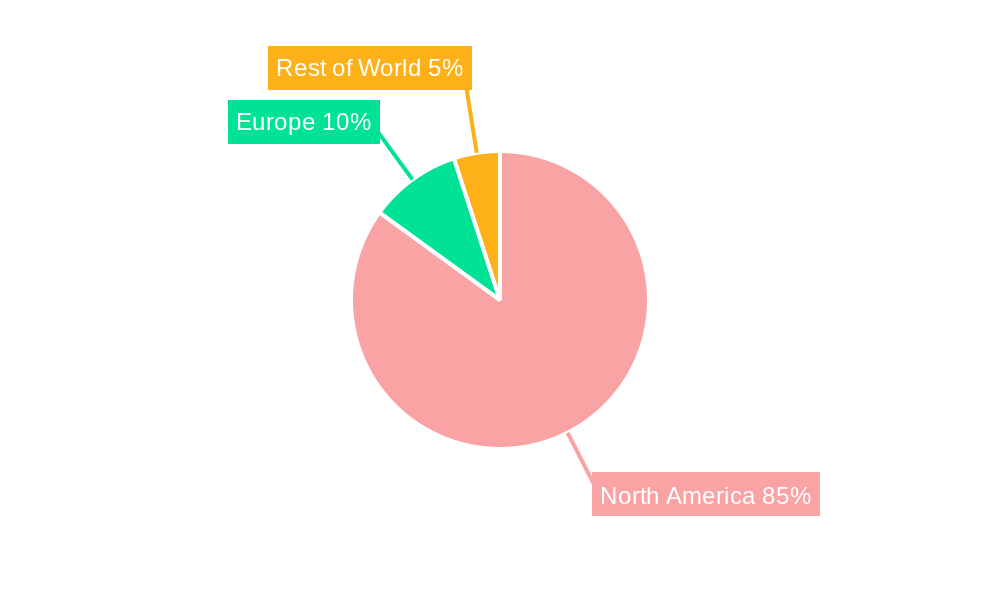
Market segmentation reveals a significant preference for slickwater-based fluids due to their cost-effectiveness and relatively lower environmental footprint compared to oil-based alternatives. Horizontal well drilling constitutes a larger segment compared to vertical drilling, reflecting industry trends towards enhanced extraction techniques. Key players like Ashland Inc, Chevron Phillips Chemical Company LLC, Baker Hughes, Schlumberger, and Halliburton are actively investing in research and development, striving for innovative fluid formulations and service offerings to maintain their competitive edge in this dynamic market. Regional analysis indicates the United States as the dominant market within North America, benefiting from its extensive shale reserves and robust oil and gas production infrastructure. The Canadian market also contributes significantly, although to a lesser extent than the U.S., reflecting its own considerable energy sector activities. The forecast period anticipates consistent growth, with the market potentially exceeding $10 billion by 2033, driven by the factors outlined above and assuming continued energy demand and exploration activity.
North America Hydraulic Fracturing Fluids Industry: A Comprehensive Market Report (2019-2033)
This insightful report provides a deep dive into the North America hydraulic fracturing fluids market, offering a comprehensive analysis of market trends, competitive dynamics, and future growth prospects from 2019 to 2033. The study covers key segments, including well type (horizontal and vertical), fluid type (slick water-based fluid, foam-based fluid, gelled oil-based fluid, and other base fluids), and major players like Ashland Inc, Chevron Phillips Chemical Company LLC, Baker Hughes Co, Schlumberger Ltd, BASF SE, DuPont de Nemours Inc, Halliburton Company, Akzonobel NV, Clariant International Ltd, and Calfrac Well Services Ltd. The report utilizes data from the historical period (2019-2024), the base year (2025), and the estimated year (2025) to forecast market trends from 2025 to 2033. The total market size in 2025 is estimated at $XX Million.
North America Hydraulic Fracturing Fluids Industry Market Composition & Trends
This section analyzes the competitive landscape, innovation drivers, regulatory environment, and market dynamics of the North American hydraulic fracturing fluids market. The market exhibits a moderately concentrated structure with the top five players holding an estimated XX% market share in 2025.
- Market Concentration: Top 5 players hold approximately XX% of the market share in 2025.
- Innovation Catalysts: Increased demand for environmentally friendly fluids and advancements in fluid chemistry are driving innovation.
- Regulatory Landscape: Stringent environmental regulations are shaping product development and operational practices. The anticipated impact of new regulations is expected to cause a XX% shift in market share by 2033.
- Substitute Products: The emergence of alternative fracturing technologies presents a moderate competitive threat.
- End-User Profiles: The primary end-users are oil and gas exploration and production companies.
- M&A Activities: Significant M&A activity, with deal values totaling approximately $XX Million in the last five years, is reshaping the competitive landscape. The average deal value is estimated at $XX Million.
North America Hydraulic Fracturing Fluids Industry Industry Evolution
The North America hydraulic fracturing fluids market has experienced significant growth fueled by the shale gas revolution. From 2019 to 2024, the market expanded at a CAGR of XX%, reaching $XX Million in 2024. The forecast period (2025-2033) projects a CAGR of XX%, driven by increasing oil and gas production and technological advancements in hydraulic fracturing techniques. The adoption rate of environmentally friendly fluids is expected to increase by XX% annually. The shift towards horizontal drilling has significantly influenced fluid demand, contributing to XX% of the overall market growth from 2019-2024. This trend is projected to continue, with horizontal drilling accounting for XX% of the market by 2033. Technological advancements in fluid formulations and delivery systems are driving efficiency gains and cost reductions. Consumer demand for sustainable and cost-effective solutions will continue to drive market evolution.
Leading Regions, Countries, or Segments in North America Hydraulic Fracturing Fluids Industry
The Permian Basin in Texas and New Mexico remains the dominant region, driven by extensive shale gas production and substantial investments in hydraulic fracturing activities.
Key Drivers for the Permian Basin Dominance:
- High concentration of shale gas reserves.
- Significant investments in exploration and production.
- Supportive regulatory environment.
Segment Analysis:
- Well Type: Horizontal drilling accounts for a larger market share (XX%) than vertical drilling (XX%). This disparity is fueled by higher productivity and efficiency in horizontal drilling.
- Fluid Type: Slick water-based fluids dominate the market with a share of XX% due to their cost-effectiveness and wide applicability. However, increasing environmental concerns are fostering growth in the other base fluids segment, projected to grow at a CAGR of XX% during the forecast period.
The dominance of the Permian Basin is reinforced by the high concentration of both horizontal drilling operations and usage of slick water-based fluids. The continuous growth within this region is further supported by sustained investments in exploration and production, and favorable regulatory frameworks.
North America Hydraulic Fracturing Fluids Industry Product Innovations
Recent innovations include the development of environmentally friendly fluids with reduced toxicity and improved biodegradability, enhanced fluid rheology for improved proppant placement, and specialized fluids tailored to specific geological formations. These advancements enhance operational efficiency, reduce environmental impact, and improve the overall economics of shale gas extraction.
Propelling Factors for North America Hydraulic Fracturing Fluids Industry Growth
Several factors drive the industry's growth: the increasing demand for oil and gas, advancements in hydraulic fracturing technologies leading to improved efficiency and cost reductions, and government support for energy independence initiatives. Technological improvements are reducing the environmental impact of fracturing operations, further propelling market expansion.
Obstacles in the North America Hydraulic Fracturing Fluids Industry Market
The industry faces challenges including stringent environmental regulations leading to increased compliance costs, supply chain disruptions affecting raw material availability and pricing, and intense competition among fluid providers. Fluctuations in oil and gas prices also impact demand and investment decisions.
Future Opportunities in North America Hydraulic Fracturing Fluids Industry
Emerging opportunities lie in developing innovative fluids for unconventional reservoirs, expanding into new geographic regions, and focusing on sustainable and environmentally friendly solutions. Furthermore, technological innovations aimed at enhancing efficiency and reducing operational costs hold significant promise.
Major Players in the North America Hydraulic Fracturing Fluids Industry Ecosystem
- Ashland Inc
- Chevron Phillips Chemical Company LLC
- Baker Hughes Co
- Schlumberger Ltd
- BASF SE
- DuPont de Nemours Inc
- Halliburton Company
- Akzonobel NV
- Clariant International Ltd
- Calfrac Well Services Ltd
Key Developments in North America Hydraulic Fracturing Fluids Industry Industry
- 2022 Q4: Ashland Inc. launched a new line of environmentally friendly fracturing fluids.
- 2023 Q1: Baker Hughes Co. and Schlumberger Ltd. announced a joint venture to develop advanced fracturing technologies.
- 2023 Q3: Chevron Phillips Chemical Company LLC invested in expanding its production capacity for key fluid components. (Further specific developments with dates to be added based on available data)
Strategic North America Hydraulic Fracturing Fluids Industry Market Forecast
The North America hydraulic fracturing fluids market is poised for sustained growth over the forecast period (2025-2033), driven by ongoing investments in oil and gas exploration, technological advancements, and increasing demand for energy. The market's expansion will be further bolstered by the continuous adoption of more efficient and environmentally conscious fracturing solutions. The focus on improving operational efficiency and reducing environmental footprints will likely shape future market developments.
North America Hydraulic Fracturing Fluids Industry Segmentation
-
1. Well Type
- 1.1. Horizontal
- 1.2. Vertical
-
2. Fluid Type
- 2.1. Slick Water-based Fluid
- 2.2. Foam-based Fluid
- 2.3. Gelled Oil-based Fluid
- 2.4. Other Base Fluids
-
3. Geography
- 3.1. United States
- 3.2. Canada
- 3.3. Rest of North America
North America Hydraulic Fracturing Fluids Industry Segmentation By Geography
- 1. United States
- 2. Canada
- 3. Rest of North America
North America Hydraulic Fracturing Fluids Industry REPORT HIGHLIGHTS
| Aspects | Details |
|---|---|
| Study Period | 2019-2033 |
| Base Year | 2024 |
| Estimated Year | 2025 |
| Forecast Period | 2025-2033 |
| Historical Period | 2019-2024 |
| Growth Rate | CAGR of > 8.50% from 2019-2033 |
| Segmentation |
|
Table of Contents
- 1. Introduction
- 1.1. Research Scope
- 1.2. Market Segmentation
- 1.3. Research Methodology
- 1.4. Definitions and Assumptions
- 2. Executive Summary
- 2.1. Introduction
- 3. Market Dynamics
- 3.1. Introduction
- 3.2. Market Drivers
- 3.2.1. 4.; Presence of Strict Government Regulations to Control Air Pollution
- 3.3. Market Restrains
- 3.3.1. 4.; Increasing Adoption of Renewable Energy
- 3.4. Market Trends
- 3.4.1. Horizontal Wells to Dominate the Market
- 4. Market Factor Analysis
- 4.1. Porters Five Forces
- 4.2. Supply/Value Chain
- 4.3. PESTEL analysis
- 4.4. Market Entropy
- 4.5. Patent/Trademark Analysis
- 5. North America Hydraulic Fracturing Fluids Industry Analysis, Insights and Forecast, 2019-2031
- 5.1. Market Analysis, Insights and Forecast - by Well Type
- 5.1.1. Horizontal
- 5.1.2. Vertical
- 5.2. Market Analysis, Insights and Forecast - by Fluid Type
- 5.2.1. Slick Water-based Fluid
- 5.2.2. Foam-based Fluid
- 5.2.3. Gelled Oil-based Fluid
- 5.2.4. Other Base Fluids
- 5.3. Market Analysis, Insights and Forecast - by Geography
- 5.3.1. United States
- 5.3.2. Canada
- 5.3.3. Rest of North America
- 5.4. Market Analysis, Insights and Forecast - by Region
- 5.4.1. United States
- 5.4.2. Canada
- 5.4.3. Rest of North America
- 5.1. Market Analysis, Insights and Forecast - by Well Type
- 6. United States North America Hydraulic Fracturing Fluids Industry Analysis, Insights and Forecast, 2019-2031
- 6.1. Market Analysis, Insights and Forecast - by Well Type
- 6.1.1. Horizontal
- 6.1.2. Vertical
- 6.2. Market Analysis, Insights and Forecast - by Fluid Type
- 6.2.1. Slick Water-based Fluid
- 6.2.2. Foam-based Fluid
- 6.2.3. Gelled Oil-based Fluid
- 6.2.4. Other Base Fluids
- 6.3. Market Analysis, Insights and Forecast - by Geography
- 6.3.1. United States
- 6.3.2. Canada
- 6.3.3. Rest of North America
- 6.1. Market Analysis, Insights and Forecast - by Well Type
- 7. Canada North America Hydraulic Fracturing Fluids Industry Analysis, Insights and Forecast, 2019-2031
- 7.1. Market Analysis, Insights and Forecast - by Well Type
- 7.1.1. Horizontal
- 7.1.2. Vertical
- 7.2. Market Analysis, Insights and Forecast - by Fluid Type
- 7.2.1. Slick Water-based Fluid
- 7.2.2. Foam-based Fluid
- 7.2.3. Gelled Oil-based Fluid
- 7.2.4. Other Base Fluids
- 7.3. Market Analysis, Insights and Forecast - by Geography
- 7.3.1. United States
- 7.3.2. Canada
- 7.3.3. Rest of North America
- 7.1. Market Analysis, Insights and Forecast - by Well Type
- 8. Rest of North America North America Hydraulic Fracturing Fluids Industry Analysis, Insights and Forecast, 2019-2031
- 8.1. Market Analysis, Insights and Forecast - by Well Type
- 8.1.1. Horizontal
- 8.1.2. Vertical
- 8.2. Market Analysis, Insights and Forecast - by Fluid Type
- 8.2.1. Slick Water-based Fluid
- 8.2.2. Foam-based Fluid
- 8.2.3. Gelled Oil-based Fluid
- 8.2.4. Other Base Fluids
- 8.3. Market Analysis, Insights and Forecast - by Geography
- 8.3.1. United States
- 8.3.2. Canada
- 8.3.3. Rest of North America
- 8.1. Market Analysis, Insights and Forecast - by Well Type
- 9. United States North America Hydraulic Fracturing Fluids Industry Analysis, Insights and Forecast, 2019-2031
- 10. Canada North America Hydraulic Fracturing Fluids Industry Analysis, Insights and Forecast, 2019-2031
- 11. Mexico North America Hydraulic Fracturing Fluids Industry Analysis, Insights and Forecast, 2019-2031
- 12. Rest of North America North America Hydraulic Fracturing Fluids Industry Analysis, Insights and Forecast, 2019-2031
- 13. Competitive Analysis
- 13.1. Market Share Analysis 2024
- 13.2. Company Profiles
- 13.2.1 Ashland Inc
- 13.2.1.1. Overview
- 13.2.1.2. Products
- 13.2.1.3. SWOT Analysis
- 13.2.1.4. Recent Developments
- 13.2.1.5. Financials (Based on Availability)
- 13.2.2 Chevron Phillips Chemical Company LLC
- 13.2.2.1. Overview
- 13.2.2.2. Products
- 13.2.2.3. SWOT Analysis
- 13.2.2.4. Recent Developments
- 13.2.2.5. Financials (Based on Availability)
- 13.2.3 Baker Hughes Co
- 13.2.3.1. Overview
- 13.2.3.2. Products
- 13.2.3.3. SWOT Analysis
- 13.2.3.4. Recent Developments
- 13.2.3.5. Financials (Based on Availability)
- 13.2.4 Schlumberger Ltd
- 13.2.4.1. Overview
- 13.2.4.2. Products
- 13.2.4.3. SWOT Analysis
- 13.2.4.4. Recent Developments
- 13.2.4.5. Financials (Based on Availability)
- 13.2.5 BASF SE
- 13.2.5.1. Overview
- 13.2.5.2. Products
- 13.2.5.3. SWOT Analysis
- 13.2.5.4. Recent Developments
- 13.2.5.5. Financials (Based on Availability)
- 13.2.6 DuPont de Nemours Inc *List Not Exhaustive
- 13.2.6.1. Overview
- 13.2.6.2. Products
- 13.2.6.3. SWOT Analysis
- 13.2.6.4. Recent Developments
- 13.2.6.5. Financials (Based on Availability)
- 13.2.7 Halliburton Company
- 13.2.7.1. Overview
- 13.2.7.2. Products
- 13.2.7.3. SWOT Analysis
- 13.2.7.4. Recent Developments
- 13.2.7.5. Financials (Based on Availability)
- 13.2.8 Akzonobel NV
- 13.2.8.1. Overview
- 13.2.8.2. Products
- 13.2.8.3. SWOT Analysis
- 13.2.8.4. Recent Developments
- 13.2.8.5. Financials (Based on Availability)
- 13.2.9 Clariant International Ltd
- 13.2.9.1. Overview
- 13.2.9.2. Products
- 13.2.9.3. SWOT Analysis
- 13.2.9.4. Recent Developments
- 13.2.9.5. Financials (Based on Availability)
- 13.2.10 Calfrac Well Services Ltd
- 13.2.10.1. Overview
- 13.2.10.2. Products
- 13.2.10.3. SWOT Analysis
- 13.2.10.4. Recent Developments
- 13.2.10.5. Financials (Based on Availability)
- 13.2.1 Ashland Inc
List of Figures
- Figure 1: North America Hydraulic Fracturing Fluids Industry Revenue Breakdown (Million, %) by Product 2024 & 2032
- Figure 2: North America Hydraulic Fracturing Fluids Industry Share (%) by Company 2024
List of Tables
- Table 1: North America Hydraulic Fracturing Fluids Industry Revenue Million Forecast, by Region 2019 & 2032
- Table 2: North America Hydraulic Fracturing Fluids Industry Revenue Million Forecast, by Well Type 2019 & 2032
- Table 3: North America Hydraulic Fracturing Fluids Industry Revenue Million Forecast, by Fluid Type 2019 & 2032
- Table 4: North America Hydraulic Fracturing Fluids Industry Revenue Million Forecast, by Geography 2019 & 2032
- Table 5: North America Hydraulic Fracturing Fluids Industry Revenue Million Forecast, by Region 2019 & 2032
- Table 6: North America Hydraulic Fracturing Fluids Industry Revenue Million Forecast, by Country 2019 & 2032
- Table 7: United States North America Hydraulic Fracturing Fluids Industry Revenue (Million) Forecast, by Application 2019 & 2032
- Table 8: Canada North America Hydraulic Fracturing Fluids Industry Revenue (Million) Forecast, by Application 2019 & 2032
- Table 9: Mexico North America Hydraulic Fracturing Fluids Industry Revenue (Million) Forecast, by Application 2019 & 2032
- Table 10: Rest of North America North America Hydraulic Fracturing Fluids Industry Revenue (Million) Forecast, by Application 2019 & 2032
- Table 11: North America Hydraulic Fracturing Fluids Industry Revenue Million Forecast, by Well Type 2019 & 2032
- Table 12: North America Hydraulic Fracturing Fluids Industry Revenue Million Forecast, by Fluid Type 2019 & 2032
- Table 13: North America Hydraulic Fracturing Fluids Industry Revenue Million Forecast, by Geography 2019 & 2032
- Table 14: North America Hydraulic Fracturing Fluids Industry Revenue Million Forecast, by Country 2019 & 2032
- Table 15: North America Hydraulic Fracturing Fluids Industry Revenue Million Forecast, by Well Type 2019 & 2032
- Table 16: North America Hydraulic Fracturing Fluids Industry Revenue Million Forecast, by Fluid Type 2019 & 2032
- Table 17: North America Hydraulic Fracturing Fluids Industry Revenue Million Forecast, by Geography 2019 & 2032
- Table 18: North America Hydraulic Fracturing Fluids Industry Revenue Million Forecast, by Country 2019 & 2032
- Table 19: North America Hydraulic Fracturing Fluids Industry Revenue Million Forecast, by Well Type 2019 & 2032
- Table 20: North America Hydraulic Fracturing Fluids Industry Revenue Million Forecast, by Fluid Type 2019 & 2032
- Table 21: North America Hydraulic Fracturing Fluids Industry Revenue Million Forecast, by Geography 2019 & 2032
- Table 22: North America Hydraulic Fracturing Fluids Industry Revenue Million Forecast, by Country 2019 & 2032
Frequently Asked Questions
1. What is the projected Compound Annual Growth Rate (CAGR) of the North America Hydraulic Fracturing Fluids Industry?
The projected CAGR is approximately > 8.50%.
2. Which companies are prominent players in the North America Hydraulic Fracturing Fluids Industry?
Key companies in the market include Ashland Inc, Chevron Phillips Chemical Company LLC, Baker Hughes Co, Schlumberger Ltd, BASF SE, DuPont de Nemours Inc *List Not Exhaustive, Halliburton Company, Akzonobel NV, Clariant International Ltd, Calfrac Well Services Ltd.
3. What are the main segments of the North America Hydraulic Fracturing Fluids Industry?
The market segments include Well Type, Fluid Type, Geography.
4. Can you provide details about the market size?
The market size is estimated to be USD XX Million as of 2022.
5. What are some drivers contributing to market growth?
4.; Presence of Strict Government Regulations to Control Air Pollution.
6. What are the notable trends driving market growth?
Horizontal Wells to Dominate the Market.
7. Are there any restraints impacting market growth?
4.; Increasing Adoption of Renewable Energy.
8. Can you provide examples of recent developments in the market?
N/A
9. What pricing options are available for accessing the report?
Pricing options include single-user, multi-user, and enterprise licenses priced at USD 4750, USD 5250, and USD 8750 respectively.
10. Is the market size provided in terms of value or volume?
The market size is provided in terms of value, measured in Million.
11. Are there any specific market keywords associated with the report?
Yes, the market keyword associated with the report is "North America Hydraulic Fracturing Fluids Industry," which aids in identifying and referencing the specific market segment covered.
12. How do I determine which pricing option suits my needs best?
The pricing options vary based on user requirements and access needs. Individual users may opt for single-user licenses, while businesses requiring broader access may choose multi-user or enterprise licenses for cost-effective access to the report.
13. Are there any additional resources or data provided in the North America Hydraulic Fracturing Fluids Industry report?
While the report offers comprehensive insights, it's advisable to review the specific contents or supplementary materials provided to ascertain if additional resources or data are available.
14. How can I stay updated on further developments or reports in the North America Hydraulic Fracturing Fluids Industry?
To stay informed about further developments, trends, and reports in the North America Hydraulic Fracturing Fluids Industry, consider subscribing to industry newsletters, following relevant companies and organizations, or regularly checking reputable industry news sources and publications.
Methodology
Step 1 - Identification of Relevant Samples Size from Population Database


Step 2 - Approaches for Defining Global Market Size (Value, Volume* & Price*)

Note*: In applicable scenarios
Step 3 - Data Sources
Primary Research
- Web Analytics
- Survey Reports
- Research Institute
- Latest Research Reports
- Opinion Leaders
Secondary Research
- Annual Reports
- White Paper
- Latest Press Release
- Industry Association
- Paid Database
- Investor Presentations

Step 4 - Data Triangulation
Involves using different sources of information in order to increase the validity of a study
These sources are likely to be stakeholders in a program - participants, other researchers, program staff, other community members, and so on.
Then we put all data in single framework & apply various statistical tools to find out the dynamic on the market.
During the analysis stage, feedback from the stakeholder groups would be compared to determine areas of agreement as well as areas of divergence
