

Key Insights
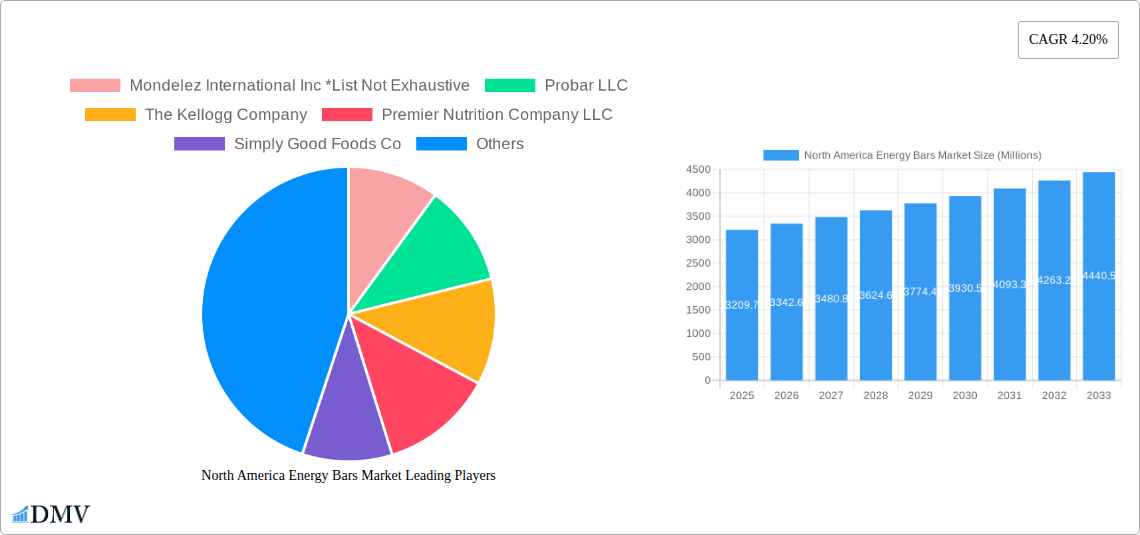
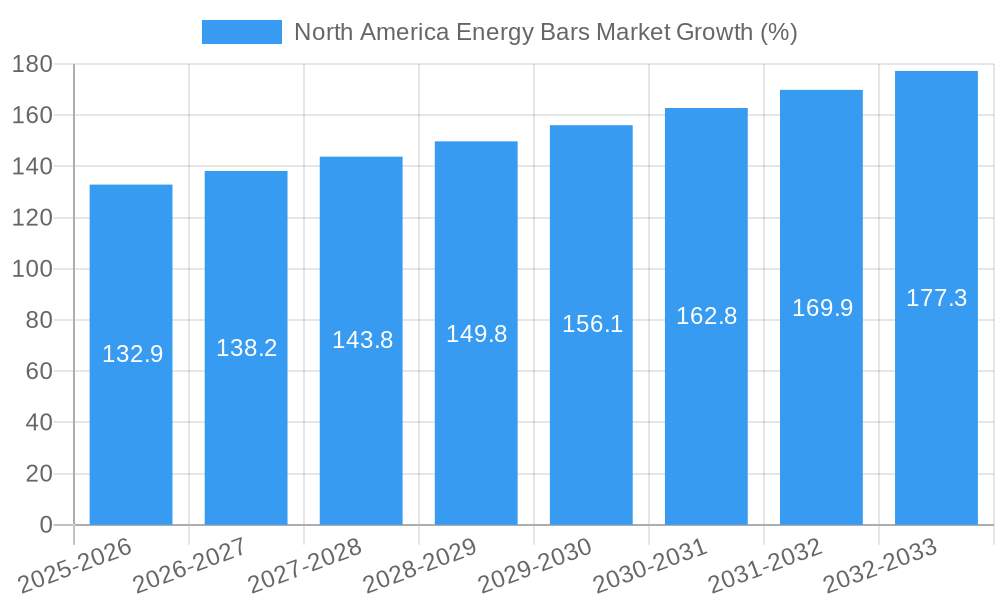
The North American energy bar market, valued at $3,209.7 million in 2025, is projected to experience steady growth, driven by increasing health consciousness, rising disposable incomes, and the convenience factor among consumers leading busy lifestyles. The market's Compound Annual Growth Rate (CAGR) of 4.20% from 2025 to 2033 indicates a continuous expansion, with projected market size exceeding $4,500 million by 2033. Key drivers include the rising popularity of on-the-go nutrition, increased demand for functional foods enriched with vitamins and minerals, and the expanding range of flavors and formulations catering to diverse dietary preferences. Supermarkets and hypermarkets remain the dominant distribution channels, though online retail stores are witnessing substantial growth, fueled by e-commerce penetration and the growing preference for home delivery. However, the market faces certain restraints, including intense competition among established brands and emerging players, fluctuating raw material prices, and concerns regarding high sugar and processed ingredient content in some energy bars. This necessitates brands to focus on product innovation, introducing healthier alternatives with natural ingredients and reduced sugar content to maintain market competitiveness and address consumer health concerns.
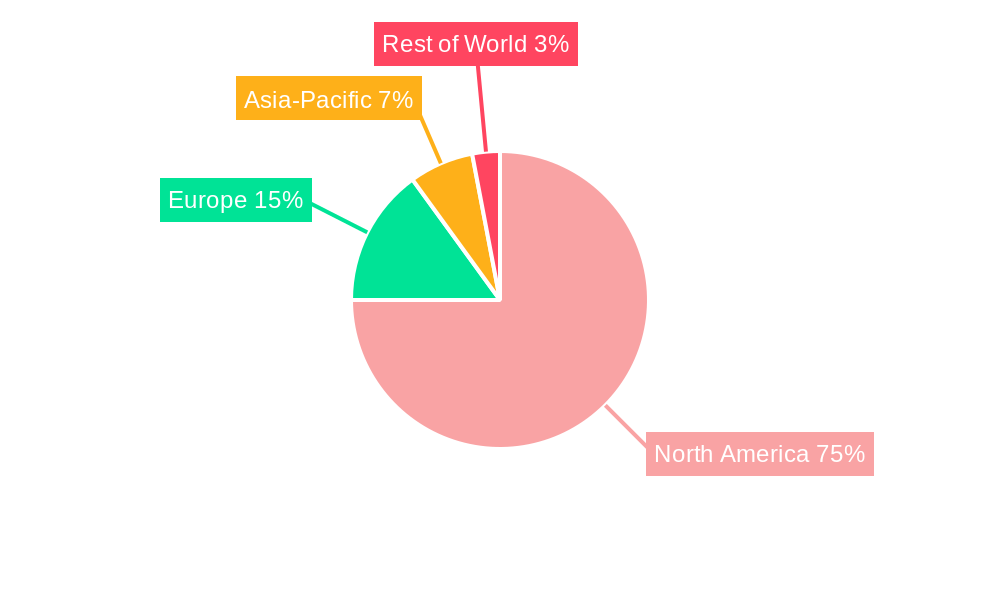
The competitive landscape is characterized by a mix of large multinational corporations like Mondelez International, Kellogg's, and General Mills, alongside smaller, specialized players such as Probar and Premier Nutrition. These companies are engaging in strategies such as product diversification, strategic partnerships, and mergers and acquisitions to expand their market presence and gain a competitive edge. The regional analysis reveals that the United States remains the largest market within North America, followed by Canada and Mexico, contributing significantly to the overall market value. Future growth will likely be propelled by the increasing focus on sustainable and ethically sourced ingredients, further strengthening the market's appeal to health-conscious consumers. Furthermore, tailored product development, catering to niche dietary requirements (vegetarian, vegan, keto, etc.), will likely fuel additional growth segments within the market.
North America Energy Bars Market: A Comprehensive Report (2019-2033)
This insightful report provides a detailed analysis of the North America energy bars market, covering the period 2019-2033. With a base year of 2025 and an estimated year of 2025, this comprehensive study offers valuable insights into market size, growth trajectories, key players, and future opportunities. The report is crucial for stakeholders seeking to understand the dynamics of this rapidly evolving market and make informed strategic decisions. The market is projected to reach xx Million by 2033, presenting significant growth potential.
North America Energy Bars Market Market Composition & Trends
This section delves into the competitive landscape of the North America energy bar market, analyzing market concentration, innovation drivers, regulatory frameworks, substitute products, end-user demographics, and merger & acquisition (M&A) activity. We examine the market share distribution among key players, including Mondelez International Inc, Probar LLC, The Kellogg Company, Premier Nutrition Company LLC, Simply Good Foods Co, General Mills Inc, PepsiCo Inc, Abbott Laboratories, Pepsico Inc, and Mars Incorporated (list not exhaustive). The report quantifies the impact of M&A activities, such as the August 2022 acquisition of Clif Bar & Company by Mondelez International, evaluating deal values in Millions and their influence on market consolidation. Furthermore, the analysis explores the role of innovation in driving market growth, considering the introduction of novel ingredients, flavors, and functional benefits. Regulatory landscapes, including labeling requirements and health & safety standards, are assessed for their impact on market dynamics. Finally, the study investigates consumer preferences, identifying key trends shaping demand for energy bars.
- Market Concentration: Analysis of market share held by top players, revealing the degree of market consolidation.
- Innovation Catalysts: Examination of new product development, ingredient innovations, and technological advancements influencing market growth.
- Regulatory Landscape: Assessment of existing and upcoming regulations impacting the energy bar industry in North America.
- Substitute Products: Exploration of alternative snack options that compete with energy bars and their market impact.
- End-User Profiles: Detailed segmentation of energy bar consumers based on demographics, lifestyle, and consumption patterns.
- M&A Activity: Analysis of recent mergers, acquisitions, and strategic partnerships, including deal values in Millions, and their effect on market structure. For example, the Mondelez International acquisition of Clif Bar & Company.
North America Energy Bars Market Industry Evolution
This section provides a detailed historical and future analysis of the North America energy bars market's evolution from 2019 to 2033. The analysis encompasses market size, growth rates (CAGR), and significant shifts in consumer preferences, technological innovations, and market trends. We examine the transition to healthier, more functional energy bars, exploring the increasing demand for organic, plant-based, and protein-rich options. Technological advancements, such as improved manufacturing processes and packaging solutions, are also discussed in relation to their impact on production efficiency and product quality. The study pinpoints key factors driving industry growth, providing data points and illustrative examples to support the analysis. The influence of health and wellness trends on the consumption patterns is meticulously examined. We further explore the emerging trends impacting the market, including personalization, subscription models and sustainable packaging.
Leading Regions, Countries, or Segments in North America Energy Bars Market
This section identifies the dominant regions, countries, or segments within the North America energy bars market, focusing on distribution channels: supermarkets/hypermarkets, convenience stores, online retail stores, and other distribution channels. The analysis uses bullet points to outline key drivers influencing the dominance of specific channels, such as investment trends, regulatory support, and consumer behavior. The dominance of a particular distribution channel is deeply analyzed to understand the underlying factors.
- Supermarkets/Hypermarkets: Key Drivers: Established distribution networks, wide consumer reach, and promotional opportunities.
- Convenience Stores: Key Drivers: Strategic location, impulse purchases, and high foot traffic.
- Online Retail Stores: Key Drivers: Growing e-commerce penetration, convenience, and wider product selection.
- Other Distribution Channels: Key Drivers: Specialty stores, gyms, and direct-to-consumer sales. (Detailed analysis of each channel's market share and growth drivers provided within the report).
North America Energy Bars Market Product Innovations
This section highlights recent innovations in energy bar products, including unique selling propositions (USPs), technological advancements, and performance metrics. The focus will be on new product features, such as improved taste, texture, functional ingredients (probiotics, added vitamins), and sustainable packaging. The section also examines the integration of technology in production and distribution processes, enhancing efficiency and quality. Examples of specific product innovations, such as CLIF BAR Mini and CLIF BUILDER Mini launched in Canada, are presented.
Propelling Factors for North America Energy Bars Market Growth
Several key factors contribute to the growth of the North America energy bars market. These include increasing health consciousness among consumers, the rising prevalence of fitness and active lifestyles, and the growing demand for convenient and nutritious snacks. Technological advancements in product development and manufacturing further boost market expansion. Favorable regulatory environments and supportive government policies create a conducive atmosphere for market growth. Specific examples of technological advancements and regulatory support are detailed.
Obstacles in the North America Energy Bars Market Market
Despite the positive outlook, several factors could hinder the growth of the North America energy bars market. These include fluctuating raw material prices, stringent regulations concerning labeling and ingredient use, and potential supply chain disruptions. Intense competition among established players and emerging brands also pose a challenge. The report quantifies the impact of these obstacles on market growth using specific data points.
Future Opportunities in North America Energy Bars Market
Future opportunities in the North America energy bars market are abundant. The growing demand for personalized nutrition, functional foods, and sustainable products presents a significant opportunity for innovation and expansion. The exploration of new markets, particularly within niche segments, offers untapped potential. Advancements in technology, such as improved manufacturing processes and packaging solutions, are expected to further enhance the market's growth trajectory.
Major Players in the North America Energy Bars Market Ecosystem
- Mondelez International Inc
- Probar LLC
- The Kellogg Company
- Premier Nutrition Company LLC
- Simply Good Foods Co
- General Mills Inc
- PepsiCo Inc
- Abbott Laboratories
- Pepsico Inc
- Mars Incorporated
Key Developments in North America Energy Bars Market Industry
- October 2021: CLIF launched CLIF BAR Mini and CLIF BUILDER Mini in Canada, expanding its product line in the plant-based energy bar segment.
- August 2022: Mondelez International acquired Clif Bar & Company, significantly expanding its presence in the North American energy bar market.
- November 2022: Lola Snacks partnered with CA Fortune to broaden its energy bar distribution across the United States.
Strategic North America Energy Bars Market Market Forecast
The North America energy bars market is poised for substantial growth over the forecast period (2025-2033), driven by increasing health consciousness, evolving consumer preferences, and technological advancements. Innovation in product formulations, expansion into new distribution channels, and strategic acquisitions will further fuel market expansion. The market exhibits significant potential for companies that adapt to evolving consumer demands and capitalize on emerging trends.
North America Energy Bars Market Segmentation
-
1. Distribution Channel
- 1.1. Supermarkets/Hypermarkets
- 1.2. Convenience Stores
- 1.3. Online Retail Stores
- 1.4. Other Distribution Channels
-
2. Geography
-
2.1. North America
- 2.1.1. United States
- 2.1.2. Canada
- 2.1.3. Mexico
- 2.1.4. Rest of North America
-
2.1. North America
North America Energy Bars Market Segmentation By Geography
-
1. North America
- 1.1. United States
- 1.2. Canada
- 1.3. Mexico
- 1.4. Rest of North America
North America Energy Bars Market REPORT HIGHLIGHTS
| Aspects | Details |
|---|---|
| Study Period | 2019-2033 |
| Base Year | 2024 |
| Estimated Year | 2025 |
| Forecast Period | 2025-2033 |
| Historical Period | 2019-2024 |
| Growth Rate | CAGR of 4.20% from 2019-2033 |
| Segmentation |
|
Table of Contents
- 1. Introduction
- 1.1. Research Scope
- 1.2. Market Segmentation
- 1.3. Research Methodology
- 1.4. Definitions and Assumptions
- 2. Executive Summary
- 2.1. Introduction
- 3. Market Dynamics
- 3.1. Introduction
- 3.2. Market Drivers
- 3.2.1. Increasing Demand for Clean Label Ingredients; Growing Health Consciousness of Consumers
- 3.3. Market Restrains
- 3.3.1. Higher Manufacturing Cost
- 3.4. Market Trends
- 3.4.1. Increasing Number of Health and Fitness Centers
- 4. Market Factor Analysis
- 4.1. Porters Five Forces
- 4.2. Supply/Value Chain
- 4.3. PESTEL analysis
- 4.4. Market Entropy
- 4.5. Patent/Trademark Analysis
- 5. North America Energy Bars Market Analysis, Insights and Forecast, 2019-2031
- 5.1. Market Analysis, Insights and Forecast - by Distribution Channel
- 5.1.1. Supermarkets/Hypermarkets
- 5.1.2. Convenience Stores
- 5.1.3. Online Retail Stores
- 5.1.4. Other Distribution Channels
- 5.2. Market Analysis, Insights and Forecast - by Geography
- 5.2.1. North America
- 5.2.1.1. United States
- 5.2.1.2. Canada
- 5.2.1.3. Mexico
- 5.2.1.4. Rest of North America
- 5.2.1. North America
- 5.3. Market Analysis, Insights and Forecast - by Region
- 5.3.1. North America
- 5.1. Market Analysis, Insights and Forecast - by Distribution Channel
- 6. United States North America Energy Bars Market Analysis, Insights and Forecast, 2019-2031
- 7. Canada North America Energy Bars Market Analysis, Insights and Forecast, 2019-2031
- 8. Mexico North America Energy Bars Market Analysis, Insights and Forecast, 2019-2031
- 9. Rest of North America North America Energy Bars Market Analysis, Insights and Forecast, 2019-2031
- 10. Competitive Analysis
- 10.1. Market Share Analysis 2024
- 10.2. Company Profiles
- 10.2.1 Mondelez International Inc *List Not Exhaustive
- 10.2.1.1. Overview
- 10.2.1.2. Products
- 10.2.1.3. SWOT Analysis
- 10.2.1.4. Recent Developments
- 10.2.1.5. Financials (Based on Availability)
- 10.2.2 Probar LLC
- 10.2.2.1. Overview
- 10.2.2.2. Products
- 10.2.2.3. SWOT Analysis
- 10.2.2.4. Recent Developments
- 10.2.2.5. Financials (Based on Availability)
- 10.2.3 The Kellogg Company
- 10.2.3.1. Overview
- 10.2.3.2. Products
- 10.2.3.3. SWOT Analysis
- 10.2.3.4. Recent Developments
- 10.2.3.5. Financials (Based on Availability)
- 10.2.4 Premier Nutrition Company LLC
- 10.2.4.1. Overview
- 10.2.4.2. Products
- 10.2.4.3. SWOT Analysis
- 10.2.4.4. Recent Developments
- 10.2.4.5. Financials (Based on Availability)
- 10.2.5 Simply Good Foods Co
- 10.2.5.1. Overview
- 10.2.5.2. Products
- 10.2.5.3. SWOT Analysis
- 10.2.5.4. Recent Developments
- 10.2.5.5. Financials (Based on Availability)
- 10.2.6 General Mills Inc
- 10.2.6.1. Overview
- 10.2.6.2. Products
- 10.2.6.3. SWOT Analysis
- 10.2.6.4. Recent Developments
- 10.2.6.5. Financials (Based on Availability)
- 10.2.7 PepsiCo Inc
- 10.2.7.1. Overview
- 10.2.7.2. Products
- 10.2.7.3. SWOT Analysis
- 10.2.7.4. Recent Developments
- 10.2.7.5. Financials (Based on Availability)
- 10.2.8 Abbott Laboratories
- 10.2.8.1. Overview
- 10.2.8.2. Products
- 10.2.8.3. SWOT Analysis
- 10.2.8.4. Recent Developments
- 10.2.8.5. Financials (Based on Availability)
- 10.2.9 Pepsico Inc
- 10.2.9.1. Overview
- 10.2.9.2. Products
- 10.2.9.3. SWOT Analysis
- 10.2.9.4. Recent Developments
- 10.2.9.5. Financials (Based on Availability)
- 10.2.10 Mars Incorporated
- 10.2.10.1. Overview
- 10.2.10.2. Products
- 10.2.10.3. SWOT Analysis
- 10.2.10.4. Recent Developments
- 10.2.10.5. Financials (Based on Availability)
- 10.2.1 Mondelez International Inc *List Not Exhaustive
List of Figures
- Figure 1: North America Energy Bars Market Revenue Breakdown (Millions, %) by Product 2024 & 2032
- Figure 2: North America Energy Bars Market Share (%) by Company 2024
List of Tables
- Table 1: North America Energy Bars Market Revenue Millions Forecast, by Region 2019 & 2032
- Table 2: North America Energy Bars Market Volume K Tons Forecast, by Region 2019 & 2032
- Table 3: North America Energy Bars Market Revenue Millions Forecast, by Distribution Channel 2019 & 2032
- Table 4: North America Energy Bars Market Volume K Tons Forecast, by Distribution Channel 2019 & 2032
- Table 5: North America Energy Bars Market Revenue Millions Forecast, by Geography 2019 & 2032
- Table 6: North America Energy Bars Market Volume K Tons Forecast, by Geography 2019 & 2032
- Table 7: North America Energy Bars Market Revenue Millions Forecast, by Region 2019 & 2032
- Table 8: North America Energy Bars Market Volume K Tons Forecast, by Region 2019 & 2032
- Table 9: North America Energy Bars Market Revenue Millions Forecast, by Country 2019 & 2032
- Table 10: North America Energy Bars Market Volume K Tons Forecast, by Country 2019 & 2032
- Table 11: United States North America Energy Bars Market Revenue (Millions) Forecast, by Application 2019 & 2032
- Table 12: United States North America Energy Bars Market Volume (K Tons) Forecast, by Application 2019 & 2032
- Table 13: Canada North America Energy Bars Market Revenue (Millions) Forecast, by Application 2019 & 2032
- Table 14: Canada North America Energy Bars Market Volume (K Tons) Forecast, by Application 2019 & 2032
- Table 15: Mexico North America Energy Bars Market Revenue (Millions) Forecast, by Application 2019 & 2032
- Table 16: Mexico North America Energy Bars Market Volume (K Tons) Forecast, by Application 2019 & 2032
- Table 17: Rest of North America North America Energy Bars Market Revenue (Millions) Forecast, by Application 2019 & 2032
- Table 18: Rest of North America North America Energy Bars Market Volume (K Tons) Forecast, by Application 2019 & 2032
- Table 19: North America Energy Bars Market Revenue Millions Forecast, by Distribution Channel 2019 & 2032
- Table 20: North America Energy Bars Market Volume K Tons Forecast, by Distribution Channel 2019 & 2032
- Table 21: North America Energy Bars Market Revenue Millions Forecast, by Geography 2019 & 2032
- Table 22: North America Energy Bars Market Volume K Tons Forecast, by Geography 2019 & 2032
- Table 23: North America Energy Bars Market Revenue Millions Forecast, by Country 2019 & 2032
- Table 24: North America Energy Bars Market Volume K Tons Forecast, by Country 2019 & 2032
- Table 25: United States North America Energy Bars Market Revenue (Millions) Forecast, by Application 2019 & 2032
- Table 26: United States North America Energy Bars Market Volume (K Tons) Forecast, by Application 2019 & 2032
- Table 27: Canada North America Energy Bars Market Revenue (Millions) Forecast, by Application 2019 & 2032
- Table 28: Canada North America Energy Bars Market Volume (K Tons) Forecast, by Application 2019 & 2032
- Table 29: Mexico North America Energy Bars Market Revenue (Millions) Forecast, by Application 2019 & 2032
- Table 30: Mexico North America Energy Bars Market Volume (K Tons) Forecast, by Application 2019 & 2032
- Table 31: Rest of North America North America Energy Bars Market Revenue (Millions) Forecast, by Application 2019 & 2032
- Table 32: Rest of North America North America Energy Bars Market Volume (K Tons) Forecast, by Application 2019 & 2032
Frequently Asked Questions
1. What is the projected Compound Annual Growth Rate (CAGR) of the North America Energy Bars Market?
The projected CAGR is approximately 4.20%.
2. Which companies are prominent players in the North America Energy Bars Market?
Key companies in the market include Mondelez International Inc *List Not Exhaustive, Probar LLC, The Kellogg Company, Premier Nutrition Company LLC, Simply Good Foods Co, General Mills Inc, PepsiCo Inc, Abbott Laboratories, Pepsico Inc, Mars Incorporated.
3. What are the main segments of the North America Energy Bars Market?
The market segments include Distribution Channel, Geography.
4. Can you provide details about the market size?
The market size is estimated to be USD 3,209.7 Millions as of 2022.
5. What are some drivers contributing to market growth?
Increasing Demand for Clean Label Ingredients; Growing Health Consciousness of Consumers.
6. What are the notable trends driving market growth?
Increasing Number of Health and Fitness Centers.
7. Are there any restraints impacting market growth?
Higher Manufacturing Cost.
8. Can you provide examples of recent developments in the market?
November 2022: Lola Snacks, a probiotic energy bar company, partnered with CA Fortune to expand its distribution of energy bars in the United States. The company's energy bars are available in natural and conventional grocery stores across the country.
9. What pricing options are available for accessing the report?
Pricing options include single-user, multi-user, and enterprise licenses priced at USD 4750, USD 5250, and USD 8750 respectively.
10. Is the market size provided in terms of value or volume?
The market size is provided in terms of value, measured in Millions and volume, measured in K Tons.
11. Are there any specific market keywords associated with the report?
Yes, the market keyword associated with the report is "North America Energy Bars Market," which aids in identifying and referencing the specific market segment covered.
12. How do I determine which pricing option suits my needs best?
The pricing options vary based on user requirements and access needs. Individual users may opt for single-user licenses, while businesses requiring broader access may choose multi-user or enterprise licenses for cost-effective access to the report.
13. Are there any additional resources or data provided in the North America Energy Bars Market report?
While the report offers comprehensive insights, it's advisable to review the specific contents or supplementary materials provided to ascertain if additional resources or data are available.
14. How can I stay updated on further developments or reports in the North America Energy Bars Market?
To stay informed about further developments, trends, and reports in the North America Energy Bars Market, consider subscribing to industry newsletters, following relevant companies and organizations, or regularly checking reputable industry news sources and publications.
Methodology
Step 1 - Identification of Relevant Samples Size from Population Database


Step 2 - Approaches for Defining Global Market Size (Value, Volume* & Price*)

Note*: In applicable scenarios
Step 3 - Data Sources
Primary Research
- Web Analytics
- Survey Reports
- Research Institute
- Latest Research Reports
- Opinion Leaders
Secondary Research
- Annual Reports
- White Paper
- Latest Press Release
- Industry Association
- Paid Database
- Investor Presentations

Step 4 - Data Triangulation
Involves using different sources of information in order to increase the validity of a study
These sources are likely to be stakeholders in a program - participants, other researchers, program staff, other community members, and so on.
Then we put all data in single framework & apply various statistical tools to find out the dynamic on the market.
During the analysis stage, feedback from the stakeholder groups would be compared to determine areas of agreement as well as areas of divergence
