

Key Insights
The global natural food flavors market is experiencing robust growth, projected to reach a substantial size driven by escalating consumer demand for clean-label products and a heightened awareness of health and wellness. The market's Compound Annual Growth Rate (CAGR) of 6.75% from 2019 to 2024 indicates a consistent upward trajectory. This growth is fueled by several key factors. The increasing prevalence of food allergies and intolerances is driving the shift towards natural alternatives to artificial flavors. Furthermore, the expanding popularity of functional foods and beverages, which often incorporate natural flavors to enhance both taste and purported health benefits, significantly contributes to market expansion. Significant regional variations exist, with North America and Europe currently holding substantial market shares due to high consumer disposable income and established food processing industries. However, rapidly growing economies in Asia-Pacific, particularly in countries like China and India, present significant untapped potential for future growth. The bakery, confectionery, and beverage segments are major application areas, while the growing demand for natural flavors in savory applications, such as sauces and seasonings, represents a promising segment for future expansion. Key players in the market are investing heavily in research and development to create innovative natural flavor solutions that meet evolving consumer preferences.
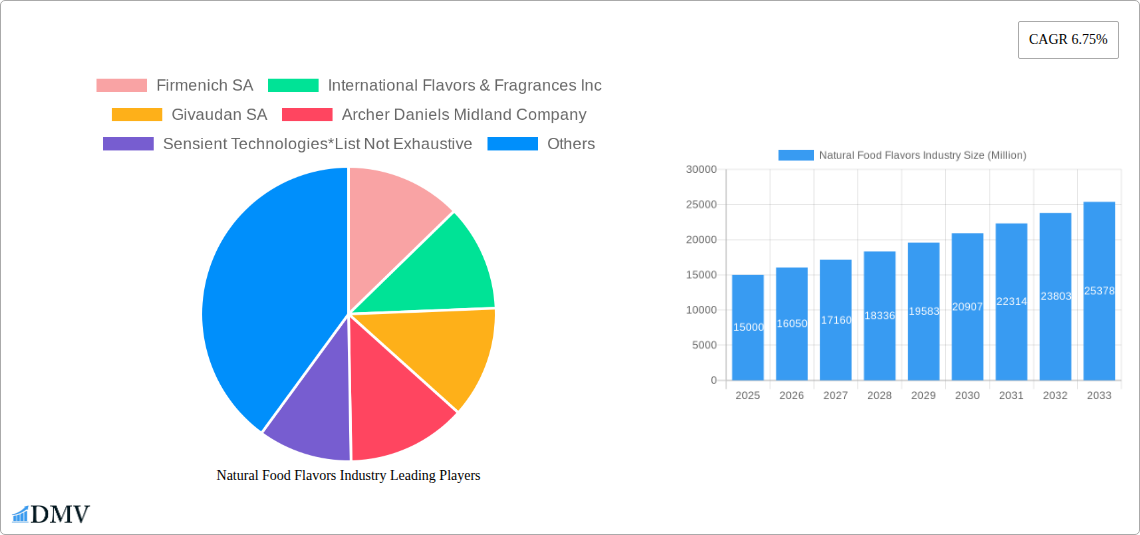
Competition within the natural food flavors market is intense, with established players like Firmenich SA, International Flavors & Fragrances Inc., and Givaudan SA vying for market share. However, smaller, specialized companies are also gaining traction by focusing on niche applications and unique flavor profiles. The market faces challenges, including the fluctuating prices of raw materials and stringent regulatory requirements for natural flavor extraction and certification. Despite these constraints, the overall outlook remains positive, with continued expansion anticipated throughout the forecast period (2025-2033). The ongoing trend toward natural and clean-label products is expected to remain a strong driver of growth, ensuring consistent demand for natural food flavors across diverse food and beverage applications globally. We project a continued expansion into new geographical regions and application areas, further solidifying the market’s position within the broader food industry.
Natural Food Flavors Industry: A Comprehensive Market Report (2019-2033)
This insightful report provides a comprehensive analysis of the global Natural Food Flavors industry, offering invaluable insights for stakeholders seeking to navigate this dynamic market. With a study period spanning 2019-2033, a base year of 2025, and a forecast period of 2025-2033, this report delivers data-driven projections and in-depth analysis to inform strategic decision-making. The global market size in 2025 is estimated at $xx Million.
Natural Food Flavors Industry Market Composition & Trends
This section dissects the competitive landscape of the natural food flavors market, evaluating market concentration, innovation drivers, regulatory influences, substitute product analysis, end-user behavior, and merger & acquisition (M&A) activity. The market exhibits a moderately concentrated structure, with key players like Firmenich SA, International Flavors & Fragrances Inc., Givaudan SA, and Archer Daniels Midland Company holding significant market share. However, smaller, specialized companies are also emerging, driven by consumer demand for unique and clean-label products.
- Market Share Distribution (2025): Firmenich SA (xx%), International Flavors & Fragrances Inc. (xx%), Givaudan SA (xx%), ADM (xx%), Others (xx%). (Note: xx represents estimated percentages).
- Innovation Catalysts: Growing consumer preference for natural and clean-label products, along with advancements in extraction and processing technologies are driving innovation.
- Regulatory Landscape: Stringent regulations regarding labeling and ingredient sourcing influence market dynamics. Compliance costs vary across regions.
- Substitute Products: Artificial flavors pose a competitive threat, but consumer preference for natural alternatives is driving market growth.
- M&A Activity (2019-2024): A total of xx M&A deals were recorded, with a cumulative value of approximately $xx Million. These transactions reflected strategic expansion moves and efforts to secure supply chains. Key acquisitions included [mention specific notable acquisitions if available].
- End-User Profiles: The primary end-users are food and beverage manufacturers targeting health-conscious consumers.
Natural Food Flavors Industry Industry Evolution
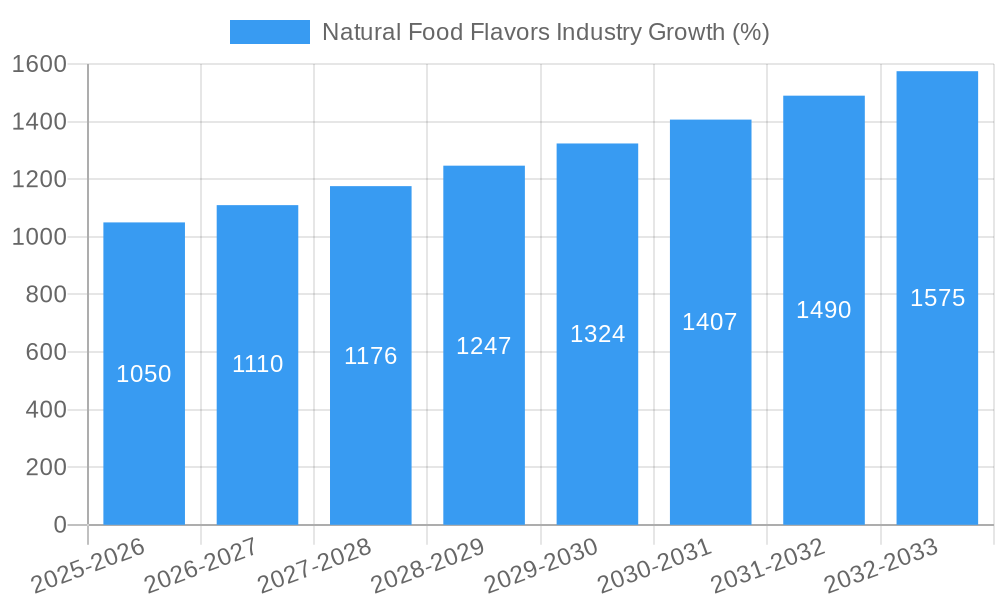
The natural food flavors market has witnessed substantial growth over the historical period (2019-2024), fueled by rising health consciousness and a shift towards clean-label products. The market is expected to maintain a robust Compound Annual Growth Rate (CAGR) of xx% during the forecast period (2025-2033), reaching an estimated value of $xx Million by 2033. Technological advancements, particularly in extraction and encapsulation technologies, are enhancing the quality and stability of natural flavors. Consumer demand for diverse flavor profiles and personalized food experiences is driving innovation and market expansion. Specific adoption metrics for new technologies vary depending on the sector; however, the overall adoption rate is increasing steadily. The shift towards sustainable sourcing practices and eco-friendly production methods is gaining momentum, adding another layer to market evolution.
Leading Regions, Countries, or Segments in Natural Food Flavors Industry
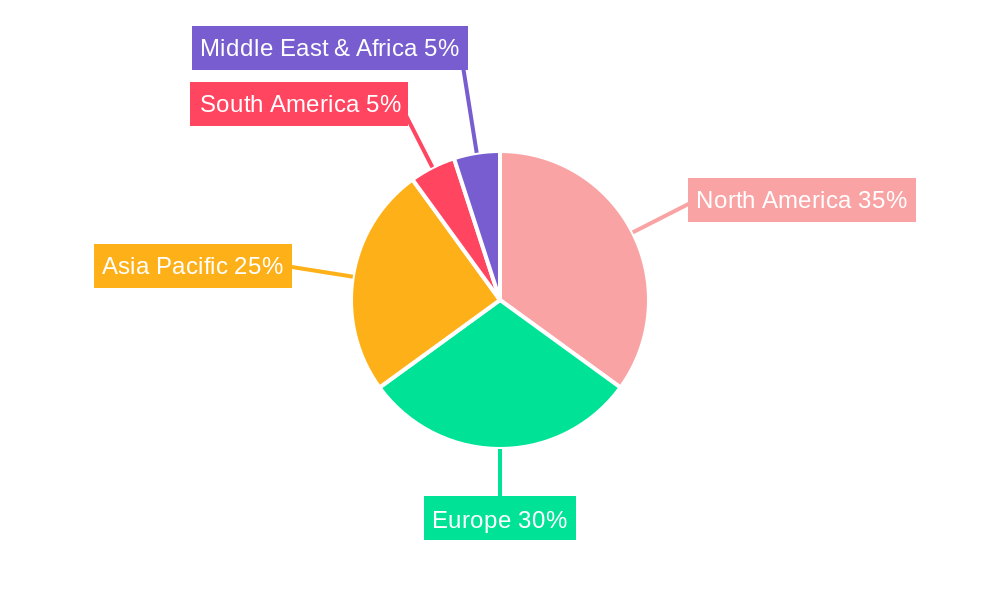
North America currently dominates the natural food flavors market, driven by high consumer demand for healthy and natural food products and a well-established food processing industry. Europe holds a substantial share, while Asia-Pacific is emerging as a rapidly growing market.
- Key Drivers for North America's Dominance:
- High disposable incomes and strong consumer preference for clean-label products.
- Robust regulatory frameworks supporting the use of natural flavors.
- Significant investments in research and development in food technology.
- Key Drivers for Europe's Significant Share:
- Stringent food safety regulations fostering trust in natural ingredients.
- A large and mature food and beverage industry.
- Growing awareness of the health benefits of natural flavors.
- Key Drivers for Asia-Pacific's Growth:
- Rising disposable incomes in developing economies.
- Growing demand for convenience foods with natural flavoring.
- Increasing adoption of Western dietary habits.
Among application types, the Beverages segment currently holds the largest market share, followed by Bakery and Confectionery. The growth of these segments is driven by increasing demand for innovative and naturally flavored products. Savory and Snacks is another high-growth segment.
Natural Food Flavors Industry Product Innovations
Recent innovations encompass the development of cleaner flavor profiles achieved through advanced extraction techniques, resulting in products with higher purity and potency. Encapsulation technologies enhance flavor stability and extend shelf life, catering to evolving consumer demands for convenience and longer-lasting products. Moreover, customized flavor solutions are increasing, meeting the specific needs of diverse food and beverage categories. These innovations are expanding the applications of natural flavors across various industries.
Propelling Factors for Natural Food Flavors Industry Growth
The growth of the natural food flavors industry is fueled by several key factors:
- Rising consumer preference for natural and clean-label food products: Consumers are increasingly aware of the potential health implications of artificial ingredients.
- Growing demand for customized and unique flavor profiles: Consumers desire diverse and personalized food experiences.
- Technological advancements: Improved extraction techniques and encapsulation technologies are enhancing the quality and stability of natural flavors.
- Favorable regulatory environment: Regulatory bodies in many countries are promoting the use of natural ingredients.
Obstacles in the Natural Food Flavors Industry Market
Challenges confronting the industry include:
- High cost of natural ingredients: Natural flavors are generally more expensive to produce than artificial flavors.
- Supply chain volatility: Fluctuations in the availability and price of raw materials can disrupt production and profitability.
- Stringent regulatory compliance: Meeting the complex labeling and ingredient sourcing requirements varies by region.
- Intense competition: The market is becoming increasingly competitive with both large multinational corporations and smaller specialized players.
Future Opportunities in Natural Food Flavors Industry
Emerging opportunities include:
- Expansion into new geographical markets: Developing countries offer considerable untapped potential.
- Development of novel extraction and processing technologies: This leads to more sustainable and cost-effective production.
- Focus on personalized nutrition and health-conscious products: Growing demand for tailored flavors for functional foods.
- Innovation in flavor combinations: Development of unique flavor blends to cater to evolving consumer preferences.
Major Players in the Natural Food Flavors Industry Ecosystem
- Firmenich SA
- International Flavors & Fragrances Inc.
- Givaudan SA
- Archer Daniels Midland Company
- Sensient Technologies
- BASF SE
- Kerry Group PLC
- Corbion NV
Key Developments in Natural Food Flavors Industry Industry
- [Month, Year]: Firmenich SA launched a new line of sustainably sourced natural flavors.
- [Month, Year]: Givaudan SA acquired a smaller flavor company, expanding its portfolio.
- [Month, Year]: New EU regulations on food labeling came into effect.
- [Month, Year]: ADM invested in a new extraction facility to increase its production capacity.
- (Add more specific developments with dates as available)
Strategic Natural Food Flavors Industry Market Forecast
The natural food flavors market is poised for continued robust growth, driven by unwavering consumer demand for clean-label products and ongoing technological advancements. The increasing focus on health and wellness, along with the growing awareness of the negative impacts of artificial additives, will further propel the market. New product innovations, strategic alliances, and expansion into emerging markets are expected to significantly shape the market's trajectory in the coming years. The market presents promising opportunities for companies that can successfully adapt to changing consumer preferences and technological advancements.
Natural Food Flavors Industry Segmentation
-
1. Application Type
- 1.1. Bakery
- 1.2. Confectionery
- 1.3. Dairy and Desserts
-
1.4. Beverages
- 1.4.1. Alcoholic
- 1.4.2. Non-alcoholic
- 1.5. Savory and Snacks
- 1.6. Meat and Meat Products
- 1.7. Sauces, Soups, and Seasonings
- 1.8. Other Applications
Natural Food Flavors Industry Segmentation By Geography
-
1. North America
- 1.1. United States
- 1.2. Canada
- 1.3. Mexico
- 1.4. Rest of North America
-
2. Europe
- 2.1. Germany
- 2.2. United Kingdom
- 2.3. France
- 2.4. Spain
- 2.5. Italy
- 2.6. Rest of Europe
-
3. Asia Pacific
- 3.1. China
- 3.2. Japan
- 3.3. India
- 3.4. Australia
- 3.5. Rest of Asia Pacific
-
4. Rest of the World
- 4.1. South America
- 4.2. Middle East
Natural Food Flavors Industry REPORT HIGHLIGHTS
| Aspects | Details |
|---|---|
| Study Period | 2019-2033 |
| Base Year | 2024 |
| Estimated Year | 2025 |
| Forecast Period | 2025-2033 |
| Historical Period | 2019-2024 |
| Growth Rate | CAGR of 6.75% from 2019-2033 |
| Segmentation |
|
Table of Contents
- 1. Introduction
- 1.1. Research Scope
- 1.2. Market Segmentation
- 1.3. Research Methodology
- 1.4. Definitions and Assumptions
- 2. Executive Summary
- 2.1. Introduction
- 3. Market Dynamics
- 3.1. Introduction
- 3.2. Market Drivers
- 3.2.1. Demand for Convenient Ready-to-Eat Food Products; Growing Affinity Toward Ethnic and Organic Frozen Ready Meals
- 3.3. Market Restrains
- 3.3.1. Rising Concerns Over Food Safety and Quality
- 3.4. Market Trends
- 3.4.1. Resurgance of Natural Food Products Among Consumers
- 4. Market Factor Analysis
- 4.1. Porters Five Forces
- 4.2. Supply/Value Chain
- 4.3. PESTEL analysis
- 4.4. Market Entropy
- 4.5. Patent/Trademark Analysis
- 5. Global Natural Food Flavors Industry Analysis, Insights and Forecast, 2019-2031
- 5.1. Market Analysis, Insights and Forecast - by Application Type
- 5.1.1. Bakery
- 5.1.2. Confectionery
- 5.1.3. Dairy and Desserts
- 5.1.4. Beverages
- 5.1.4.1. Alcoholic
- 5.1.4.2. Non-alcoholic
- 5.1.5. Savory and Snacks
- 5.1.6. Meat and Meat Products
- 5.1.7. Sauces, Soups, and Seasonings
- 5.1.8. Other Applications
- 5.2. Market Analysis, Insights and Forecast - by Region
- 5.2.1. North America
- 5.2.2. Europe
- 5.2.3. Asia Pacific
- 5.2.4. Rest of the World
- 5.1. Market Analysis, Insights and Forecast - by Application Type
- 6. North America Natural Food Flavors Industry Analysis, Insights and Forecast, 2019-2031
- 6.1. Market Analysis, Insights and Forecast - by Application Type
- 6.1.1. Bakery
- 6.1.2. Confectionery
- 6.1.3. Dairy and Desserts
- 6.1.4. Beverages
- 6.1.4.1. Alcoholic
- 6.1.4.2. Non-alcoholic
- 6.1.5. Savory and Snacks
- 6.1.6. Meat and Meat Products
- 6.1.7. Sauces, Soups, and Seasonings
- 6.1.8. Other Applications
- 6.1. Market Analysis, Insights and Forecast - by Application Type
- 7. Europe Natural Food Flavors Industry Analysis, Insights and Forecast, 2019-2031
- 7.1. Market Analysis, Insights and Forecast - by Application Type
- 7.1.1. Bakery
- 7.1.2. Confectionery
- 7.1.3. Dairy and Desserts
- 7.1.4. Beverages
- 7.1.4.1. Alcoholic
- 7.1.4.2. Non-alcoholic
- 7.1.5. Savory and Snacks
- 7.1.6. Meat and Meat Products
- 7.1.7. Sauces, Soups, and Seasonings
- 7.1.8. Other Applications
- 7.1. Market Analysis, Insights and Forecast - by Application Type
- 8. Asia Pacific Natural Food Flavors Industry Analysis, Insights and Forecast, 2019-2031
- 8.1. Market Analysis, Insights and Forecast - by Application Type
- 8.1.1. Bakery
- 8.1.2. Confectionery
- 8.1.3. Dairy and Desserts
- 8.1.4. Beverages
- 8.1.4.1. Alcoholic
- 8.1.4.2. Non-alcoholic
- 8.1.5. Savory and Snacks
- 8.1.6. Meat and Meat Products
- 8.1.7. Sauces, Soups, and Seasonings
- 8.1.8. Other Applications
- 8.1. Market Analysis, Insights and Forecast - by Application Type
- 9. Rest of the World Natural Food Flavors Industry Analysis, Insights and Forecast, 2019-2031
- 9.1. Market Analysis, Insights and Forecast - by Application Type
- 9.1.1. Bakery
- 9.1.2. Confectionery
- 9.1.3. Dairy and Desserts
- 9.1.4. Beverages
- 9.1.4.1. Alcoholic
- 9.1.4.2. Non-alcoholic
- 9.1.5. Savory and Snacks
- 9.1.6. Meat and Meat Products
- 9.1.7. Sauces, Soups, and Seasonings
- 9.1.8. Other Applications
- 9.1. Market Analysis, Insights and Forecast - by Application Type
- 10. North America Natural Food Flavors Industry Analysis, Insights and Forecast, 2019-2031
- 10.1. Market Analysis, Insights and Forecast - By Country/Sub-region
- 10.1.1 United States
- 10.1.2 Canada
- 10.1.3 Mexico
- 11. Europe Natural Food Flavors Industry Analysis, Insights and Forecast, 2019-2031
- 11.1. Market Analysis, Insights and Forecast - By Country/Sub-region
- 11.1.1 Germany
- 11.1.2 United Kingdom
- 11.1.3 France
- 11.1.4 Spain
- 11.1.5 Italy
- 11.1.6 Spain
- 11.1.7 Belgium
- 11.1.8 Netherland
- 11.1.9 Nordics
- 11.1.10 Rest of Europe
- 12. Asia Pacific Natural Food Flavors Industry Analysis, Insights and Forecast, 2019-2031
- 12.1. Market Analysis, Insights and Forecast - By Country/Sub-region
- 12.1.1 China
- 12.1.2 Japan
- 12.1.3 India
- 12.1.4 South Korea
- 12.1.5 Southeast Asia
- 12.1.6 Australia
- 12.1.7 Indonesia
- 12.1.8 Phillipes
- 12.1.9 Singapore
- 12.1.10 Thailandc
- 12.1.11 Rest of Asia Pacific
- 13. South America Natural Food Flavors Industry Analysis, Insights and Forecast, 2019-2031
- 13.1. Market Analysis, Insights and Forecast - By Country/Sub-region
- 13.1.1 Brazil
- 13.1.2 Argentina
- 13.1.3 Peru
- 13.1.4 Chile
- 13.1.5 Colombia
- 13.1.6 Ecuador
- 13.1.7 Venezuela
- 13.1.8 Rest of South America
- 14. Middle East & Africa Natural Food Flavors Industry Analysis, Insights and Forecast, 2019-2031
- 14.1. Market Analysis, Insights and Forecast - By Country/Sub-region
- 14.1.1 UAE
- 14.1.2 South Africa
- 14.1.3 Saudi Arabia
- 14.1.4 Rest of MEA
- 15. Competitive Analysis
- 15.1. Global Market Share Analysis 2024
- 15.2. Company Profiles
- 15.2.1 Firmenich SA
- 15.2.1.1. Overview
- 15.2.1.2. Products
- 15.2.1.3. SWOT Analysis
- 15.2.1.4. Recent Developments
- 15.2.1.5. Financials (Based on Availability)
- 15.2.2 International Flavors & Fragrances Inc
- 15.2.2.1. Overview
- 15.2.2.2. Products
- 15.2.2.3. SWOT Analysis
- 15.2.2.4. Recent Developments
- 15.2.2.5. Financials (Based on Availability)
- 15.2.3 Givaudan SA
- 15.2.3.1. Overview
- 15.2.3.2. Products
- 15.2.3.3. SWOT Analysis
- 15.2.3.4. Recent Developments
- 15.2.3.5. Financials (Based on Availability)
- 15.2.4 Archer Daniels Midland Company
- 15.2.4.1. Overview
- 15.2.4.2. Products
- 15.2.4.3. SWOT Analysis
- 15.2.4.4. Recent Developments
- 15.2.4.5. Financials (Based on Availability)
- 15.2.5 Sensient Technologies*List Not Exhaustive
- 15.2.5.1. Overview
- 15.2.5.2. Products
- 15.2.5.3. SWOT Analysis
- 15.2.5.4. Recent Developments
- 15.2.5.5. Financials (Based on Availability)
- 15.2.6 BASF SE
- 15.2.6.1. Overview
- 15.2.6.2. Products
- 15.2.6.3. SWOT Analysis
- 15.2.6.4. Recent Developments
- 15.2.6.5. Financials (Based on Availability)
- 15.2.7 Kerry Group PLC
- 15.2.7.1. Overview
- 15.2.7.2. Products
- 15.2.7.3. SWOT Analysis
- 15.2.7.4. Recent Developments
- 15.2.7.5. Financials (Based on Availability)
- 15.2.8 Corbion NV
- 15.2.8.1. Overview
- 15.2.8.2. Products
- 15.2.8.3. SWOT Analysis
- 15.2.8.4. Recent Developments
- 15.2.8.5. Financials (Based on Availability)
- 15.2.1 Firmenich SA
List of Figures
- Figure 1: Global Natural Food Flavors Industry Revenue Breakdown (Million, %) by Region 2024 & 2032
- Figure 2: North America Natural Food Flavors Industry Revenue (Million), by Country 2024 & 2032
- Figure 3: North America Natural Food Flavors Industry Revenue Share (%), by Country 2024 & 2032
- Figure 4: Europe Natural Food Flavors Industry Revenue (Million), by Country 2024 & 2032
- Figure 5: Europe Natural Food Flavors Industry Revenue Share (%), by Country 2024 & 2032
- Figure 6: Asia Pacific Natural Food Flavors Industry Revenue (Million), by Country 2024 & 2032
- Figure 7: Asia Pacific Natural Food Flavors Industry Revenue Share (%), by Country 2024 & 2032
- Figure 8: South America Natural Food Flavors Industry Revenue (Million), by Country 2024 & 2032
- Figure 9: South America Natural Food Flavors Industry Revenue Share (%), by Country 2024 & 2032
- Figure 10: Middle East & Africa Natural Food Flavors Industry Revenue (Million), by Country 2024 & 2032
- Figure 11: Middle East & Africa Natural Food Flavors Industry Revenue Share (%), by Country 2024 & 2032
- Figure 12: North America Natural Food Flavors Industry Revenue (Million), by Application Type 2024 & 2032
- Figure 13: North America Natural Food Flavors Industry Revenue Share (%), by Application Type 2024 & 2032
- Figure 14: North America Natural Food Flavors Industry Revenue (Million), by Country 2024 & 2032
- Figure 15: North America Natural Food Flavors Industry Revenue Share (%), by Country 2024 & 2032
- Figure 16: Europe Natural Food Flavors Industry Revenue (Million), by Application Type 2024 & 2032
- Figure 17: Europe Natural Food Flavors Industry Revenue Share (%), by Application Type 2024 & 2032
- Figure 18: Europe Natural Food Flavors Industry Revenue (Million), by Country 2024 & 2032
- Figure 19: Europe Natural Food Flavors Industry Revenue Share (%), by Country 2024 & 2032
- Figure 20: Asia Pacific Natural Food Flavors Industry Revenue (Million), by Application Type 2024 & 2032
- Figure 21: Asia Pacific Natural Food Flavors Industry Revenue Share (%), by Application Type 2024 & 2032
- Figure 22: Asia Pacific Natural Food Flavors Industry Revenue (Million), by Country 2024 & 2032
- Figure 23: Asia Pacific Natural Food Flavors Industry Revenue Share (%), by Country 2024 & 2032
- Figure 24: Rest of the World Natural Food Flavors Industry Revenue (Million), by Application Type 2024 & 2032
- Figure 25: Rest of the World Natural Food Flavors Industry Revenue Share (%), by Application Type 2024 & 2032
- Figure 26: Rest of the World Natural Food Flavors Industry Revenue (Million), by Country 2024 & 2032
- Figure 27: Rest of the World Natural Food Flavors Industry Revenue Share (%), by Country 2024 & 2032
List of Tables
- Table 1: Global Natural Food Flavors Industry Revenue Million Forecast, by Region 2019 & 2032
- Table 2: Global Natural Food Flavors Industry Revenue Million Forecast, by Application Type 2019 & 2032
- Table 3: Global Natural Food Flavors Industry Revenue Million Forecast, by Region 2019 & 2032
- Table 4: Global Natural Food Flavors Industry Revenue Million Forecast, by Country 2019 & 2032
- Table 5: United States Natural Food Flavors Industry Revenue (Million) Forecast, by Application 2019 & 2032
- Table 6: Canada Natural Food Flavors Industry Revenue (Million) Forecast, by Application 2019 & 2032
- Table 7: Mexico Natural Food Flavors Industry Revenue (Million) Forecast, by Application 2019 & 2032
- Table 8: Global Natural Food Flavors Industry Revenue Million Forecast, by Country 2019 & 2032
- Table 9: Germany Natural Food Flavors Industry Revenue (Million) Forecast, by Application 2019 & 2032
- Table 10: United Kingdom Natural Food Flavors Industry Revenue (Million) Forecast, by Application 2019 & 2032
- Table 11: France Natural Food Flavors Industry Revenue (Million) Forecast, by Application 2019 & 2032
- Table 12: Spain Natural Food Flavors Industry Revenue (Million) Forecast, by Application 2019 & 2032
- Table 13: Italy Natural Food Flavors Industry Revenue (Million) Forecast, by Application 2019 & 2032
- Table 14: Spain Natural Food Flavors Industry Revenue (Million) Forecast, by Application 2019 & 2032
- Table 15: Belgium Natural Food Flavors Industry Revenue (Million) Forecast, by Application 2019 & 2032
- Table 16: Netherland Natural Food Flavors Industry Revenue (Million) Forecast, by Application 2019 & 2032
- Table 17: Nordics Natural Food Flavors Industry Revenue (Million) Forecast, by Application 2019 & 2032
- Table 18: Rest of Europe Natural Food Flavors Industry Revenue (Million) Forecast, by Application 2019 & 2032
- Table 19: Global Natural Food Flavors Industry Revenue Million Forecast, by Country 2019 & 2032
- Table 20: China Natural Food Flavors Industry Revenue (Million) Forecast, by Application 2019 & 2032
- Table 21: Japan Natural Food Flavors Industry Revenue (Million) Forecast, by Application 2019 & 2032
- Table 22: India Natural Food Flavors Industry Revenue (Million) Forecast, by Application 2019 & 2032
- Table 23: South Korea Natural Food Flavors Industry Revenue (Million) Forecast, by Application 2019 & 2032
- Table 24: Southeast Asia Natural Food Flavors Industry Revenue (Million) Forecast, by Application 2019 & 2032
- Table 25: Australia Natural Food Flavors Industry Revenue (Million) Forecast, by Application 2019 & 2032
- Table 26: Indonesia Natural Food Flavors Industry Revenue (Million) Forecast, by Application 2019 & 2032
- Table 27: Phillipes Natural Food Flavors Industry Revenue (Million) Forecast, by Application 2019 & 2032
- Table 28: Singapore Natural Food Flavors Industry Revenue (Million) Forecast, by Application 2019 & 2032
- Table 29: Thailandc Natural Food Flavors Industry Revenue (Million) Forecast, by Application 2019 & 2032
- Table 30: Rest of Asia Pacific Natural Food Flavors Industry Revenue (Million) Forecast, by Application 2019 & 2032
- Table 31: Global Natural Food Flavors Industry Revenue Million Forecast, by Country 2019 & 2032
- Table 32: Brazil Natural Food Flavors Industry Revenue (Million) Forecast, by Application 2019 & 2032
- Table 33: Argentina Natural Food Flavors Industry Revenue (Million) Forecast, by Application 2019 & 2032
- Table 34: Peru Natural Food Flavors Industry Revenue (Million) Forecast, by Application 2019 & 2032
- Table 35: Chile Natural Food Flavors Industry Revenue (Million) Forecast, by Application 2019 & 2032
- Table 36: Colombia Natural Food Flavors Industry Revenue (Million) Forecast, by Application 2019 & 2032
- Table 37: Ecuador Natural Food Flavors Industry Revenue (Million) Forecast, by Application 2019 & 2032
- Table 38: Venezuela Natural Food Flavors Industry Revenue (Million) Forecast, by Application 2019 & 2032
- Table 39: Rest of South America Natural Food Flavors Industry Revenue (Million) Forecast, by Application 2019 & 2032
- Table 40: Global Natural Food Flavors Industry Revenue Million Forecast, by Country 2019 & 2032
- Table 41: UAE Natural Food Flavors Industry Revenue (Million) Forecast, by Application 2019 & 2032
- Table 42: South Africa Natural Food Flavors Industry Revenue (Million) Forecast, by Application 2019 & 2032
- Table 43: Saudi Arabia Natural Food Flavors Industry Revenue (Million) Forecast, by Application 2019 & 2032
- Table 44: Rest of MEA Natural Food Flavors Industry Revenue (Million) Forecast, by Application 2019 & 2032
- Table 45: Global Natural Food Flavors Industry Revenue Million Forecast, by Application Type 2019 & 2032
- Table 46: Global Natural Food Flavors Industry Revenue Million Forecast, by Country 2019 & 2032
- Table 47: United States Natural Food Flavors Industry Revenue (Million) Forecast, by Application 2019 & 2032
- Table 48: Canada Natural Food Flavors Industry Revenue (Million) Forecast, by Application 2019 & 2032
- Table 49: Mexico Natural Food Flavors Industry Revenue (Million) Forecast, by Application 2019 & 2032
- Table 50: Rest of North America Natural Food Flavors Industry Revenue (Million) Forecast, by Application 2019 & 2032
- Table 51: Global Natural Food Flavors Industry Revenue Million Forecast, by Application Type 2019 & 2032
- Table 52: Global Natural Food Flavors Industry Revenue Million Forecast, by Country 2019 & 2032
- Table 53: Germany Natural Food Flavors Industry Revenue (Million) Forecast, by Application 2019 & 2032
- Table 54: United Kingdom Natural Food Flavors Industry Revenue (Million) Forecast, by Application 2019 & 2032
- Table 55: France Natural Food Flavors Industry Revenue (Million) Forecast, by Application 2019 & 2032
- Table 56: Spain Natural Food Flavors Industry Revenue (Million) Forecast, by Application 2019 & 2032
- Table 57: Italy Natural Food Flavors Industry Revenue (Million) Forecast, by Application 2019 & 2032
- Table 58: Rest of Europe Natural Food Flavors Industry Revenue (Million) Forecast, by Application 2019 & 2032
- Table 59: Global Natural Food Flavors Industry Revenue Million Forecast, by Application Type 2019 & 2032
- Table 60: Global Natural Food Flavors Industry Revenue Million Forecast, by Country 2019 & 2032
- Table 61: China Natural Food Flavors Industry Revenue (Million) Forecast, by Application 2019 & 2032
- Table 62: Japan Natural Food Flavors Industry Revenue (Million) Forecast, by Application 2019 & 2032
- Table 63: India Natural Food Flavors Industry Revenue (Million) Forecast, by Application 2019 & 2032
- Table 64: Australia Natural Food Flavors Industry Revenue (Million) Forecast, by Application 2019 & 2032
- Table 65: Rest of Asia Pacific Natural Food Flavors Industry Revenue (Million) Forecast, by Application 2019 & 2032
- Table 66: Global Natural Food Flavors Industry Revenue Million Forecast, by Application Type 2019 & 2032
- Table 67: Global Natural Food Flavors Industry Revenue Million Forecast, by Country 2019 & 2032
- Table 68: South America Natural Food Flavors Industry Revenue (Million) Forecast, by Application 2019 & 2032
- Table 69: Middle East Natural Food Flavors Industry Revenue (Million) Forecast, by Application 2019 & 2032
Frequently Asked Questions
1. What is the projected Compound Annual Growth Rate (CAGR) of the Natural Food Flavors Industry?
The projected CAGR is approximately 6.75%.
2. Which companies are prominent players in the Natural Food Flavors Industry?
Key companies in the market include Firmenich SA, International Flavors & Fragrances Inc, Givaudan SA, Archer Daniels Midland Company, Sensient Technologies*List Not Exhaustive, BASF SE, Kerry Group PLC, Corbion NV.
3. What are the main segments of the Natural Food Flavors Industry?
The market segments include Application Type.
4. Can you provide details about the market size?
The market size is estimated to be USD XX Million as of 2022.
5. What are some drivers contributing to market growth?
Demand for Convenient Ready-to-Eat Food Products; Growing Affinity Toward Ethnic and Organic Frozen Ready Meals.
6. What are the notable trends driving market growth?
Resurgance of Natural Food Products Among Consumers.
7. Are there any restraints impacting market growth?
Rising Concerns Over Food Safety and Quality.
8. Can you provide examples of recent developments in the market?
N/A
9. What pricing options are available for accessing the report?
Pricing options include single-user, multi-user, and enterprise licenses priced at USD 4750, USD 5250, and USD 8750 respectively.
10. Is the market size provided in terms of value or volume?
The market size is provided in terms of value, measured in Million.
11. Are there any specific market keywords associated with the report?
Yes, the market keyword associated with the report is "Natural Food Flavors Industry," which aids in identifying and referencing the specific market segment covered.
12. How do I determine which pricing option suits my needs best?
The pricing options vary based on user requirements and access needs. Individual users may opt for single-user licenses, while businesses requiring broader access may choose multi-user or enterprise licenses for cost-effective access to the report.
13. Are there any additional resources or data provided in the Natural Food Flavors Industry report?
While the report offers comprehensive insights, it's advisable to review the specific contents or supplementary materials provided to ascertain if additional resources or data are available.
14. How can I stay updated on further developments or reports in the Natural Food Flavors Industry?
To stay informed about further developments, trends, and reports in the Natural Food Flavors Industry, consider subscribing to industry newsletters, following relevant companies and organizations, or regularly checking reputable industry news sources and publications.
Methodology
Step 1 - Identification of Relevant Samples Size from Population Database


Step 2 - Approaches for Defining Global Market Size (Value, Volume* & Price*)

Note*: In applicable scenarios
Step 3 - Data Sources
Primary Research
- Web Analytics
- Survey Reports
- Research Institute
- Latest Research Reports
- Opinion Leaders
Secondary Research
- Annual Reports
- White Paper
- Latest Press Release
- Industry Association
- Paid Database
- Investor Presentations

Step 4 - Data Triangulation
Involves using different sources of information in order to increase the validity of a study
These sources are likely to be stakeholders in a program - participants, other researchers, program staff, other community members, and so on.
Then we put all data in single framework & apply various statistical tools to find out the dynamic on the market.
During the analysis stage, feedback from the stakeholder groups would be compared to determine areas of agreement as well as areas of divergence
