

Key Insights
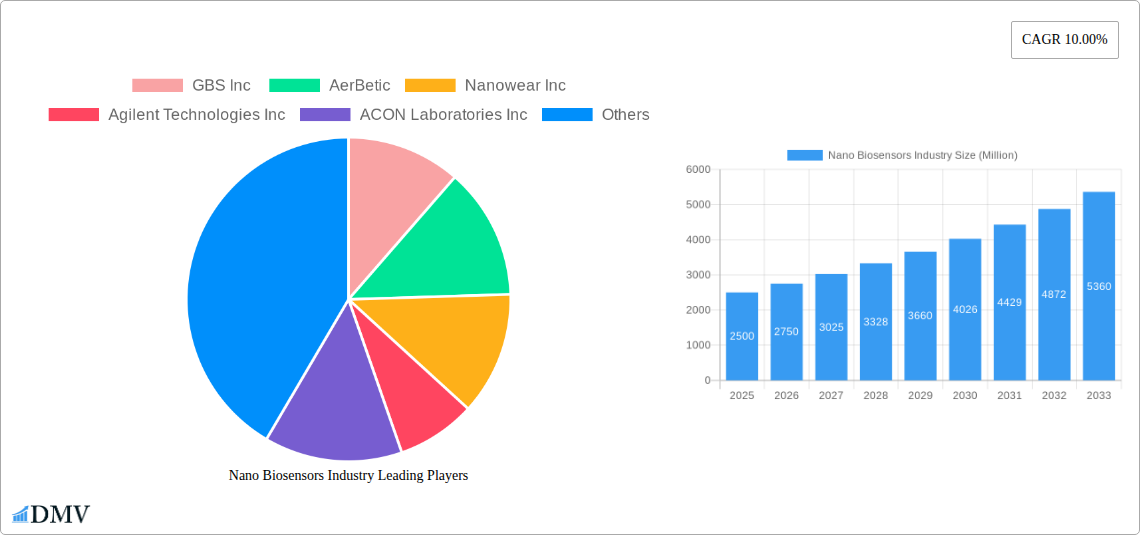
The global nano biosensors market, valued at approximately $2.5 billion in 2025, is projected to experience robust growth, exhibiting a compound annual growth rate (CAGR) of 10% from 2025 to 2033. This expansion is driven by several key factors. Firstly, the increasing prevalence of chronic diseases globally fuels the demand for rapid, accurate, and point-of-care diagnostic tools. Nano biosensors offer significant advantages in this area, providing miniaturized, sensitive detection capabilities for various biomarkers. Secondly, advancements in nanotechnology are continuously improving sensor performance, leading to enhanced sensitivity, selectivity, and cost-effectiveness. This technological progress, coupled with increasing research and development investments, is further propelling market growth. Finally, the growing adoption of nano biosensors across diverse end-user verticals, including healthcare (particularly diagnostics and personalized medicine), food and beverage safety monitoring, and environmental monitoring, contributes to the market's expansion. The healthcare sector, currently the largest segment, is expected to maintain its dominance throughout the forecast period.
Despite the positive outlook, certain challenges may restrain market growth. High initial investment costs associated with the development and manufacturing of advanced nano biosensors can pose a barrier to entry for smaller companies. Moreover, regulatory approvals and standardization issues can also delay market penetration. However, ongoing technological advancements, decreasing manufacturing costs, and supportive government initiatives are expected to mitigate these challenges in the long term. The market is segmented by sensor type (optical, electrochemical, acoustic, and others) and end-user vertical (healthcare, food & beverage, and others). Optical sensors currently hold a significant share due to their high sensitivity and versatility, but electrochemical sensors are expected to witness substantial growth due to their cost-effectiveness. The competitive landscape is characterized by a mix of established players and emerging innovative companies, fostering competition and innovation within the industry. Geographical growth is expected to be driven by increasing adoption in developing economies, especially within the Asia-Pacific region, fueled by rising healthcare expenditure and technological advancements.
Nano Biosensors Industry Market Report: 2019-2033
This comprehensive report provides an in-depth analysis of the Nano Biosensors industry, projecting a market value of xx Million by 2033. It offers a detailed examination of market trends, leading players, technological advancements, and future growth opportunities, covering the period from 2019 to 2033 (Study Period), with a focus on 2025 (Base Year and Estimated Year) and a forecast spanning 2025-2033 (Forecast Period). The historical period covered is 2019-2024 (Historical Period). This report is crucial for stakeholders seeking to understand and capitalize on the dynamic landscape of this rapidly evolving sector.
Nano Biosensors Industry Market Composition & Trends
The Nano Biosensors market, valued at xx Million in 2025, exhibits a moderately concentrated landscape with several key players vying for market share. Innovation is primarily driven by advancements in nanotechnology, materials science, and microfluidics, leading to more sensitive, specific, and portable devices. Stringent regulatory approvals and evolving healthcare standards significantly influence market dynamics. Substitute products, such as traditional diagnostic methods, pose a competitive threat, especially in cost-sensitive markets. End-users primarily comprise the healthcare sector (hospitals, clinics, research labs), followed by the food and beverage industry for quality control and safety monitoring.
- Market Share Distribution (2025): GBS Inc. (xx%), Agilent Technologies Inc. (xx%), Abbott Point of Care Inc. (xx%), Others (xx%).
- M&A Activity (2019-2024): A total of xx M&A deals were recorded, with an aggregate value of approximately xx Million. Significant deals include the acquisition of [Company A] by [Company B] for xx Million.
- Innovation Catalysts: Government funding for nanotechnology research, collaborations between academia and industry, and the increasing demand for point-of-care diagnostics.
- Regulatory Landscape: Stringent regulatory approvals (FDA, CE marking) create barriers to entry but ensure product safety and efficacy.
Nano Biosensors Industry Industry Evolution
The Nano Biosensors market experienced robust growth during the historical period (2019-2024), expanding at a CAGR of xx%. This growth is attributable to several factors: the rising prevalence of chronic diseases, increasing demand for rapid diagnostics, advancements in miniaturization and integration of sensors, and the growing adoption of personalized medicine. The technological landscape is rapidly evolving, with a shift towards portable, wireless, and multiplexed sensors. Consumer demand is increasingly driven by the need for rapid, accurate, and cost-effective diagnostic tools. The market is witnessing a transition from bulky laboratory-based systems to smaller, more accessible point-of-care devices, leading to wider adoption across various sectors. Further growth will depend on ongoing technological improvements, reduced manufacturing costs, and wider regulatory acceptance.
Leading Regions, Countries, or Segments in Nano Biosensors Industry
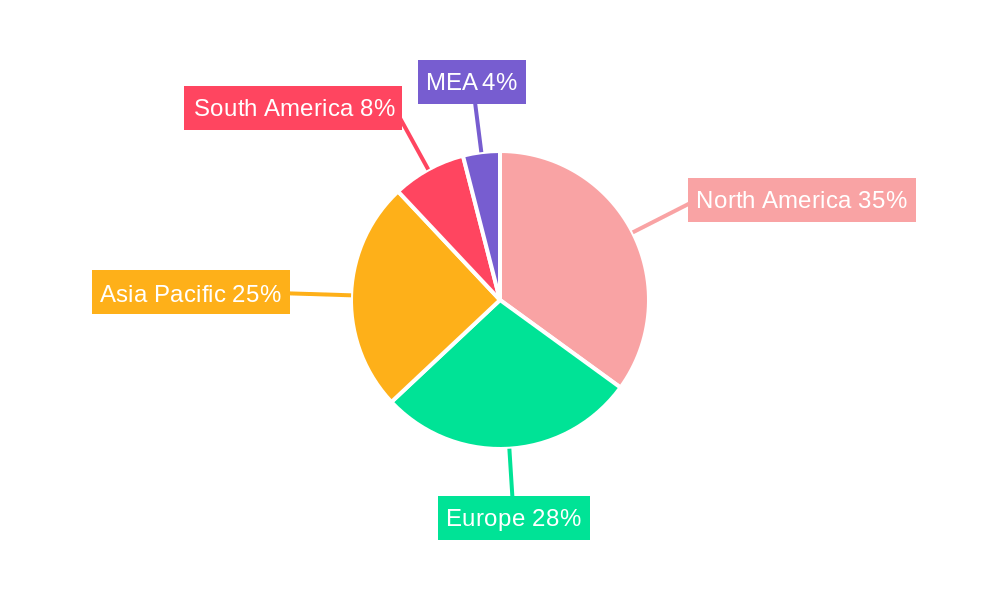
The North American region holds the dominant position in the global Nano Biosensors market, driven by factors such as strong R&D investments, advanced healthcare infrastructure, and a favorable regulatory environment.
Key Drivers in North America: High healthcare expenditure, strong regulatory support for innovative medical devices, and a significant presence of major industry players.
Dominant Segment (Type): Electrochemical sensors currently hold the largest market share due to their cost-effectiveness and ease of miniaturization. Optical sensors are expected to experience significant growth due to their high sensitivity and versatility.
Dominant Segment (End-user): The healthcare sector accounts for the majority of the market share due to the widespread use of biosensors in diagnostics, drug discovery, and personalized medicine. The food & beverage sector is showing increasing adoption for quality control and contamination detection.
Key Drivers in Europe: Growing focus on personalized medicine, substantial government funding for research and development in nanotechnology, and stringent quality control regulations in the food and beverage industry.
Key Drivers in Asia Pacific: Rapidly growing healthcare sector, increasing prevalence of infectious diseases, and rising disposable incomes leading to increased healthcare spending.
Nano Biosensors Industry Product Innovations
Recent product innovations include the development of highly sensitive and selective biosensors capable of detecting multiple analytes simultaneously. These advancements utilize novel nanomaterials, such as graphene and carbon nanotubes, to enhance performance characteristics, such as detection limits and response times. The integration of microfluidic devices further improves the efficiency and portability of the sensing platforms. Unique selling propositions include improved accuracy, reduced detection times, and portability, which cater to the growing demand for point-of-care diagnostics and decentralized testing.
Propelling Factors for Nano Biosensors Industry Growth
The Nano Biosensors industry is propelled by several factors: the increasing prevalence of chronic diseases, leading to a heightened need for early and accurate diagnostics; significant investments in nanotechnology research and development; and supportive government policies promoting the adoption of advanced medical technologies. The growing demand for point-of-care diagnostics in remote areas and resource-limited settings also fuels market growth. Moreover, the integration of artificial intelligence and machine learning is improving the analytical capabilities and diagnostic accuracy of nano biosensors.
Obstacles in the Nano Biosensors Industry Market
Significant barriers include the high cost of development and manufacturing, especially for advanced sensor technologies; the complexity of regulatory approvals required for medical devices; and the potential for supply chain disruptions impacting the availability of critical components. The competitive landscape also presents a challenge, with established players and emerging companies competing aggressively for market share.
Future Opportunities in Nano Biosensors Industry
Future opportunities lie in the development of wearable and implantable sensors for continuous health monitoring; the expansion into new application areas, such as environmental monitoring and food safety; and the integration of advanced data analytics and artificial intelligence to improve diagnostic accuracy and personalized treatment. Moreover, the development of more robust and cost-effective manufacturing processes will be vital for market penetration.
Major Players in the Nano Biosensors Industry Ecosystem
- GBS Inc
- AerBetic
- Nanowear Inc
- Agilent Technologies Inc
- ACON Laboratories Inc
- Instant NanoBiosensors Co Ltd
- Vista Therapeutics Inc
- Abbott Point of Care Inc
- Bruker Corporation
- LamdaGen Corporation
Key Developments in Nano Biosensors Industry Industry
- Jan 2023: GBS Inc. launched a new generation of electrochemical biosensors with enhanced sensitivity.
- March 2024: Agilent Technologies Inc. acquired a smaller biosensor company, expanding its product portfolio.
- June 2025: Nanowear Inc. secured significant funding for the development of a novel wearable biosensor. Further developments will be added as they occur.
Strategic Nano Biosensors Industry Market Forecast
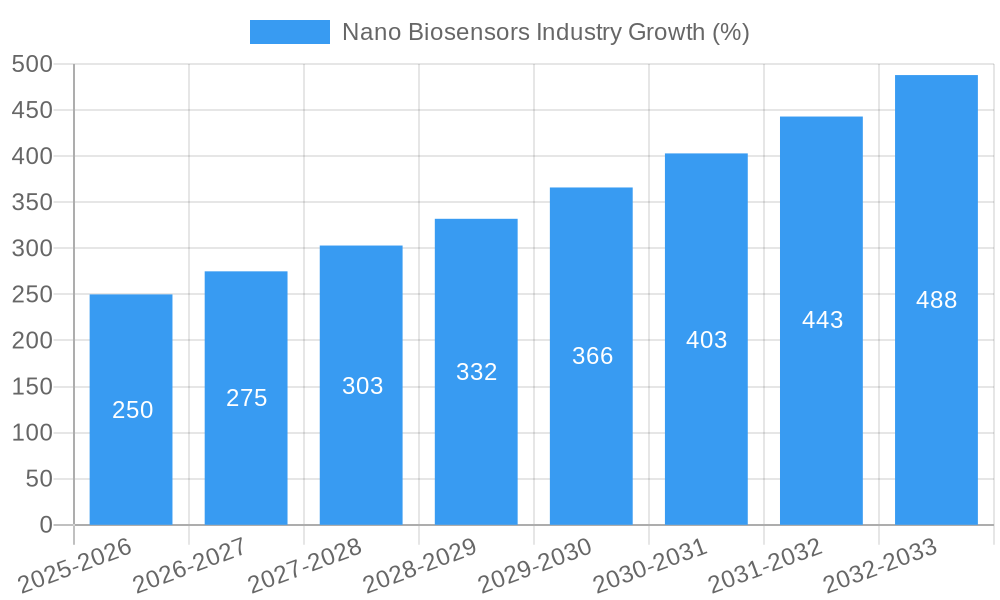
The Nano Biosensors market is poised for continued growth, driven by technological advancements, increasing healthcare spending, and the growing adoption of point-of-care diagnostics. The market is expected to experience a CAGR of xx% during the forecast period (2025-2033), reaching a value of xx Million by 2033. The continued integration of nanotechnology and artificial intelligence, alongside the expansion into new applications, will further propel market growth.
Nano Biosensors Industry Segmentation
-
1. Type (Qualitative Analysis)
- 1.1. Optical Sensor
- 1.2. Electrochemical Sensor
- 1.3. Acoustic Sensor
- 1.4. Other Types
-
2. End-user Vertical
- 2.1. Healthcare
- 2.2. Food & Beverage
- 2.3. Other End-use Verticals
Nano Biosensors Industry Segmentation By Geography
- 1. North America
- 2. Europe
- 3. Asia Pacific
- 4. Rest of the World
Nano Biosensors Industry REPORT HIGHLIGHTS
| Aspects | Details |
|---|---|
| Study Period | 2019-2033 |
| Base Year | 2024 |
| Estimated Year | 2025 |
| Forecast Period | 2025-2033 |
| Historical Period | 2019-2024 |
| Growth Rate | CAGR of 10.00% from 2019-2033 |
| Segmentation |
|
Table of Contents
- 1. Introduction
- 1.1. Research Scope
- 1.2. Market Segmentation
- 1.3. Research Methodology
- 1.4. Definitions and Assumptions
- 2. Executive Summary
- 2.1. Introduction
- 3. Market Dynamics
- 3.1. Introduction
- 3.2. Market Drivers
- 3.2.1. ; Rise of Miniaturization Trend
- 3.3. Market Restrains
- 3.3.1. Operational Challenges Involving Cross-border Payments
- 3.4. Market Trends
- 3.4.1. Healthcare Industry Holds the Significant Share in the Market
- 4. Market Factor Analysis
- 4.1. Porters Five Forces
- 4.2. Supply/Value Chain
- 4.3. PESTEL analysis
- 4.4. Market Entropy
- 4.5. Patent/Trademark Analysis
- 5. Global Nano Biosensors Industry Analysis, Insights and Forecast, 2019-2031
- 5.1. Market Analysis, Insights and Forecast - by Type (Qualitative Analysis)
- 5.1.1. Optical Sensor
- 5.1.2. Electrochemical Sensor
- 5.1.3. Acoustic Sensor
- 5.1.4. Other Types
- 5.2. Market Analysis, Insights and Forecast - by End-user Vertical
- 5.2.1. Healthcare
- 5.2.2. Food & Beverage
- 5.2.3. Other End-use Verticals
- 5.3. Market Analysis, Insights and Forecast - by Region
- 5.3.1. North America
- 5.3.2. Europe
- 5.3.3. Asia Pacific
- 5.3.4. Rest of the World
- 5.1. Market Analysis, Insights and Forecast - by Type (Qualitative Analysis)
- 6. North America Nano Biosensors Industry Analysis, Insights and Forecast, 2019-2031
- 6.1. Market Analysis, Insights and Forecast - by Type (Qualitative Analysis)
- 6.1.1. Optical Sensor
- 6.1.2. Electrochemical Sensor
- 6.1.3. Acoustic Sensor
- 6.1.4. Other Types
- 6.2. Market Analysis, Insights and Forecast - by End-user Vertical
- 6.2.1. Healthcare
- 6.2.2. Food & Beverage
- 6.2.3. Other End-use Verticals
- 6.1. Market Analysis, Insights and Forecast - by Type (Qualitative Analysis)
- 7. Europe Nano Biosensors Industry Analysis, Insights and Forecast, 2019-2031
- 7.1. Market Analysis, Insights and Forecast - by Type (Qualitative Analysis)
- 7.1.1. Optical Sensor
- 7.1.2. Electrochemical Sensor
- 7.1.3. Acoustic Sensor
- 7.1.4. Other Types
- 7.2. Market Analysis, Insights and Forecast - by End-user Vertical
- 7.2.1. Healthcare
- 7.2.2. Food & Beverage
- 7.2.3. Other End-use Verticals
- 7.1. Market Analysis, Insights and Forecast - by Type (Qualitative Analysis)
- 8. Asia Pacific Nano Biosensors Industry Analysis, Insights and Forecast, 2019-2031
- 8.1. Market Analysis, Insights and Forecast - by Type (Qualitative Analysis)
- 8.1.1. Optical Sensor
- 8.1.2. Electrochemical Sensor
- 8.1.3. Acoustic Sensor
- 8.1.4. Other Types
- 8.2. Market Analysis, Insights and Forecast - by End-user Vertical
- 8.2.1. Healthcare
- 8.2.2. Food & Beverage
- 8.2.3. Other End-use Verticals
- 8.1. Market Analysis, Insights and Forecast - by Type (Qualitative Analysis)
- 9. Rest of the World Nano Biosensors Industry Analysis, Insights and Forecast, 2019-2031
- 9.1. Market Analysis, Insights and Forecast - by Type (Qualitative Analysis)
- 9.1.1. Optical Sensor
- 9.1.2. Electrochemical Sensor
- 9.1.3. Acoustic Sensor
- 9.1.4. Other Types
- 9.2. Market Analysis, Insights and Forecast - by End-user Vertical
- 9.2.1. Healthcare
- 9.2.2. Food & Beverage
- 9.2.3. Other End-use Verticals
- 9.1. Market Analysis, Insights and Forecast - by Type (Qualitative Analysis)
- 10. North America Nano Biosensors Industry Analysis, Insights and Forecast, 2019-2031
- 10.1. Market Analysis, Insights and Forecast - By Country/Sub-region
- 10.1.1. undefined
- 11. Europe Nano Biosensors Industry Analysis, Insights and Forecast, 2019-2031
- 11.1. Market Analysis, Insights and Forecast - By Country/Sub-region
- 11.1.1. undefined
- 12. Asia Pacific Nano Biosensors Industry Analysis, Insights and Forecast, 2019-2031
- 12.1. Market Analysis, Insights and Forecast - By Country/Sub-region
- 12.1.1. undefined
- 13. South America Nano Biosensors Industry Analysis, Insights and Forecast, 2019-2031
- 13.1. Market Analysis, Insights and Forecast - By Country/Sub-region
- 13.1.1. undefined
- 14. North America Nano Biosensors Industry Analysis, Insights and Forecast, 2019-2031
- 14.1. Market Analysis, Insights and Forecast - By Country/Sub-region
- 14.1.1. undefined
- 15. MEA Nano Biosensors Industry Analysis, Insights and Forecast, 2019-2031
- 15.1. Market Analysis, Insights and Forecast - By Country/Sub-region
- 15.1.1. undefined
- 16. Competitive Analysis
- 16.1. Global Market Share Analysis 2024
- 16.2. Company Profiles
- 16.2.1 GBS Inc
- 16.2.1.1. Overview
- 16.2.1.2. Products
- 16.2.1.3. SWOT Analysis
- 16.2.1.4. Recent Developments
- 16.2.1.5. Financials (Based on Availability)
- 16.2.2 AerBetic
- 16.2.2.1. Overview
- 16.2.2.2. Products
- 16.2.2.3. SWOT Analysis
- 16.2.2.4. Recent Developments
- 16.2.2.5. Financials (Based on Availability)
- 16.2.3 Nanowear Inc
- 16.2.3.1. Overview
- 16.2.3.2. Products
- 16.2.3.3. SWOT Analysis
- 16.2.3.4. Recent Developments
- 16.2.3.5. Financials (Based on Availability)
- 16.2.4 Agilent Technologies Inc
- 16.2.4.1. Overview
- 16.2.4.2. Products
- 16.2.4.3. SWOT Analysis
- 16.2.4.4. Recent Developments
- 16.2.4.5. Financials (Based on Availability)
- 16.2.5 ACON Laboratories Inc
- 16.2.5.1. Overview
- 16.2.5.2. Products
- 16.2.5.3. SWOT Analysis
- 16.2.5.4. Recent Developments
- 16.2.5.5. Financials (Based on Availability)
- 16.2.6 Instant NanoBiosensors Co Ltd
- 16.2.6.1. Overview
- 16.2.6.2. Products
- 16.2.6.3. SWOT Analysis
- 16.2.6.4. Recent Developments
- 16.2.6.5. Financials (Based on Availability)
- 16.2.7 Vista Therapeutics Inc
- 16.2.7.1. Overview
- 16.2.7.2. Products
- 16.2.7.3. SWOT Analysis
- 16.2.7.4. Recent Developments
- 16.2.7.5. Financials (Based on Availability)
- 16.2.8 Abbott Point of Care Inc
- 16.2.8.1. Overview
- 16.2.8.2. Products
- 16.2.8.3. SWOT Analysis
- 16.2.8.4. Recent Developments
- 16.2.8.5. Financials (Based on Availability)
- 16.2.9 Bruker Corporation
- 16.2.9.1. Overview
- 16.2.9.2. Products
- 16.2.9.3. SWOT Analysis
- 16.2.9.4. Recent Developments
- 16.2.9.5. Financials (Based on Availability)
- 16.2.10 LamdaGen Corporation
- 16.2.10.1. Overview
- 16.2.10.2. Products
- 16.2.10.3. SWOT Analysis
- 16.2.10.4. Recent Developments
- 16.2.10.5. Financials (Based on Availability)
- 16.2.1 GBS Inc
List of Figures
- Figure 1: Global Nano Biosensors Industry Revenue Breakdown (Million, %) by Region 2024 & 2032
- Figure 2: Global Nano Biosensors Industry Volume Breakdown (K Unit, %) by Region 2024 & 2032
- Figure 3: North America Nano Biosensors Industry Revenue (Million), by Country 2024 & 2032
- Figure 4: North America Nano Biosensors Industry Volume (K Unit), by Country 2024 & 2032
- Figure 5: North America Nano Biosensors Industry Revenue Share (%), by Country 2024 & 2032
- Figure 6: North America Nano Biosensors Industry Volume Share (%), by Country 2024 & 2032
- Figure 7: Europe Nano Biosensors Industry Revenue (Million), by Country 2024 & 2032
- Figure 8: Europe Nano Biosensors Industry Volume (K Unit), by Country 2024 & 2032
- Figure 9: Europe Nano Biosensors Industry Revenue Share (%), by Country 2024 & 2032
- Figure 10: Europe Nano Biosensors Industry Volume Share (%), by Country 2024 & 2032
- Figure 11: Asia Pacific Nano Biosensors Industry Revenue (Million), by Country 2024 & 2032
- Figure 12: Asia Pacific Nano Biosensors Industry Volume (K Unit), by Country 2024 & 2032
- Figure 13: Asia Pacific Nano Biosensors Industry Revenue Share (%), by Country 2024 & 2032
- Figure 14: Asia Pacific Nano Biosensors Industry Volume Share (%), by Country 2024 & 2032
- Figure 15: South America Nano Biosensors Industry Revenue (Million), by Country 2024 & 2032
- Figure 16: South America Nano Biosensors Industry Volume (K Unit), by Country 2024 & 2032
- Figure 17: South America Nano Biosensors Industry Revenue Share (%), by Country 2024 & 2032
- Figure 18: South America Nano Biosensors Industry Volume Share (%), by Country 2024 & 2032
- Figure 19: North America Nano Biosensors Industry Revenue (Million), by Country 2024 & 2032
- Figure 20: North America Nano Biosensors Industry Volume (K Unit), by Country 2024 & 2032
- Figure 21: North America Nano Biosensors Industry Revenue Share (%), by Country 2024 & 2032
- Figure 22: North America Nano Biosensors Industry Volume Share (%), by Country 2024 & 2032
- Figure 23: MEA Nano Biosensors Industry Revenue (Million), by Country 2024 & 2032
- Figure 24: MEA Nano Biosensors Industry Volume (K Unit), by Country 2024 & 2032
- Figure 25: MEA Nano Biosensors Industry Revenue Share (%), by Country 2024 & 2032
- Figure 26: MEA Nano Biosensors Industry Volume Share (%), by Country 2024 & 2032
- Figure 27: North America Nano Biosensors Industry Revenue (Million), by Type (Qualitative Analysis) 2024 & 2032
- Figure 28: North America Nano Biosensors Industry Volume (K Unit), by Type (Qualitative Analysis) 2024 & 2032
- Figure 29: North America Nano Biosensors Industry Revenue Share (%), by Type (Qualitative Analysis) 2024 & 2032
- Figure 30: North America Nano Biosensors Industry Volume Share (%), by Type (Qualitative Analysis) 2024 & 2032
- Figure 31: North America Nano Biosensors Industry Revenue (Million), by End-user Vertical 2024 & 2032
- Figure 32: North America Nano Biosensors Industry Volume (K Unit), by End-user Vertical 2024 & 2032
- Figure 33: North America Nano Biosensors Industry Revenue Share (%), by End-user Vertical 2024 & 2032
- Figure 34: North America Nano Biosensors Industry Volume Share (%), by End-user Vertical 2024 & 2032
- Figure 35: North America Nano Biosensors Industry Revenue (Million), by Country 2024 & 2032
- Figure 36: North America Nano Biosensors Industry Volume (K Unit), by Country 2024 & 2032
- Figure 37: North America Nano Biosensors Industry Revenue Share (%), by Country 2024 & 2032
- Figure 38: North America Nano Biosensors Industry Volume Share (%), by Country 2024 & 2032
- Figure 39: Europe Nano Biosensors Industry Revenue (Million), by Type (Qualitative Analysis) 2024 & 2032
- Figure 40: Europe Nano Biosensors Industry Volume (K Unit), by Type (Qualitative Analysis) 2024 & 2032
- Figure 41: Europe Nano Biosensors Industry Revenue Share (%), by Type (Qualitative Analysis) 2024 & 2032
- Figure 42: Europe Nano Biosensors Industry Volume Share (%), by Type (Qualitative Analysis) 2024 & 2032
- Figure 43: Europe Nano Biosensors Industry Revenue (Million), by End-user Vertical 2024 & 2032
- Figure 44: Europe Nano Biosensors Industry Volume (K Unit), by End-user Vertical 2024 & 2032
- Figure 45: Europe Nano Biosensors Industry Revenue Share (%), by End-user Vertical 2024 & 2032
- Figure 46: Europe Nano Biosensors Industry Volume Share (%), by End-user Vertical 2024 & 2032
- Figure 47: Europe Nano Biosensors Industry Revenue (Million), by Country 2024 & 2032
- Figure 48: Europe Nano Biosensors Industry Volume (K Unit), by Country 2024 & 2032
- Figure 49: Europe Nano Biosensors Industry Revenue Share (%), by Country 2024 & 2032
- Figure 50: Europe Nano Biosensors Industry Volume Share (%), by Country 2024 & 2032
- Figure 51: Asia Pacific Nano Biosensors Industry Revenue (Million), by Type (Qualitative Analysis) 2024 & 2032
- Figure 52: Asia Pacific Nano Biosensors Industry Volume (K Unit), by Type (Qualitative Analysis) 2024 & 2032
- Figure 53: Asia Pacific Nano Biosensors Industry Revenue Share (%), by Type (Qualitative Analysis) 2024 & 2032
- Figure 54: Asia Pacific Nano Biosensors Industry Volume Share (%), by Type (Qualitative Analysis) 2024 & 2032
- Figure 55: Asia Pacific Nano Biosensors Industry Revenue (Million), by End-user Vertical 2024 & 2032
- Figure 56: Asia Pacific Nano Biosensors Industry Volume (K Unit), by End-user Vertical 2024 & 2032
- Figure 57: Asia Pacific Nano Biosensors Industry Revenue Share (%), by End-user Vertical 2024 & 2032
- Figure 58: Asia Pacific Nano Biosensors Industry Volume Share (%), by End-user Vertical 2024 & 2032
- Figure 59: Asia Pacific Nano Biosensors Industry Revenue (Million), by Country 2024 & 2032
- Figure 60: Asia Pacific Nano Biosensors Industry Volume (K Unit), by Country 2024 & 2032
- Figure 61: Asia Pacific Nano Biosensors Industry Revenue Share (%), by Country 2024 & 2032
- Figure 62: Asia Pacific Nano Biosensors Industry Volume Share (%), by Country 2024 & 2032
- Figure 63: Rest of the World Nano Biosensors Industry Revenue (Million), by Type (Qualitative Analysis) 2024 & 2032
- Figure 64: Rest of the World Nano Biosensors Industry Volume (K Unit), by Type (Qualitative Analysis) 2024 & 2032
- Figure 65: Rest of the World Nano Biosensors Industry Revenue Share (%), by Type (Qualitative Analysis) 2024 & 2032
- Figure 66: Rest of the World Nano Biosensors Industry Volume Share (%), by Type (Qualitative Analysis) 2024 & 2032
- Figure 67: Rest of the World Nano Biosensors Industry Revenue (Million), by End-user Vertical 2024 & 2032
- Figure 68: Rest of the World Nano Biosensors Industry Volume (K Unit), by End-user Vertical 2024 & 2032
- Figure 69: Rest of the World Nano Biosensors Industry Revenue Share (%), by End-user Vertical 2024 & 2032
- Figure 70: Rest of the World Nano Biosensors Industry Volume Share (%), by End-user Vertical 2024 & 2032
- Figure 71: Rest of the World Nano Biosensors Industry Revenue (Million), by Country 2024 & 2032
- Figure 72: Rest of the World Nano Biosensors Industry Volume (K Unit), by Country 2024 & 2032
- Figure 73: Rest of the World Nano Biosensors Industry Revenue Share (%), by Country 2024 & 2032
- Figure 74: Rest of the World Nano Biosensors Industry Volume Share (%), by Country 2024 & 2032
List of Tables
- Table 1: Global Nano Biosensors Industry Revenue Million Forecast, by Region 2019 & 2032
- Table 2: Global Nano Biosensors Industry Volume K Unit Forecast, by Region 2019 & 2032
- Table 3: Global Nano Biosensors Industry Revenue Million Forecast, by Type (Qualitative Analysis) 2019 & 2032
- Table 4: Global Nano Biosensors Industry Volume K Unit Forecast, by Type (Qualitative Analysis) 2019 & 2032
- Table 5: Global Nano Biosensors Industry Revenue Million Forecast, by End-user Vertical 2019 & 2032
- Table 6: Global Nano Biosensors Industry Volume K Unit Forecast, by End-user Vertical 2019 & 2032
- Table 7: Global Nano Biosensors Industry Revenue Million Forecast, by Region 2019 & 2032
- Table 8: Global Nano Biosensors Industry Volume K Unit Forecast, by Region 2019 & 2032
- Table 9: Global Nano Biosensors Industry Revenue Million Forecast, by Country 2019 & 2032
- Table 10: Global Nano Biosensors Industry Volume K Unit Forecast, by Country 2019 & 2032
- Table 11: Global Nano Biosensors Industry Revenue Million Forecast, by Country 2019 & 2032
- Table 12: Global Nano Biosensors Industry Volume K Unit Forecast, by Country 2019 & 2032
- Table 13: Global Nano Biosensors Industry Revenue Million Forecast, by Country 2019 & 2032
- Table 14: Global Nano Biosensors Industry Volume K Unit Forecast, by Country 2019 & 2032
- Table 15: Global Nano Biosensors Industry Revenue Million Forecast, by Country 2019 & 2032
- Table 16: Global Nano Biosensors Industry Volume K Unit Forecast, by Country 2019 & 2032
- Table 17: Global Nano Biosensors Industry Revenue Million Forecast, by Country 2019 & 2032
- Table 18: Global Nano Biosensors Industry Volume K Unit Forecast, by Country 2019 & 2032
- Table 19: Global Nano Biosensors Industry Revenue Million Forecast, by Country 2019 & 2032
- Table 20: Global Nano Biosensors Industry Volume K Unit Forecast, by Country 2019 & 2032
- Table 21: Global Nano Biosensors Industry Revenue Million Forecast, by Type (Qualitative Analysis) 2019 & 2032
- Table 22: Global Nano Biosensors Industry Volume K Unit Forecast, by Type (Qualitative Analysis) 2019 & 2032
- Table 23: Global Nano Biosensors Industry Revenue Million Forecast, by End-user Vertical 2019 & 2032
- Table 24: Global Nano Biosensors Industry Volume K Unit Forecast, by End-user Vertical 2019 & 2032
- Table 25: Global Nano Biosensors Industry Revenue Million Forecast, by Country 2019 & 2032
- Table 26: Global Nano Biosensors Industry Volume K Unit Forecast, by Country 2019 & 2032
- Table 27: Global Nano Biosensors Industry Revenue Million Forecast, by Type (Qualitative Analysis) 2019 & 2032
- Table 28: Global Nano Biosensors Industry Volume K Unit Forecast, by Type (Qualitative Analysis) 2019 & 2032
- Table 29: Global Nano Biosensors Industry Revenue Million Forecast, by End-user Vertical 2019 & 2032
- Table 30: Global Nano Biosensors Industry Volume K Unit Forecast, by End-user Vertical 2019 & 2032
- Table 31: Global Nano Biosensors Industry Revenue Million Forecast, by Country 2019 & 2032
- Table 32: Global Nano Biosensors Industry Volume K Unit Forecast, by Country 2019 & 2032
- Table 33: Global Nano Biosensors Industry Revenue Million Forecast, by Type (Qualitative Analysis) 2019 & 2032
- Table 34: Global Nano Biosensors Industry Volume K Unit Forecast, by Type (Qualitative Analysis) 2019 & 2032
- Table 35: Global Nano Biosensors Industry Revenue Million Forecast, by End-user Vertical 2019 & 2032
- Table 36: Global Nano Biosensors Industry Volume K Unit Forecast, by End-user Vertical 2019 & 2032
- Table 37: Global Nano Biosensors Industry Revenue Million Forecast, by Country 2019 & 2032
- Table 38: Global Nano Biosensors Industry Volume K Unit Forecast, by Country 2019 & 2032
- Table 39: Global Nano Biosensors Industry Revenue Million Forecast, by Type (Qualitative Analysis) 2019 & 2032
- Table 40: Global Nano Biosensors Industry Volume K Unit Forecast, by Type (Qualitative Analysis) 2019 & 2032
- Table 41: Global Nano Biosensors Industry Revenue Million Forecast, by End-user Vertical 2019 & 2032
- Table 42: Global Nano Biosensors Industry Volume K Unit Forecast, by End-user Vertical 2019 & 2032
- Table 43: Global Nano Biosensors Industry Revenue Million Forecast, by Country 2019 & 2032
- Table 44: Global Nano Biosensors Industry Volume K Unit Forecast, by Country 2019 & 2032
Frequently Asked Questions
1. What is the projected Compound Annual Growth Rate (CAGR) of the Nano Biosensors Industry?
The projected CAGR is approximately 10.00%.
2. Which companies are prominent players in the Nano Biosensors Industry?
Key companies in the market include GBS Inc , AerBetic, Nanowear Inc, Agilent Technologies Inc, ACON Laboratories Inc, Instant NanoBiosensors Co Ltd, Vista Therapeutics Inc, Abbott Point of Care Inc, Bruker Corporation, LamdaGen Corporation.
3. What are the main segments of the Nano Biosensors Industry?
The market segments include Type (Qualitative Analysis), End-user Vertical .
4. Can you provide details about the market size?
The market size is estimated to be USD XX Million as of 2022.
5. What are some drivers contributing to market growth?
; Rise of Miniaturization Trend.
6. What are the notable trends driving market growth?
Healthcare Industry Holds the Significant Share in the Market.
7. Are there any restraints impacting market growth?
Operational Challenges Involving Cross-border Payments.
8. Can you provide examples of recent developments in the market?
N/A
9. What pricing options are available for accessing the report?
Pricing options include single-user, multi-user, and enterprise licenses priced at USD 4750, USD 5250, and USD 8750 respectively.
10. Is the market size provided in terms of value or volume?
The market size is provided in terms of value, measured in Million and volume, measured in K Unit.
11. Are there any specific market keywords associated with the report?
Yes, the market keyword associated with the report is "Nano Biosensors Industry," which aids in identifying and referencing the specific market segment covered.
12. How do I determine which pricing option suits my needs best?
The pricing options vary based on user requirements and access needs. Individual users may opt for single-user licenses, while businesses requiring broader access may choose multi-user or enterprise licenses for cost-effective access to the report.
13. Are there any additional resources or data provided in the Nano Biosensors Industry report?
While the report offers comprehensive insights, it's advisable to review the specific contents or supplementary materials provided to ascertain if additional resources or data are available.
14. How can I stay updated on further developments or reports in the Nano Biosensors Industry?
To stay informed about further developments, trends, and reports in the Nano Biosensors Industry, consider subscribing to industry newsletters, following relevant companies and organizations, or regularly checking reputable industry news sources and publications.
Methodology
Step 1 - Identification of Relevant Samples Size from Population Database


Step 2 - Approaches for Defining Global Market Size (Value, Volume* & Price*)

Note*: In applicable scenarios
Step 3 - Data Sources
Primary Research
- Web Analytics
- Survey Reports
- Research Institute
- Latest Research Reports
- Opinion Leaders
Secondary Research
- Annual Reports
- White Paper
- Latest Press Release
- Industry Association
- Paid Database
- Investor Presentations

Step 4 - Data Triangulation
Involves using different sources of information in order to increase the validity of a study
These sources are likely to be stakeholders in a program - participants, other researchers, program staff, other community members, and so on.
Then we put all data in single framework & apply various statistical tools to find out the dynamic on the market.
During the analysis stage, feedback from the stakeholder groups would be compared to determine areas of agreement as well as areas of divergence
