

Key Insights
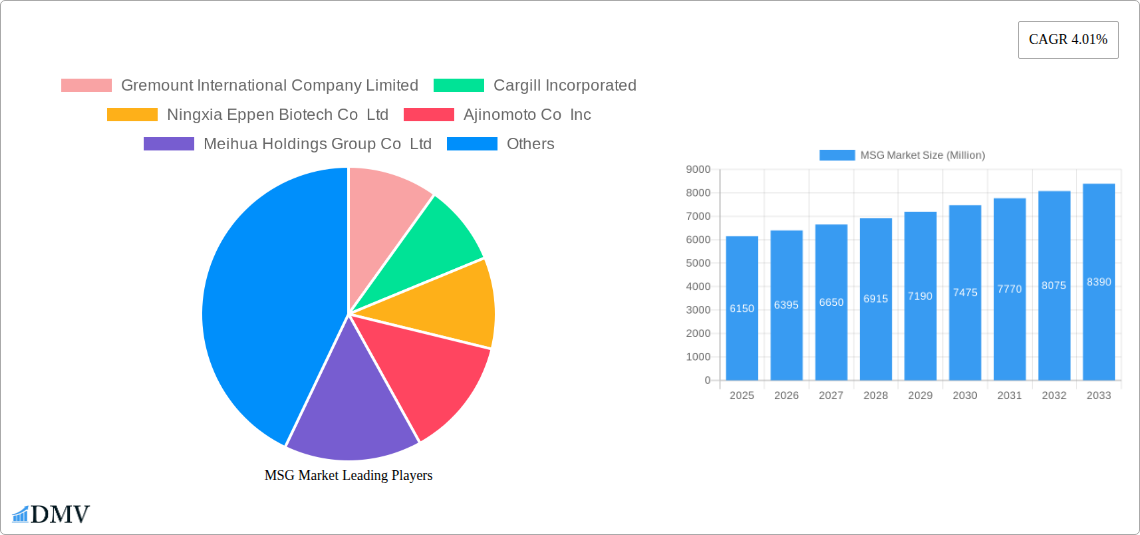
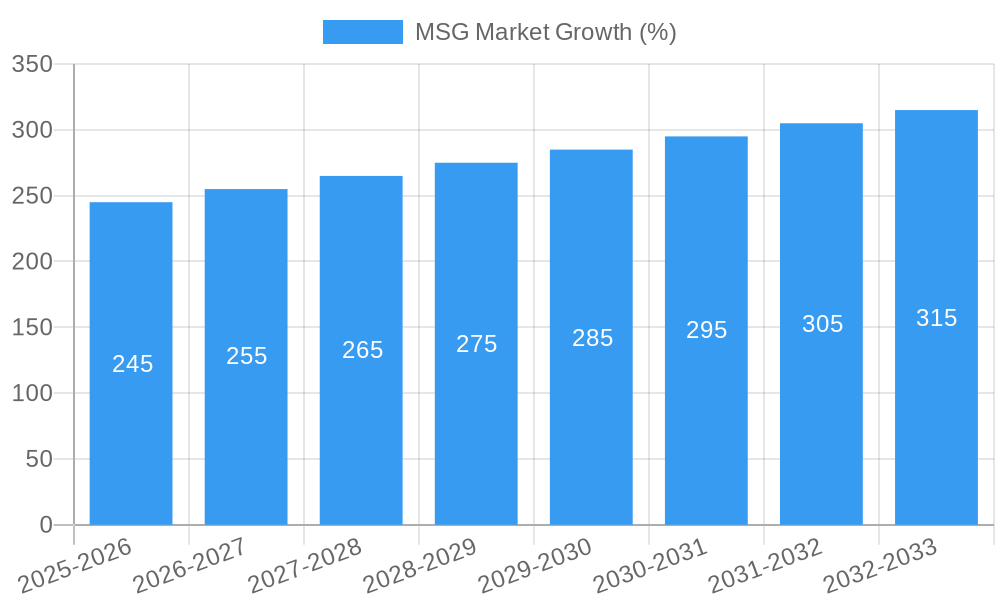
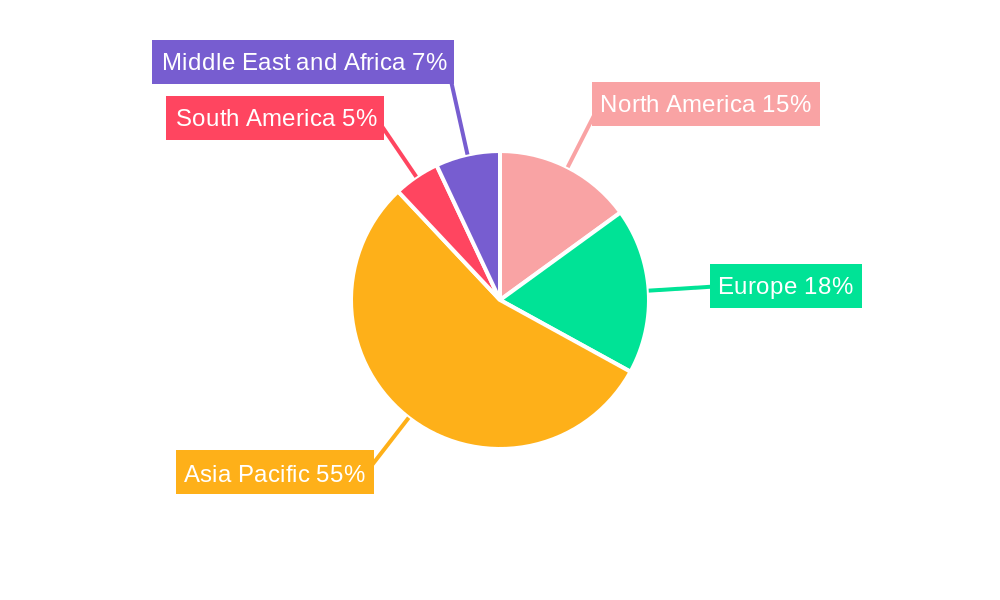
The global monosodium glutamate (MSG) market, valued at $6.15 billion in 2025, is projected to experience robust growth, driven by increasing demand from the food and beverage industry. The compound annual growth rate (CAGR) of 4.01% from 2025 to 2033 reflects a steady expansion fueled by several key factors. The rising popularity of processed foods, particularly noodles, soups, and broths, across various regions significantly boosts MSG consumption. Furthermore, the increasing use of MSG as a flavor enhancer in meat products and seasonings contributes to market growth. The Asia-Pacific region, with its large and growing population and established culinary traditions incorporating MSG, is expected to remain the dominant market segment throughout the forecast period. However, changing consumer preferences towards healthier and natural food alternatives present a potential restraint to market expansion. Companies are actively addressing this by focusing on transparency in labeling and highlighting MSG's natural origin from fermented sugarcane or beet molasses. This strategy aims to alleviate concerns about its potential health impacts while maintaining market share. Competitive dynamics within the market are intense, with major players such as Ajinomoto, Cargill, and Meihua Holdings vying for market leadership through innovation, strategic partnerships, and expansion into new markets.
The significant growth in the MSG market is expected to continue, although at a slightly moderated pace due to increased awareness of health and dietary consciousness. Companies are responding by emphasizing the natural sourcing of MSG and its role in enhancing the flavors of healthier food options, such as low-sodium and plant-based products. Continued innovation in MSG production, including the development of sustainable and efficient processes, is likely to further contribute to market growth. The segmentation of the market based on application (noodles, soups, meat products, etc.) highlights the versatility of MSG and will continue to shape the industry’s trajectory. Regional variations in culinary preferences and food consumption patterns will influence the growth rates across North America, Europe, Asia-Pacific, South America, and the Middle East and Africa, with Asia-Pacific anticipated to retain its position as the leading consumer market.
MSG Market: A Comprehensive Report (2019-2033)
This insightful report provides a detailed analysis of the global Monosodium Glutamate (MSG) market, offering a comprehensive overview of its current state, future trajectory, and key players. With a study period spanning 2019-2033, a base year of 2025, and an estimated year of 2025, this report offers critical insights for stakeholders seeking to navigate this dynamic market. The forecast period covers 2025-2033, while the historical period analyzed is 2019-2024. The market is valued at xx Million in 2025 and is projected to reach xx Million by 2033. This report covers key segments including Noodles, Soups and Broth, Meat Products, Seasonings and Dressings, and Other Applications, and profiles leading companies such as Ajinomoto Co Inc, Cargill Incorporated, and Meihua Holdings Group Co Ltd, among others.
MSG Market Composition & Trends
This section delves into the intricate landscape of the MSG market, evaluating its concentration, innovation drivers, regulatory environment, substitute products, and end-user dynamics. The report analyzes market share distribution, revealing the dominance of key players and emerging competitors. Mergers and acquisitions (M&A) activities are also scrutinized, providing insights into deal values and their impact on market consolidation. The competitive intensity is assessed, with a focus on pricing strategies, product differentiation, and brand loyalty. The report also analyses the regulatory landscape including food safety regulations and labeling requirements impacting the MSG market.
- Market Concentration: Ajinomoto Co Inc and Cargill Incorporated hold a significant market share, with a combined xx% in 2025. The remaining share is distributed among numerous regional and smaller players.
- Innovation Catalysts: Growing demand for convenience foods and the development of new applications in processed food products are driving innovation.
- Regulatory Landscape: Stringent food safety regulations and labeling requirements vary across regions, impacting market access and product development.
- Substitute Products: While there are some substitutes, the unique umami flavor profile of MSG remains unmatched, limiting the threat of substitution.
- M&A Activities: The report details xx Million worth of M&A deals in the MSG market between 2019-2024, indicative of industry consolidation trends.
- End-User Profiles: The report profiles key end-users, focusing on their purchasing patterns, preferences, and growth potential.
MSG Market Industry Evolution
This section analyzes the MSG market's evolutionary path, tracing its growth trajectories, technological advancements, and evolving consumer preferences. The report explores the factors that have shaped the market's development, highlighting key milestones and transformative shifts. Data points such as compound annual growth rates (CAGRs) and adoption rates of new technologies are provided to illustrate market dynamics. The report delves into the impact of changing consumer preferences on the market, including increased health consciousness and demand for natural ingredients. The influence of technological advancements, including automation in production and improved processing techniques, are also discussed.
Leading Regions, Countries, or Segments in MSG Market
This section identifies the leading regions, countries, and application segments within the MSG market. A detailed analysis of the dominant segment(s) is presented, examining the underlying factors contributing to their success.
- Dominant Segment: The Noodles segment is projected to hold the largest market share (xx%) in 2025, driven by the high consumption of noodles in Asia and other parts of the world.
- Key Drivers (Noodles):
- High demand for convenience food.
- Widespread use of MSG in noodle production.
- Relatively low cost of MSG compared to other flavor enhancers.
- Key Drivers (Soups and Broth):
- Growing popularity of ready-to-eat soups and broths.
- MSG’s ability to enhance the flavor profile of soups and broths.
- Key Drivers (Meat Products):
- MSG used as a flavor enhancer in processed meat.
- Increased meat consumption globally driving demand for MSG.
MSG Market Product Innovations
Recent product innovations include the development of MSG with enhanced purity and functionality, including reduced sodium and improved solubility for specific applications. These innovations are aimed at addressing consumer concerns regarding sodium intake and expanding MSG's utility in diverse food products. The development of sustainable and eco-friendly production processes is also gaining traction, aligning with growing environmental awareness.
Propelling Factors for MSG Market Growth
Several factors propel the MSG market's growth. The increasing demand for processed and convenience foods globally is a major driver, as MSG is a key flavor enhancer in numerous products. Technological advancements in MSG production, leading to higher efficiency and cost-effectiveness, further contribute to market expansion. Favorable regulatory environments in certain regions also support market growth.
Obstacles in the MSG Market
The MSG market faces challenges such as negative perceptions among consumers regarding its health effects, despite scientific evidence supporting its safety. Fluctuations in raw material prices and supply chain disruptions can impact production costs and profitability. Intense competition among established players and emerging entrants also pose a challenge.
Future Opportunities in MSG Market
Future opportunities lie in tapping into emerging markets with high growth potential, especially in developing economies. Innovation in product formulations, including low-sodium and organic options, can attract health-conscious consumers. The development of MSG applications in novel food categories and functional foods offers promising avenues for market expansion.
Major Players in the MSG Market Ecosystem
- Ajinomoto Co Inc
- Cargill Incorporated
- Ningxia Eppen Biotech Co Ltd
- Meihua Holdings Group Co Ltd
- Shandong Xinle Monosodium Glutamate Limited Company
- COFCO
- Fufeng Group
- Shandong Qilu Biotechnology Group Co
- Henan Lotus Flower Gourmet Powder Co
- Gremount International Company Limited
Key Developments in MSG Market Industry
- 2022 Q3: Ajinomoto Co Inc launched a new, sustainably produced MSG.
- 2023 Q1: Cargill Incorporated invested xx Million in expanding its MSG production capacity.
- 2024 Q2: A major merger between two MSG producers resulted in a significant increase in market share for the combined entity. (Further details on specific mergers and acquisitions will be provided in the full report.)
Strategic MSG Market Forecast
The MSG market is poised for robust growth, driven by factors such as increasing demand for processed foods, technological innovations, and expansion into new markets. While challenges exist, the long-term outlook remains positive, with significant potential for market expansion and increased profitability for key players.
MSG Market Segmentation
-
1. Application
- 1.1. Noodles, Soups and Broth
- 1.2. Meat Products
- 1.3. Seasonings and Dressings
- 1.4. Other Applications
MSG Market Segmentation By Geography
-
1. North America
- 1.1. United States
- 1.2. Canada
- 1.3. Mexico
- 1.4. Rest of North America
-
2. Europe
- 2.1. Germany
- 2.2. United Kingdom
- 2.3. France
- 2.4. Russia
- 2.5. Rest of Europe
-
3. Asia Pacific
- 3.1. China
- 3.2. Japan
- 3.3. India
- 3.4. Australia
- 3.5. Rest of Asia Pacific
-
4. South America
- 4.1. Brazil
- 4.2. Argentina
- 4.3. Rest of South America
-
5. Middle East and Africa
- 5.1. South Africa
- 5.2. United Arab Emirates
- 5.3. Rest of Middle East and Africa
MSG Market REPORT HIGHLIGHTS
| Aspects | Details |
|---|---|
| Study Period | 2019-2033 |
| Base Year | 2024 |
| Estimated Year | 2025 |
| Forecast Period | 2025-2033 |
| Historical Period | 2019-2024 |
| Growth Rate | CAGR of 4.01% from 2019-2033 |
| Segmentation |
|
Table of Contents
- 1. Introduction
- 1.1. Research Scope
- 1.2. Market Segmentation
- 1.3. Research Methodology
- 1.4. Definitions and Assumptions
- 2. Executive Summary
- 2.1. Introduction
- 3. Market Dynamics
- 3.1. Introduction
- 3.2. Market Drivers
- 3.2.1. Consumer inclination toward functional food and beverages; Increasing Number of Applications and Growing Industrial Use
- 3.3. Market Restrains
- 3.3.1. Increasing Shift Toward Plant-Based Protein
- 3.4. Market Trends
- 3.4.1. Rising Demand for Ready -To-Eat and Processed Food
- 4. Market Factor Analysis
- 4.1. Porters Five Forces
- 4.2. Supply/Value Chain
- 4.3. PESTEL analysis
- 4.4. Market Entropy
- 4.5. Patent/Trademark Analysis
- 5. Global MSG Market Analysis, Insights and Forecast, 2019-2031
- 5.1. Market Analysis, Insights and Forecast - by Application
- 5.1.1. Noodles, Soups and Broth
- 5.1.2. Meat Products
- 5.1.3. Seasonings and Dressings
- 5.1.4. Other Applications
- 5.2. Market Analysis, Insights and Forecast - by Region
- 5.2.1. North America
- 5.2.2. Europe
- 5.2.3. Asia Pacific
- 5.2.4. South America
- 5.2.5. Middle East and Africa
- 5.1. Market Analysis, Insights and Forecast - by Application
- 6. North America MSG Market Analysis, Insights and Forecast, 2019-2031
- 6.1. Market Analysis, Insights and Forecast - by Application
- 6.1.1. Noodles, Soups and Broth
- 6.1.2. Meat Products
- 6.1.3. Seasonings and Dressings
- 6.1.4. Other Applications
- 6.1. Market Analysis, Insights and Forecast - by Application
- 7. Europe MSG Market Analysis, Insights and Forecast, 2019-2031
- 7.1. Market Analysis, Insights and Forecast - by Application
- 7.1.1. Noodles, Soups and Broth
- 7.1.2. Meat Products
- 7.1.3. Seasonings and Dressings
- 7.1.4. Other Applications
- 7.1. Market Analysis, Insights and Forecast - by Application
- 8. Asia Pacific MSG Market Analysis, Insights and Forecast, 2019-2031
- 8.1. Market Analysis, Insights and Forecast - by Application
- 8.1.1. Noodles, Soups and Broth
- 8.1.2. Meat Products
- 8.1.3. Seasonings and Dressings
- 8.1.4. Other Applications
- 8.1. Market Analysis, Insights and Forecast - by Application
- 9. South America MSG Market Analysis, Insights and Forecast, 2019-2031
- 9.1. Market Analysis, Insights and Forecast - by Application
- 9.1.1. Noodles, Soups and Broth
- 9.1.2. Meat Products
- 9.1.3. Seasonings and Dressings
- 9.1.4. Other Applications
- 9.1. Market Analysis, Insights and Forecast - by Application
- 10. Middle East and Africa MSG Market Analysis, Insights and Forecast, 2019-2031
- 10.1. Market Analysis, Insights and Forecast - by Application
- 10.1.1. Noodles, Soups and Broth
- 10.1.2. Meat Products
- 10.1.3. Seasonings and Dressings
- 10.1.4. Other Applications
- 10.1. Market Analysis, Insights and Forecast - by Application
- 11. North America MSG Market Analysis, Insights and Forecast, 2019-2031
- 11.1. Market Analysis, Insights and Forecast - By Country/Sub-region
- 11.1.1. undefined
- 12. Europe MSG Market Analysis, Insights and Forecast, 2019-2031
- 12.1. Market Analysis, Insights and Forecast - By Country/Sub-region
- 12.1.1. undefined
- 13. Asia Pacific MSG Market Analysis, Insights and Forecast, 2019-2031
- 13.1. Market Analysis, Insights and Forecast - By Country/Sub-region
- 13.1.1. undefined
- 14. South America MSG Market Analysis, Insights and Forecast, 2019-2031
- 14.1. Market Analysis, Insights and Forecast - By Country/Sub-region
- 14.1.1. undefined
- 15. Middle East and Africa MSG Market Analysis, Insights and Forecast, 2019-2031
- 15.1. Market Analysis, Insights and Forecast - By Country/Sub-region
- 15.1.1. undefined
- 16. Competitive Analysis
- 16.1. Global Market Share Analysis 2024
- 16.2. Company Profiles
- 16.2.1 Gremount International Company Limited
- 16.2.1.1. Overview
- 16.2.1.2. Products
- 16.2.1.3. SWOT Analysis
- 16.2.1.4. Recent Developments
- 16.2.1.5. Financials (Based on Availability)
- 16.2.2 Cargill Incorporated
- 16.2.2.1. Overview
- 16.2.2.2. Products
- 16.2.2.3. SWOT Analysis
- 16.2.2.4. Recent Developments
- 16.2.2.5. Financials (Based on Availability)
- 16.2.3 Ningxia Eppen Biotech Co Ltd
- 16.2.3.1. Overview
- 16.2.3.2. Products
- 16.2.3.3. SWOT Analysis
- 16.2.3.4. Recent Developments
- 16.2.3.5. Financials (Based on Availability)
- 16.2.4 Ajinomoto Co Inc
- 16.2.4.1. Overview
- 16.2.4.2. Products
- 16.2.4.3. SWOT Analysis
- 16.2.4.4. Recent Developments
- 16.2.4.5. Financials (Based on Availability)
- 16.2.5 Meihua Holdings Group Co Ltd
- 16.2.5.1. Overview
- 16.2.5.2. Products
- 16.2.5.3. SWOT Analysis
- 16.2.5.4. Recent Developments
- 16.2.5.5. Financials (Based on Availability)
- 16.2.6 Shandong Xinle Monosodium Glutamate Limited Company*List Not Exhaustive
- 16.2.6.1. Overview
- 16.2.6.2. Products
- 16.2.6.3. SWOT Analysis
- 16.2.6.4. Recent Developments
- 16.2.6.5. Financials (Based on Availability)
- 16.2.7 COFCO
- 16.2.7.1. Overview
- 16.2.7.2. Products
- 16.2.7.3. SWOT Analysis
- 16.2.7.4. Recent Developments
- 16.2.7.5. Financials (Based on Availability)
- 16.2.8 Fufeng Group
- 16.2.8.1. Overview
- 16.2.8.2. Products
- 16.2.8.3. SWOT Analysis
- 16.2.8.4. Recent Developments
- 16.2.8.5. Financials (Based on Availability)
- 16.2.9 Shandong Qilu Biotechnology Group Co
- 16.2.9.1. Overview
- 16.2.9.2. Products
- 16.2.9.3. SWOT Analysis
- 16.2.9.4. Recent Developments
- 16.2.9.5. Financials (Based on Availability)
- 16.2.10 Henan Lotus Flower Gourmet Powder Co
- 16.2.10.1. Overview
- 16.2.10.2. Products
- 16.2.10.3. SWOT Analysis
- 16.2.10.4. Recent Developments
- 16.2.10.5. Financials (Based on Availability)
- 16.2.1 Gremount International Company Limited
List of Figures
- Figure 1: Global MSG Market Revenue Breakdown (Million, %) by Region 2024 & 2032
- Figure 2: Global MSG Market Volume Breakdown (K Tons, %) by Region 2024 & 2032
- Figure 3: North America MSG Market Revenue (Million), by Country 2024 & 2032
- Figure 4: North America MSG Market Volume (K Tons), by Country 2024 & 2032
- Figure 5: North America MSG Market Revenue Share (%), by Country 2024 & 2032
- Figure 6: North America MSG Market Volume Share (%), by Country 2024 & 2032
- Figure 7: Europe MSG Market Revenue (Million), by Country 2024 & 2032
- Figure 8: Europe MSG Market Volume (K Tons), by Country 2024 & 2032
- Figure 9: Europe MSG Market Revenue Share (%), by Country 2024 & 2032
- Figure 10: Europe MSG Market Volume Share (%), by Country 2024 & 2032
- Figure 11: Asia Pacific MSG Market Revenue (Million), by Country 2024 & 2032
- Figure 12: Asia Pacific MSG Market Volume (K Tons), by Country 2024 & 2032
- Figure 13: Asia Pacific MSG Market Revenue Share (%), by Country 2024 & 2032
- Figure 14: Asia Pacific MSG Market Volume Share (%), by Country 2024 & 2032
- Figure 15: South America MSG Market Revenue (Million), by Country 2024 & 2032
- Figure 16: South America MSG Market Volume (K Tons), by Country 2024 & 2032
- Figure 17: South America MSG Market Revenue Share (%), by Country 2024 & 2032
- Figure 18: South America MSG Market Volume Share (%), by Country 2024 & 2032
- Figure 19: Middle East and Africa MSG Market Revenue (Million), by Country 2024 & 2032
- Figure 20: Middle East and Africa MSG Market Volume (K Tons), by Country 2024 & 2032
- Figure 21: Middle East and Africa MSG Market Revenue Share (%), by Country 2024 & 2032
- Figure 22: Middle East and Africa MSG Market Volume Share (%), by Country 2024 & 2032
- Figure 23: North America MSG Market Revenue (Million), by Application 2024 & 2032
- Figure 24: North America MSG Market Volume (K Tons), by Application 2024 & 2032
- Figure 25: North America MSG Market Revenue Share (%), by Application 2024 & 2032
- Figure 26: North America MSG Market Volume Share (%), by Application 2024 & 2032
- Figure 27: North America MSG Market Revenue (Million), by Country 2024 & 2032
- Figure 28: North America MSG Market Volume (K Tons), by Country 2024 & 2032
- Figure 29: North America MSG Market Revenue Share (%), by Country 2024 & 2032
- Figure 30: North America MSG Market Volume Share (%), by Country 2024 & 2032
- Figure 31: Europe MSG Market Revenue (Million), by Application 2024 & 2032
- Figure 32: Europe MSG Market Volume (K Tons), by Application 2024 & 2032
- Figure 33: Europe MSG Market Revenue Share (%), by Application 2024 & 2032
- Figure 34: Europe MSG Market Volume Share (%), by Application 2024 & 2032
- Figure 35: Europe MSG Market Revenue (Million), by Country 2024 & 2032
- Figure 36: Europe MSG Market Volume (K Tons), by Country 2024 & 2032
- Figure 37: Europe MSG Market Revenue Share (%), by Country 2024 & 2032
- Figure 38: Europe MSG Market Volume Share (%), by Country 2024 & 2032
- Figure 39: Asia Pacific MSG Market Revenue (Million), by Application 2024 & 2032
- Figure 40: Asia Pacific MSG Market Volume (K Tons), by Application 2024 & 2032
- Figure 41: Asia Pacific MSG Market Revenue Share (%), by Application 2024 & 2032
- Figure 42: Asia Pacific MSG Market Volume Share (%), by Application 2024 & 2032
- Figure 43: Asia Pacific MSG Market Revenue (Million), by Country 2024 & 2032
- Figure 44: Asia Pacific MSG Market Volume (K Tons), by Country 2024 & 2032
- Figure 45: Asia Pacific MSG Market Revenue Share (%), by Country 2024 & 2032
- Figure 46: Asia Pacific MSG Market Volume Share (%), by Country 2024 & 2032
- Figure 47: South America MSG Market Revenue (Million), by Application 2024 & 2032
- Figure 48: South America MSG Market Volume (K Tons), by Application 2024 & 2032
- Figure 49: South America MSG Market Revenue Share (%), by Application 2024 & 2032
- Figure 50: South America MSG Market Volume Share (%), by Application 2024 & 2032
- Figure 51: South America MSG Market Revenue (Million), by Country 2024 & 2032
- Figure 52: South America MSG Market Volume (K Tons), by Country 2024 & 2032
- Figure 53: South America MSG Market Revenue Share (%), by Country 2024 & 2032
- Figure 54: South America MSG Market Volume Share (%), by Country 2024 & 2032
- Figure 55: Middle East and Africa MSG Market Revenue (Million), by Application 2024 & 2032
- Figure 56: Middle East and Africa MSG Market Volume (K Tons), by Application 2024 & 2032
- Figure 57: Middle East and Africa MSG Market Revenue Share (%), by Application 2024 & 2032
- Figure 58: Middle East and Africa MSG Market Volume Share (%), by Application 2024 & 2032
- Figure 59: Middle East and Africa MSG Market Revenue (Million), by Country 2024 & 2032
- Figure 60: Middle East and Africa MSG Market Volume (K Tons), by Country 2024 & 2032
- Figure 61: Middle East and Africa MSG Market Revenue Share (%), by Country 2024 & 2032
- Figure 62: Middle East and Africa MSG Market Volume Share (%), by Country 2024 & 2032
List of Tables
- Table 1: Global MSG Market Revenue Million Forecast, by Region 2019 & 2032
- Table 2: Global MSG Market Volume K Tons Forecast, by Region 2019 & 2032
- Table 3: Global MSG Market Revenue Million Forecast, by Application 2019 & 2032
- Table 4: Global MSG Market Volume K Tons Forecast, by Application 2019 & 2032
- Table 5: Global MSG Market Revenue Million Forecast, by Region 2019 & 2032
- Table 6: Global MSG Market Volume K Tons Forecast, by Region 2019 & 2032
- Table 7: Global MSG Market Revenue Million Forecast, by Country 2019 & 2032
- Table 8: Global MSG Market Volume K Tons Forecast, by Country 2019 & 2032
- Table 9: Global MSG Market Revenue Million Forecast, by Country 2019 & 2032
- Table 10: Global MSG Market Volume K Tons Forecast, by Country 2019 & 2032
- Table 11: Global MSG Market Revenue Million Forecast, by Country 2019 & 2032
- Table 12: Global MSG Market Volume K Tons Forecast, by Country 2019 & 2032
- Table 13: Global MSG Market Revenue Million Forecast, by Country 2019 & 2032
- Table 14: Global MSG Market Volume K Tons Forecast, by Country 2019 & 2032
- Table 15: Global MSG Market Revenue Million Forecast, by Country 2019 & 2032
- Table 16: Global MSG Market Volume K Tons Forecast, by Country 2019 & 2032
- Table 17: Global MSG Market Revenue Million Forecast, by Application 2019 & 2032
- Table 18: Global MSG Market Volume K Tons Forecast, by Application 2019 & 2032
- Table 19: Global MSG Market Revenue Million Forecast, by Country 2019 & 2032
- Table 20: Global MSG Market Volume K Tons Forecast, by Country 2019 & 2032
- Table 21: United States MSG Market Revenue (Million) Forecast, by Application 2019 & 2032
- Table 22: United States MSG Market Volume (K Tons) Forecast, by Application 2019 & 2032
- Table 23: Canada MSG Market Revenue (Million) Forecast, by Application 2019 & 2032
- Table 24: Canada MSG Market Volume (K Tons) Forecast, by Application 2019 & 2032
- Table 25: Mexico MSG Market Revenue (Million) Forecast, by Application 2019 & 2032
- Table 26: Mexico MSG Market Volume (K Tons) Forecast, by Application 2019 & 2032
- Table 27: Rest of North America MSG Market Revenue (Million) Forecast, by Application 2019 & 2032
- Table 28: Rest of North America MSG Market Volume (K Tons) Forecast, by Application 2019 & 2032
- Table 29: Global MSG Market Revenue Million Forecast, by Application 2019 & 2032
- Table 30: Global MSG Market Volume K Tons Forecast, by Application 2019 & 2032
- Table 31: Global MSG Market Revenue Million Forecast, by Country 2019 & 2032
- Table 32: Global MSG Market Volume K Tons Forecast, by Country 2019 & 2032
- Table 33: Germany MSG Market Revenue (Million) Forecast, by Application 2019 & 2032
- Table 34: Germany MSG Market Volume (K Tons) Forecast, by Application 2019 & 2032
- Table 35: United Kingdom MSG Market Revenue (Million) Forecast, by Application 2019 & 2032
- Table 36: United Kingdom MSG Market Volume (K Tons) Forecast, by Application 2019 & 2032
- Table 37: France MSG Market Revenue (Million) Forecast, by Application 2019 & 2032
- Table 38: France MSG Market Volume (K Tons) Forecast, by Application 2019 & 2032
- Table 39: Russia MSG Market Revenue (Million) Forecast, by Application 2019 & 2032
- Table 40: Russia MSG Market Volume (K Tons) Forecast, by Application 2019 & 2032
- Table 41: Rest of Europe MSG Market Revenue (Million) Forecast, by Application 2019 & 2032
- Table 42: Rest of Europe MSG Market Volume (K Tons) Forecast, by Application 2019 & 2032
- Table 43: Global MSG Market Revenue Million Forecast, by Application 2019 & 2032
- Table 44: Global MSG Market Volume K Tons Forecast, by Application 2019 & 2032
- Table 45: Global MSG Market Revenue Million Forecast, by Country 2019 & 2032
- Table 46: Global MSG Market Volume K Tons Forecast, by Country 2019 & 2032
- Table 47: China MSG Market Revenue (Million) Forecast, by Application 2019 & 2032
- Table 48: China MSG Market Volume (K Tons) Forecast, by Application 2019 & 2032
- Table 49: Japan MSG Market Revenue (Million) Forecast, by Application 2019 & 2032
- Table 50: Japan MSG Market Volume (K Tons) Forecast, by Application 2019 & 2032
- Table 51: India MSG Market Revenue (Million) Forecast, by Application 2019 & 2032
- Table 52: India MSG Market Volume (K Tons) Forecast, by Application 2019 & 2032
- Table 53: Australia MSG Market Revenue (Million) Forecast, by Application 2019 & 2032
- Table 54: Australia MSG Market Volume (K Tons) Forecast, by Application 2019 & 2032
- Table 55: Rest of Asia Pacific MSG Market Revenue (Million) Forecast, by Application 2019 & 2032
- Table 56: Rest of Asia Pacific MSG Market Volume (K Tons) Forecast, by Application 2019 & 2032
- Table 57: Global MSG Market Revenue Million Forecast, by Application 2019 & 2032
- Table 58: Global MSG Market Volume K Tons Forecast, by Application 2019 & 2032
- Table 59: Global MSG Market Revenue Million Forecast, by Country 2019 & 2032
- Table 60: Global MSG Market Volume K Tons Forecast, by Country 2019 & 2032
- Table 61: Brazil MSG Market Revenue (Million) Forecast, by Application 2019 & 2032
- Table 62: Brazil MSG Market Volume (K Tons) Forecast, by Application 2019 & 2032
- Table 63: Argentina MSG Market Revenue (Million) Forecast, by Application 2019 & 2032
- Table 64: Argentina MSG Market Volume (K Tons) Forecast, by Application 2019 & 2032
- Table 65: Rest of South America MSG Market Revenue (Million) Forecast, by Application 2019 & 2032
- Table 66: Rest of South America MSG Market Volume (K Tons) Forecast, by Application 2019 & 2032
- Table 67: Global MSG Market Revenue Million Forecast, by Application 2019 & 2032
- Table 68: Global MSG Market Volume K Tons Forecast, by Application 2019 & 2032
- Table 69: Global MSG Market Revenue Million Forecast, by Country 2019 & 2032
- Table 70: Global MSG Market Volume K Tons Forecast, by Country 2019 & 2032
- Table 71: South Africa MSG Market Revenue (Million) Forecast, by Application 2019 & 2032
- Table 72: South Africa MSG Market Volume (K Tons) Forecast, by Application 2019 & 2032
- Table 73: United Arab Emirates MSG Market Revenue (Million) Forecast, by Application 2019 & 2032
- Table 74: United Arab Emirates MSG Market Volume (K Tons) Forecast, by Application 2019 & 2032
- Table 75: Rest of Middle East and Africa MSG Market Revenue (Million) Forecast, by Application 2019 & 2032
- Table 76: Rest of Middle East and Africa MSG Market Volume (K Tons) Forecast, by Application 2019 & 2032
Frequently Asked Questions
1. What is the projected Compound Annual Growth Rate (CAGR) of the MSG Market?
The projected CAGR is approximately 4.01%.
2. Which companies are prominent players in the MSG Market?
Key companies in the market include Gremount International Company Limited, Cargill Incorporated, Ningxia Eppen Biotech Co Ltd, Ajinomoto Co Inc, Meihua Holdings Group Co Ltd, Shandong Xinle Monosodium Glutamate Limited Company*List Not Exhaustive, COFCO, Fufeng Group, Shandong Qilu Biotechnology Group Co, Henan Lotus Flower Gourmet Powder Co.
3. What are the main segments of the MSG Market?
The market segments include Application.
4. Can you provide details about the market size?
The market size is estimated to be USD 6.15 Million as of 2022.
5. What are some drivers contributing to market growth?
Consumer inclination toward functional food and beverages; Increasing Number of Applications and Growing Industrial Use.
6. What are the notable trends driving market growth?
Rising Demand for Ready -To-Eat and Processed Food.
7. Are there any restraints impacting market growth?
Increasing Shift Toward Plant-Based Protein.
8. Can you provide examples of recent developments in the market?
N/A
9. What pricing options are available for accessing the report?
Pricing options include single-user, multi-user, and enterprise licenses priced at USD 4750, USD 5250, and USD 8750 respectively.
10. Is the market size provided in terms of value or volume?
The market size is provided in terms of value, measured in Million and volume, measured in K Tons.
11. Are there any specific market keywords associated with the report?
Yes, the market keyword associated with the report is "MSG Market," which aids in identifying and referencing the specific market segment covered.
12. How do I determine which pricing option suits my needs best?
The pricing options vary based on user requirements and access needs. Individual users may opt for single-user licenses, while businesses requiring broader access may choose multi-user or enterprise licenses for cost-effective access to the report.
13. Are there any additional resources or data provided in the MSG Market report?
While the report offers comprehensive insights, it's advisable to review the specific contents or supplementary materials provided to ascertain if additional resources or data are available.
14. How can I stay updated on further developments or reports in the MSG Market?
To stay informed about further developments, trends, and reports in the MSG Market, consider subscribing to industry newsletters, following relevant companies and organizations, or regularly checking reputable industry news sources and publications.
Methodology
Step 1 - Identification of Relevant Samples Size from Population Database


Step 2 - Approaches for Defining Global Market Size (Value, Volume* & Price*)

Note*: In applicable scenarios
Step 3 - Data Sources
Primary Research
- Web Analytics
- Survey Reports
- Research Institute
- Latest Research Reports
- Opinion Leaders
Secondary Research
- Annual Reports
- White Paper
- Latest Press Release
- Industry Association
- Paid Database
- Investor Presentations

Step 4 - Data Triangulation
Involves using different sources of information in order to increase the validity of a study
These sources are likely to be stakeholders in a program - participants, other researchers, program staff, other community members, and so on.
Then we put all data in single framework & apply various statistical tools to find out the dynamic on the market.
During the analysis stage, feedback from the stakeholder groups would be compared to determine areas of agreement as well as areas of divergence
