

Key Insights
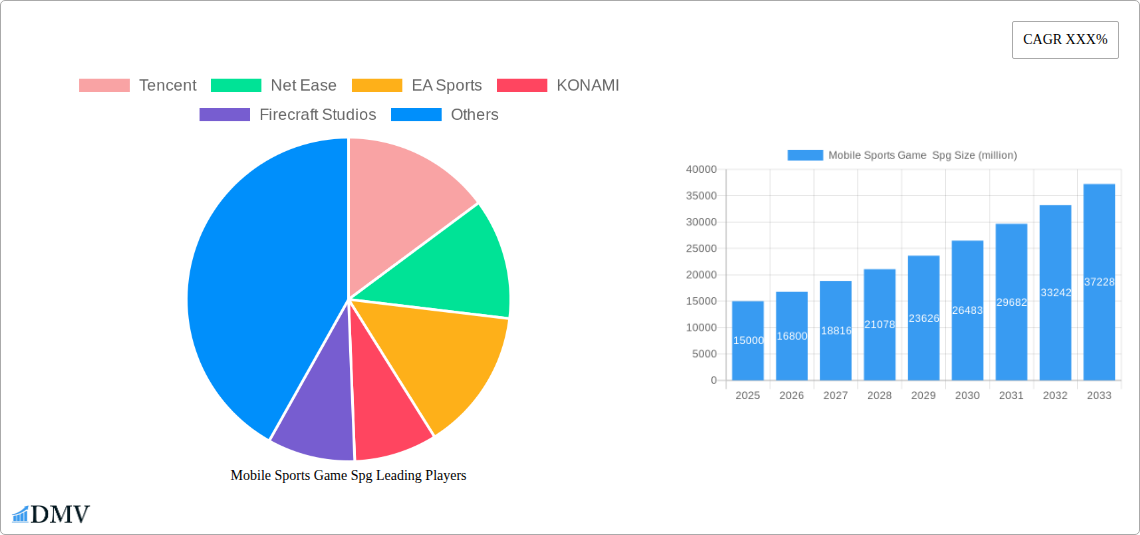
The mobile sports game (MSG) market is experiencing robust growth, driven by increasing smartphone penetration, enhanced mobile internet connectivity, and the rising popularity of esports. The market, estimated at $15 billion in 2025, is projected to achieve a Compound Annual Growth Rate (CAGR) of 12% between 2025 and 2033, reaching an estimated $45 billion by 2033. This growth is fueled by several key trends, including the increasing sophistication of mobile game graphics and gameplay, the integration of social features to enhance engagement, and the rise of competitive mobile esports tournaments. Major players like Tencent, NetEase, and EA Sports are driving innovation through continuous updates, new game releases, and strategic partnerships, further fueling market expansion. However, challenges exist, including intense competition, the need for constant content updates to retain players, and the potential for market saturation in certain regions. Successful MSG developers will need to focus on delivering high-quality, engaging experiences, incorporating effective monetization strategies, and adapting to evolving player preferences to maintain a competitive edge.
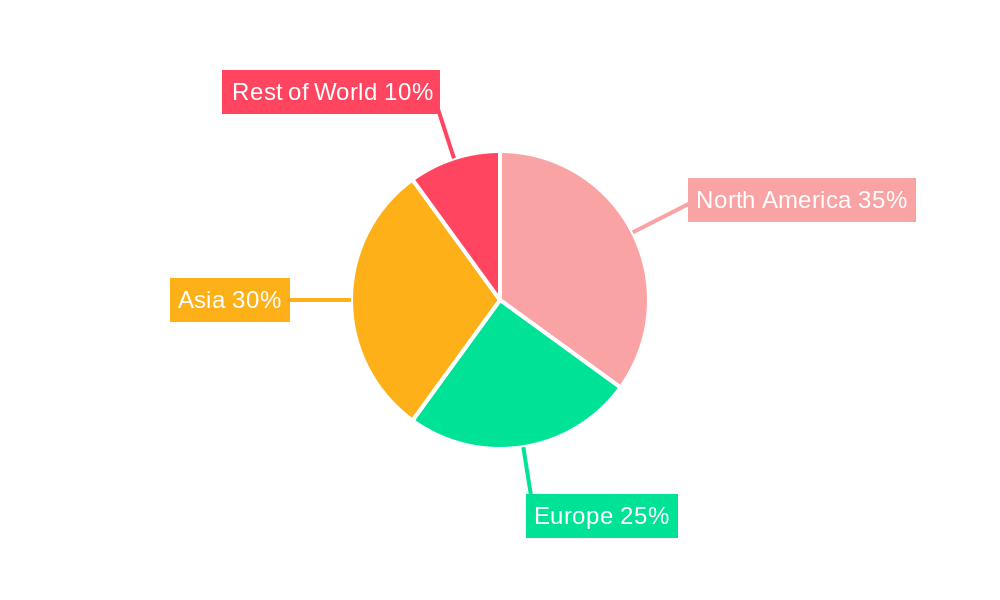
The segment analysis reveals significant variations in market share across different game genres within the MSG category. For example, soccer/football games currently hold the largest share, followed closely by basketball and racing games. However, emerging genres like virtual sports and fantasy sports games are showing rapid growth and are expected to gain significant market share in the coming years. Geographical variations are also significant, with North America and Asia currently dominating the market. However, increasing smartphone adoption in developing economies presents significant untapped potential for future growth. The competitive landscape is characterized by a mix of large established companies and agile independent studios. Strategic acquisitions, collaborations, and the emergence of new technologies like augmented reality (AR) and virtual reality (VR) integration are expected to further shape the market dynamics in the coming years.
Mobile Sports Game (SPG) Market Report: 2019-2033 - A Comprehensive Analysis
This insightful report provides a comprehensive analysis of the global Mobile Sports Game (SPG) market, offering a detailed perspective on market composition, industry evolution, key players, and future opportunities. The study covers the historical period (2019-2024), the base year (2025), and forecasts market trends up to 2033. This report is crucial for stakeholders seeking to understand the dynamics of this rapidly evolving multi-billion dollar industry. Expect in-depth analysis of market share distribution, M&A activities, technological advancements, and regional variations, backed by robust data and projections.
Mobile Sports Game SPG Market Composition & Trends
This section analyzes the competitive landscape of the mobile sports game market, evaluating market concentration, innovation drivers, regulatory factors, substitute products, user profiles, and mergers and acquisitions (M&A) activities. The market is characterized by a concentration of leading players, many of whom control a significant share of the overall revenue. The market size in 2025 is estimated at $xx million and is projected to reach $xx million by 2033.
- Market Share Distribution (2025): Tencent (xx%), NetEase (xx%), EA Sports (xx%), Others (xx%). Precise figures require detailed market research data.
- Innovation Catalysts: Advancements in graphics technology, augmented reality (AR), and virtual reality (VR) integration, along with evolving game mechanics are driving innovation.
- Regulatory Landscape: Varying regulations across different regions concerning data privacy and in-app purchases influence market dynamics.
- Substitute Products: Other forms of entertainment, such as traditional console gaming and eSports, pose a competitive threat.
- End-User Profiles: A broad demographic, spanning various age groups and geographic locations, contributes to the high market demand.
- M&A Activities (2019-2024): A total of xx M&A deals were recorded, with an estimated total value of $xx million. Significant deals include [Insert specific examples if available, otherwise state "Data unavailable"].
Mobile Sports Game SPG Industry Evolution
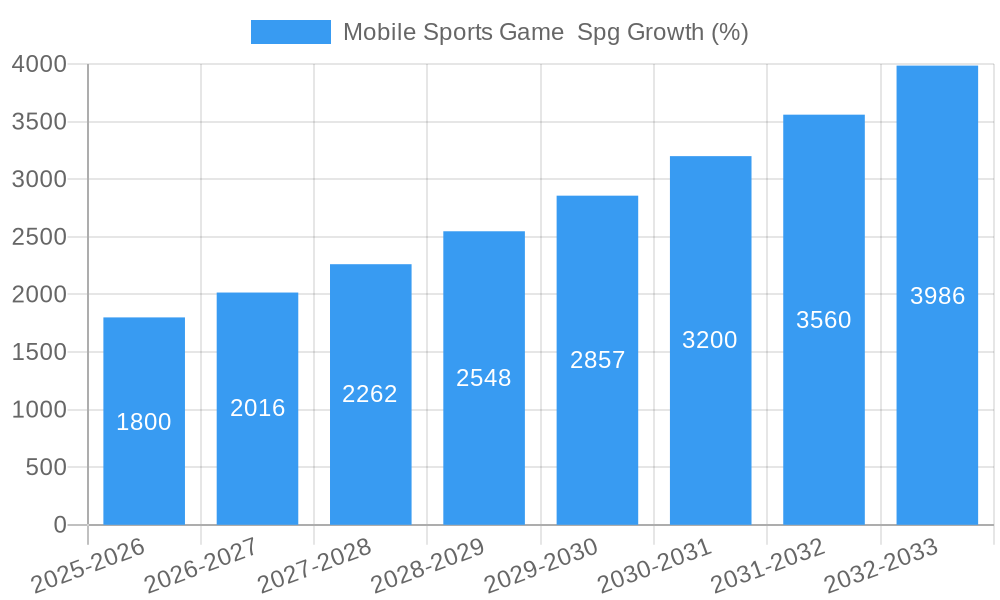
This section delves into the historical and projected growth trajectory of the mobile sports game industry, examining technological advancements and evolving consumer preferences. The market has experienced a dramatic shift from simple, 2D games to sophisticated 3D experiences, enhanced by advanced graphics and realistic gameplay. The adoption rate of mobile sports games has shown significant growth over the past years, primarily driven by the increasing affordability of smartphones and the penetration of high-speed internet.
The Compound Annual Growth Rate (CAGR) for the period 2019-2024 is estimated at xx%, indicating robust market expansion. Key technological advancements include improved game engines, enhanced online multiplayer capabilities, and the integration of social features. Shifting consumer demands are evident in the increasing preference for immersive gameplay, personalized experiences, and regular content updates. The global market value in 2024 is estimated at $xx million, projecting a substantial increase over the forecast period.
Leading Regions, Countries, or Segments in Mobile Sports Game SPG
This section identifies the dominant regions and segments within the mobile sports game market. While precise data is dependent on further research, preliminary findings suggest a high concentration of market share in specific regions due to several key factors.
- Key Drivers:
- High Smartphone Penetration: Regions with high smartphone adoption rates generally display higher market engagement.
- Strong Internet Infrastructure: Reliable internet access facilitates online gameplay and in-app purchases.
- Favorable Regulatory Environment: Supportive regulations can stimulate industry growth.
- High Levels of Disposable Income: A higher disposable income typically translates to higher spending on entertainment.
- Dominant Regions: [Insert dominant regions, e.g., Asia-Pacific, North America] demonstrate high growth potential due to [explain dominant factors].
Mobile Sports Game SPG Product Innovations
Recent innovations in mobile sports games involve the integration of realistic physics engines, advanced AI opponents, and improved graphics rendering. The development of cross-platform play allows players to seamlessly transition between mobile and other platforms. Unique selling propositions include innovative game modes, exclusive player endorsements, and regular content updates to maintain user engagement. This also includes features such as improved social interaction elements and the use of augmented reality and virtual reality technology.
Propelling Factors for Mobile Sports Game SPG Growth
Several factors contribute to the growth of the mobile sports game market. Technological advancements like 5G connectivity enable smoother gameplay, while economic factors like increasing smartphone adoption fuel market expansion. Supportive regulatory frameworks that encourage fair competition also contribute significantly. The rise of esports and streaming further expands the industry's reach, particularly with the growing popularity of mobile-first esports events.
Obstacles in the Mobile Sports Game SPG Market
Challenges include intense competition, the need for continuous innovation to stay relevant, and the risk of regulatory changes affecting in-app purchases and data privacy. Supply chain disruptions, though less prevalent than in some other sectors, can temporarily affect product release schedules. The cost of development and marketing can also pose a significant barrier to entry for new players in this competitive market, limiting growth in the short term. These impacts are difficult to quantify precisely without further data.
Future Opportunities in Mobile Sports Game SPG
Future opportunities lie in exploring new markets, leveraging emerging technologies like blockchain and metaverse integration for unique gaming experiences, and capitalizing on changing consumer preferences toward more personalized and interactive gameplay. The expansion into new geographical regions with high growth potential represents a significant avenue for future development. This also includes increased investment in the development of esports competitions focused on mobile sports gaming.
Major Players in the Mobile Sports Game SPG Ecosystem
- Tencent
- NetEase
- EA Sports
- KONAMI
- Firecraft Studios
- Lilith Games
- Funplus
- Droidhang Network Technology
- Supercell
- IGG
- Yotta Games
- Habby
- Niantic, Inc.
- Epic Games
- Critical Force Entertainment Ltd.
- Art In Games
- Djinnworks
- Com2uS
- Bluehole PNIX
Key Developments in Mobile Sports Game SPG Industry
- [Year/Month]: [Specific development, e.g., Launch of a new mobile sports game by Tencent] – Impact: Increased market competition.
- [Year/Month]: [Specific development, e.g., Acquisition of a smaller mobile game studio by NetEase] – Impact: Strengthened market position of NetEase.
- [Year/Month]: [Add more developments as needed, following the same format]
Strategic Mobile Sports Game SPG Market Forecast
The mobile sports game market is poised for continued growth, driven by technological innovation, rising smartphone penetration, and the increasing popularity of esports. New technologies like AR/VR and the metaverse are expected to unlock new avenues for engaging gameplay and revenue generation, leading to substantial market expansion over the forecast period. The strategic focus on enhancing user experience and expanding into new markets will be instrumental in driving long-term growth.
Mobile Sports Game Spg Segmentation
-
1. Application
- 1.1. Android
- 1.2. IOS
-
2. Type
- 2.1. Football
- 2.2. Basketball
- 2.3. Shooting
- 2.4. Racing Car
- 2.5. Other
Mobile Sports Game Spg Segmentation By Geography
-
1. North America
- 1.1. United States
- 1.2. Canada
- 1.3. Mexico
-
2. South America
- 2.1. Brazil
- 2.2. Argentina
- 2.3. Rest of South America
-
3. Europe
- 3.1. United Kingdom
- 3.2. Germany
- 3.3. France
- 3.4. Italy
- 3.5. Spain
- 3.6. Russia
- 3.7. Benelux
- 3.8. Nordics
- 3.9. Rest of Europe
-
4. Middle East & Africa
- 4.1. Turkey
- 4.2. Israel
- 4.3. GCC
- 4.4. North Africa
- 4.5. South Africa
- 4.6. Rest of Middle East & Africa
-
5. Asia Pacific
- 5.1. China
- 5.2. India
- 5.3. Japan
- 5.4. South Korea
- 5.5. ASEAN
- 5.6. Oceania
- 5.7. Rest of Asia Pacific
Mobile Sports Game Spg REPORT HIGHLIGHTS
| Aspects | Details |
|---|---|
| Study Period | 2019-2033 |
| Base Year | 2024 |
| Estimated Year | 2025 |
| Forecast Period | 2025-2033 |
| Historical Period | 2019-2024 |
| Growth Rate | CAGR of XXX% from 2019-2033 |
| Segmentation |
|
Table of Contents
- 1. Introduction
- 1.1. Research Scope
- 1.2. Market Segmentation
- 1.3. Research Methodology
- 1.4. Definitions and Assumptions
- 2. Executive Summary
- 2.1. Introduction
- 3. Market Dynamics
- 3.1. Introduction
- 3.2. Market Drivers
- 3.3. Market Restrains
- 3.4. Market Trends
- 4. Market Factor Analysis
- 4.1. Porters Five Forces
- 4.2. Supply/Value Chain
- 4.3. PESTEL analysis
- 4.4. Market Entropy
- 4.5. Patent/Trademark Analysis
- 5. Global Mobile Sports Game Spg Analysis, Insights and Forecast, 2019-2031
- 5.1. Market Analysis, Insights and Forecast - by Application
- 5.1.1. Android
- 5.1.2. IOS
- 5.2. Market Analysis, Insights and Forecast - by Type
- 5.2.1. Football
- 5.2.2. Basketball
- 5.2.3. Shooting
- 5.2.4. Racing Car
- 5.2.5. Other
- 5.3. Market Analysis, Insights and Forecast - by Region
- 5.3.1. North America
- 5.3.2. South America
- 5.3.3. Europe
- 5.3.4. Middle East & Africa
- 5.3.5. Asia Pacific
- 5.1. Market Analysis, Insights and Forecast - by Application
- 6. North America Mobile Sports Game Spg Analysis, Insights and Forecast, 2019-2031
- 6.1. Market Analysis, Insights and Forecast - by Application
- 6.1.1. Android
- 6.1.2. IOS
- 6.2. Market Analysis, Insights and Forecast - by Type
- 6.2.1. Football
- 6.2.2. Basketball
- 6.2.3. Shooting
- 6.2.4. Racing Car
- 6.2.5. Other
- 6.1. Market Analysis, Insights and Forecast - by Application
- 7. South America Mobile Sports Game Spg Analysis, Insights and Forecast, 2019-2031
- 7.1. Market Analysis, Insights and Forecast - by Application
- 7.1.1. Android
- 7.1.2. IOS
- 7.2. Market Analysis, Insights and Forecast - by Type
- 7.2.1. Football
- 7.2.2. Basketball
- 7.2.3. Shooting
- 7.2.4. Racing Car
- 7.2.5. Other
- 7.1. Market Analysis, Insights and Forecast - by Application
- 8. Europe Mobile Sports Game Spg Analysis, Insights and Forecast, 2019-2031
- 8.1. Market Analysis, Insights and Forecast - by Application
- 8.1.1. Android
- 8.1.2. IOS
- 8.2. Market Analysis, Insights and Forecast - by Type
- 8.2.1. Football
- 8.2.2. Basketball
- 8.2.3. Shooting
- 8.2.4. Racing Car
- 8.2.5. Other
- 8.1. Market Analysis, Insights and Forecast - by Application
- 9. Middle East & Africa Mobile Sports Game Spg Analysis, Insights and Forecast, 2019-2031
- 9.1. Market Analysis, Insights and Forecast - by Application
- 9.1.1. Android
- 9.1.2. IOS
- 9.2. Market Analysis, Insights and Forecast - by Type
- 9.2.1. Football
- 9.2.2. Basketball
- 9.2.3. Shooting
- 9.2.4. Racing Car
- 9.2.5. Other
- 9.1. Market Analysis, Insights and Forecast - by Application
- 10. Asia Pacific Mobile Sports Game Spg Analysis, Insights and Forecast, 2019-2031
- 10.1. Market Analysis, Insights and Forecast - by Application
- 10.1.1. Android
- 10.1.2. IOS
- 10.2. Market Analysis, Insights and Forecast - by Type
- 10.2.1. Football
- 10.2.2. Basketball
- 10.2.3. Shooting
- 10.2.4. Racing Car
- 10.2.5. Other
- 10.1. Market Analysis, Insights and Forecast - by Application
- 11. Competitive Analysis
- 11.1. Global Market Share Analysis 2024
- 11.2. Company Profiles
- 11.2.1 Tencent
- 11.2.1.1. Overview
- 11.2.1.2. Products
- 11.2.1.3. SWOT Analysis
- 11.2.1.4. Recent Developments
- 11.2.1.5. Financials (Based on Availability)
- 11.2.2 Net Ease
- 11.2.2.1. Overview
- 11.2.2.2. Products
- 11.2.2.3. SWOT Analysis
- 11.2.2.4. Recent Developments
- 11.2.2.5. Financials (Based on Availability)
- 11.2.3 EA Sports
- 11.2.3.1. Overview
- 11.2.3.2. Products
- 11.2.3.3. SWOT Analysis
- 11.2.3.4. Recent Developments
- 11.2.3.5. Financials (Based on Availability)
- 11.2.4 KONAMI
- 11.2.4.1. Overview
- 11.2.4.2. Products
- 11.2.4.3. SWOT Analysis
- 11.2.4.4. Recent Developments
- 11.2.4.5. Financials (Based on Availability)
- 11.2.5 Firecraft Studios
- 11.2.5.1. Overview
- 11.2.5.2. Products
- 11.2.5.3. SWOT Analysis
- 11.2.5.4. Recent Developments
- 11.2.5.5. Financials (Based on Availability)
- 11.2.6 Lilith Games
- 11.2.6.1. Overview
- 11.2.6.2. Products
- 11.2.6.3. SWOT Analysis
- 11.2.6.4. Recent Developments
- 11.2.6.5. Financials (Based on Availability)
- 11.2.7 Funplus
- 11.2.7.1. Overview
- 11.2.7.2. Products
- 11.2.7.3. SWOT Analysis
- 11.2.7.4. Recent Developments
- 11.2.7.5. Financials (Based on Availability)
- 11.2.8 Droidhang Network Technology
- 11.2.8.1. Overview
- 11.2.8.2. Products
- 11.2.8.3. SWOT Analysis
- 11.2.8.4. Recent Developments
- 11.2.8.5. Financials (Based on Availability)
- 11.2.9 Supercell
- 11.2.9.1. Overview
- 11.2.9.2. Products
- 11.2.9.3. SWOT Analysis
- 11.2.9.4. Recent Developments
- 11.2.9.5. Financials (Based on Availability)
- 11.2.10 IGG
- 11.2.10.1. Overview
- 11.2.10.2. Products
- 11.2.10.3. SWOT Analysis
- 11.2.10.4. Recent Developments
- 11.2.10.5. Financials (Based on Availability)
- 11.2.11 Yotta Games
- 11.2.11.1. Overview
- 11.2.11.2. Products
- 11.2.11.3. SWOT Analysis
- 11.2.11.4. Recent Developments
- 11.2.11.5. Financials (Based on Availability)
- 11.2.12 Habby
- 11.2.12.1. Overview
- 11.2.12.2. Products
- 11.2.12.3. SWOT Analysis
- 11.2.12.4. Recent Developments
- 11.2.12.5. Financials (Based on Availability)
- 11.2.13 Niantic Inc.
- 11.2.13.1. Overview
- 11.2.13.2. Products
- 11.2.13.3. SWOT Analysis
- 11.2.13.4. Recent Developments
- 11.2.13.5. Financials (Based on Availability)
- 11.2.14 Epic Games
- 11.2.14.1. Overview
- 11.2.14.2. Products
- 11.2.14.3. SWOT Analysis
- 11.2.14.4. Recent Developments
- 11.2.14.5. Financials (Based on Availability)
- 11.2.15 Critical Force Entertainment Ltd.
- 11.2.15.1. Overview
- 11.2.15.2. Products
- 11.2.15.3. SWOT Analysis
- 11.2.15.4. Recent Developments
- 11.2.15.5. Financials (Based on Availability)
- 11.2.16 Art In Games
- 11.2.16.1. Overview
- 11.2.16.2. Products
- 11.2.16.3. SWOT Analysis
- 11.2.16.4. Recent Developments
- 11.2.16.5. Financials (Based on Availability)
- 11.2.17 Djinnworks
- 11.2.17.1. Overview
- 11.2.17.2. Products
- 11.2.17.3. SWOT Analysis
- 11.2.17.4. Recent Developments
- 11.2.17.5. Financials (Based on Availability)
- 11.2.18 Com2uS
- 11.2.18.1. Overview
- 11.2.18.2. Products
- 11.2.18.3. SWOT Analysis
- 11.2.18.4. Recent Developments
- 11.2.18.5. Financials (Based on Availability)
- 11.2.19 Bluehole PNIX
- 11.2.19.1. Overview
- 11.2.19.2. Products
- 11.2.19.3. SWOT Analysis
- 11.2.19.4. Recent Developments
- 11.2.19.5. Financials (Based on Availability)
- 11.2.1 Tencent
List of Figures
- Figure 1: Global Mobile Sports Game Spg Revenue Breakdown (million, %) by Region 2024 & 2032
- Figure 2: North America Mobile Sports Game Spg Revenue (million), by Application 2024 & 2032
- Figure 3: North America Mobile Sports Game Spg Revenue Share (%), by Application 2024 & 2032
- Figure 4: North America Mobile Sports Game Spg Revenue (million), by Type 2024 & 2032
- Figure 5: North America Mobile Sports Game Spg Revenue Share (%), by Type 2024 & 2032
- Figure 6: North America Mobile Sports Game Spg Revenue (million), by Country 2024 & 2032
- Figure 7: North America Mobile Sports Game Spg Revenue Share (%), by Country 2024 & 2032
- Figure 8: South America Mobile Sports Game Spg Revenue (million), by Application 2024 & 2032
- Figure 9: South America Mobile Sports Game Spg Revenue Share (%), by Application 2024 & 2032
- Figure 10: South America Mobile Sports Game Spg Revenue (million), by Type 2024 & 2032
- Figure 11: South America Mobile Sports Game Spg Revenue Share (%), by Type 2024 & 2032
- Figure 12: South America Mobile Sports Game Spg Revenue (million), by Country 2024 & 2032
- Figure 13: South America Mobile Sports Game Spg Revenue Share (%), by Country 2024 & 2032
- Figure 14: Europe Mobile Sports Game Spg Revenue (million), by Application 2024 & 2032
- Figure 15: Europe Mobile Sports Game Spg Revenue Share (%), by Application 2024 & 2032
- Figure 16: Europe Mobile Sports Game Spg Revenue (million), by Type 2024 & 2032
- Figure 17: Europe Mobile Sports Game Spg Revenue Share (%), by Type 2024 & 2032
- Figure 18: Europe Mobile Sports Game Spg Revenue (million), by Country 2024 & 2032
- Figure 19: Europe Mobile Sports Game Spg Revenue Share (%), by Country 2024 & 2032
- Figure 20: Middle East & Africa Mobile Sports Game Spg Revenue (million), by Application 2024 & 2032
- Figure 21: Middle East & Africa Mobile Sports Game Spg Revenue Share (%), by Application 2024 & 2032
- Figure 22: Middle East & Africa Mobile Sports Game Spg Revenue (million), by Type 2024 & 2032
- Figure 23: Middle East & Africa Mobile Sports Game Spg Revenue Share (%), by Type 2024 & 2032
- Figure 24: Middle East & Africa Mobile Sports Game Spg Revenue (million), by Country 2024 & 2032
- Figure 25: Middle East & Africa Mobile Sports Game Spg Revenue Share (%), by Country 2024 & 2032
- Figure 26: Asia Pacific Mobile Sports Game Spg Revenue (million), by Application 2024 & 2032
- Figure 27: Asia Pacific Mobile Sports Game Spg Revenue Share (%), by Application 2024 & 2032
- Figure 28: Asia Pacific Mobile Sports Game Spg Revenue (million), by Type 2024 & 2032
- Figure 29: Asia Pacific Mobile Sports Game Spg Revenue Share (%), by Type 2024 & 2032
- Figure 30: Asia Pacific Mobile Sports Game Spg Revenue (million), by Country 2024 & 2032
- Figure 31: Asia Pacific Mobile Sports Game Spg Revenue Share (%), by Country 2024 & 2032
List of Tables
- Table 1: Global Mobile Sports Game Spg Revenue million Forecast, by Region 2019 & 2032
- Table 2: Global Mobile Sports Game Spg Revenue million Forecast, by Application 2019 & 2032
- Table 3: Global Mobile Sports Game Spg Revenue million Forecast, by Type 2019 & 2032
- Table 4: Global Mobile Sports Game Spg Revenue million Forecast, by Region 2019 & 2032
- Table 5: Global Mobile Sports Game Spg Revenue million Forecast, by Application 2019 & 2032
- Table 6: Global Mobile Sports Game Spg Revenue million Forecast, by Type 2019 & 2032
- Table 7: Global Mobile Sports Game Spg Revenue million Forecast, by Country 2019 & 2032
- Table 8: United States Mobile Sports Game Spg Revenue (million) Forecast, by Application 2019 & 2032
- Table 9: Canada Mobile Sports Game Spg Revenue (million) Forecast, by Application 2019 & 2032
- Table 10: Mexico Mobile Sports Game Spg Revenue (million) Forecast, by Application 2019 & 2032
- Table 11: Global Mobile Sports Game Spg Revenue million Forecast, by Application 2019 & 2032
- Table 12: Global Mobile Sports Game Spg Revenue million Forecast, by Type 2019 & 2032
- Table 13: Global Mobile Sports Game Spg Revenue million Forecast, by Country 2019 & 2032
- Table 14: Brazil Mobile Sports Game Spg Revenue (million) Forecast, by Application 2019 & 2032
- Table 15: Argentina Mobile Sports Game Spg Revenue (million) Forecast, by Application 2019 & 2032
- Table 16: Rest of South America Mobile Sports Game Spg Revenue (million) Forecast, by Application 2019 & 2032
- Table 17: Global Mobile Sports Game Spg Revenue million Forecast, by Application 2019 & 2032
- Table 18: Global Mobile Sports Game Spg Revenue million Forecast, by Type 2019 & 2032
- Table 19: Global Mobile Sports Game Spg Revenue million Forecast, by Country 2019 & 2032
- Table 20: United Kingdom Mobile Sports Game Spg Revenue (million) Forecast, by Application 2019 & 2032
- Table 21: Germany Mobile Sports Game Spg Revenue (million) Forecast, by Application 2019 & 2032
- Table 22: France Mobile Sports Game Spg Revenue (million) Forecast, by Application 2019 & 2032
- Table 23: Italy Mobile Sports Game Spg Revenue (million) Forecast, by Application 2019 & 2032
- Table 24: Spain Mobile Sports Game Spg Revenue (million) Forecast, by Application 2019 & 2032
- Table 25: Russia Mobile Sports Game Spg Revenue (million) Forecast, by Application 2019 & 2032
- Table 26: Benelux Mobile Sports Game Spg Revenue (million) Forecast, by Application 2019 & 2032
- Table 27: Nordics Mobile Sports Game Spg Revenue (million) Forecast, by Application 2019 & 2032
- Table 28: Rest of Europe Mobile Sports Game Spg Revenue (million) Forecast, by Application 2019 & 2032
- Table 29: Global Mobile Sports Game Spg Revenue million Forecast, by Application 2019 & 2032
- Table 30: Global Mobile Sports Game Spg Revenue million Forecast, by Type 2019 & 2032
- Table 31: Global Mobile Sports Game Spg Revenue million Forecast, by Country 2019 & 2032
- Table 32: Turkey Mobile Sports Game Spg Revenue (million) Forecast, by Application 2019 & 2032
- Table 33: Israel Mobile Sports Game Spg Revenue (million) Forecast, by Application 2019 & 2032
- Table 34: GCC Mobile Sports Game Spg Revenue (million) Forecast, by Application 2019 & 2032
- Table 35: North Africa Mobile Sports Game Spg Revenue (million) Forecast, by Application 2019 & 2032
- Table 36: South Africa Mobile Sports Game Spg Revenue (million) Forecast, by Application 2019 & 2032
- Table 37: Rest of Middle East & Africa Mobile Sports Game Spg Revenue (million) Forecast, by Application 2019 & 2032
- Table 38: Global Mobile Sports Game Spg Revenue million Forecast, by Application 2019 & 2032
- Table 39: Global Mobile Sports Game Spg Revenue million Forecast, by Type 2019 & 2032
- Table 40: Global Mobile Sports Game Spg Revenue million Forecast, by Country 2019 & 2032
- Table 41: China Mobile Sports Game Spg Revenue (million) Forecast, by Application 2019 & 2032
- Table 42: India Mobile Sports Game Spg Revenue (million) Forecast, by Application 2019 & 2032
- Table 43: Japan Mobile Sports Game Spg Revenue (million) Forecast, by Application 2019 & 2032
- Table 44: South Korea Mobile Sports Game Spg Revenue (million) Forecast, by Application 2019 & 2032
- Table 45: ASEAN Mobile Sports Game Spg Revenue (million) Forecast, by Application 2019 & 2032
- Table 46: Oceania Mobile Sports Game Spg Revenue (million) Forecast, by Application 2019 & 2032
- Table 47: Rest of Asia Pacific Mobile Sports Game Spg Revenue (million) Forecast, by Application 2019 & 2032
Frequently Asked Questions
1. What is the projected Compound Annual Growth Rate (CAGR) of the Mobile Sports Game Spg?
The projected CAGR is approximately XXX%.
2. Which companies are prominent players in the Mobile Sports Game Spg?
Key companies in the market include Tencent, Net Ease, EA Sports, KONAMI, Firecraft Studios, Lilith Games, Funplus, Droidhang Network Technology, Supercell, IGG, Yotta Games, Habby, Niantic, Inc., Epic Games, Critical Force Entertainment Ltd., Art In Games, Djinnworks, Com2uS, Bluehole PNIX.
3. What are the main segments of the Mobile Sports Game Spg?
The market segments include Application, Type.
4. Can you provide details about the market size?
The market size is estimated to be USD XXX million as of 2022.
5. What are some drivers contributing to market growth?
N/A
6. What are the notable trends driving market growth?
N/A
7. Are there any restraints impacting market growth?
N/A
8. Can you provide examples of recent developments in the market?
N/A
9. What pricing options are available for accessing the report?
Pricing options include single-user, multi-user, and enterprise licenses priced at USD 2900.00, USD 4350.00, and USD 5800.00 respectively.
10. Is the market size provided in terms of value or volume?
The market size is provided in terms of value, measured in million.
11. Are there any specific market keywords associated with the report?
Yes, the market keyword associated with the report is "Mobile Sports Game Spg," which aids in identifying and referencing the specific market segment covered.
12. How do I determine which pricing option suits my needs best?
The pricing options vary based on user requirements and access needs. Individual users may opt for single-user licenses, while businesses requiring broader access may choose multi-user or enterprise licenses for cost-effective access to the report.
13. Are there any additional resources or data provided in the Mobile Sports Game Spg report?
While the report offers comprehensive insights, it's advisable to review the specific contents or supplementary materials provided to ascertain if additional resources or data are available.
14. How can I stay updated on further developments or reports in the Mobile Sports Game Spg?
To stay informed about further developments, trends, and reports in the Mobile Sports Game Spg, consider subscribing to industry newsletters, following relevant companies and organizations, or regularly checking reputable industry news sources and publications.
Methodology
Step 1 - Identification of Relevant Samples Size from Population Database


Step 2 - Approaches for Defining Global Market Size (Value, Volume* & Price*)

Note*: In applicable scenarios
Step 3 - Data Sources
Primary Research
- Web Analytics
- Survey Reports
- Research Institute
- Latest Research Reports
- Opinion Leaders
Secondary Research
- Annual Reports
- White Paper
- Latest Press Release
- Industry Association
- Paid Database
- Investor Presentations

Step 4 - Data Triangulation
Involves using different sources of information in order to increase the validity of a study
These sources are likely to be stakeholders in a program - participants, other researchers, program staff, other community members, and so on.
Then we put all data in single framework & apply various statistical tools to find out the dynamic on the market.
During the analysis stage, feedback from the stakeholder groups would be compared to determine areas of agreement as well as areas of divergence
