

Key Insights
The mobile 3D market is experiencing explosive growth, projected to reach a substantial size driven by advancements in mobile device technology and the increasing demand for immersive experiences. The market's Compound Annual Growth Rate (CAGR) of 39.78% from 2019-2024 indicates a rapid expansion, fueled by several key factors. The proliferation of smartphones with enhanced processing power and improved camera capabilities is a primary driver. Furthermore, the rising popularity of augmented reality (AR) and virtual reality (VR) applications in gaming, navigation, advertising, and animation is significantly boosting market demand. The integration of sophisticated 3D sensors, displays, and image processing technologies within mobile devices is accelerating this trend. While challenges exist, such as the need for enhanced battery life and improved data processing capabilities to support resource-intensive 3D applications, the continuous innovation in hardware and software is overcoming these hurdles. The market segmentation reveals strong growth across different device types, particularly smartphones and tablets, while the demand for 3D components like image sensors and advanced displays is also rising rapidly. Geographical analysis indicates strong growth across North America and Asia Pacific, driven by high technological adoption rates and significant investments in the mobile technology sector.
The continued expansion of the mobile 3D market is expected to be influenced by several factors. The increasing penetration of high-speed mobile internet access in emerging economies will play a crucial role in driving market growth in regions like Asia Pacific and South America. Furthermore, ongoing developments in 5G technology promise to significantly improve data transmission speeds and reduce latency, further enhancing the user experience for mobile 3D applications. Innovations in 3D rendering techniques and improved power efficiency of 3D components will contribute to wider adoption. Competition among major players like Nvidia, Samsung, Apple, and Qualcomm is also driving innovation and price reductions, making 3D mobile experiences more accessible to a wider consumer base. However, maintaining data privacy and security in the context of enhanced mobile 3D applications will remain a critical concern requiring innovative solutions from both technology developers and policymakers.
Mobile 3D Market: A Comprehensive Report (2019-2033)
This insightful report provides a detailed analysis of the Mobile 3D Market, encompassing market size, growth drivers, competitive landscape, and future opportunities. With a study period spanning 2019-2033, a base year of 2025, and a forecast period from 2025-2033, this report offers a comprehensive overview for stakeholders seeking to understand and capitalize on this rapidly evolving market. The market is projected to reach xx Million by 2033, showcasing significant growth potential.
Mobile 3D Market Composition & Trends
The Mobile 3D Market is characterized by a dynamic interplay of technological innovation, evolving consumer preferences, and strategic mergers and acquisitions (M&A). Market concentration is moderate, with key players like Nvidia, Samsung, and Qualcomm holding significant shares, but also featuring a considerable number of smaller, specialized companies. Innovation is driven primarily by advancements in 3D display technologies (e.g., glass-free 3D, OLED) and improved image sensor capabilities. Regulatory landscapes vary by region, impacting adoption rates and product development. Substitute products include enhanced 2D displays and VR/AR headsets, posing a competitive challenge. End-user profiles encompass gamers, professionals (e.g., architects, designers), and general consumers.
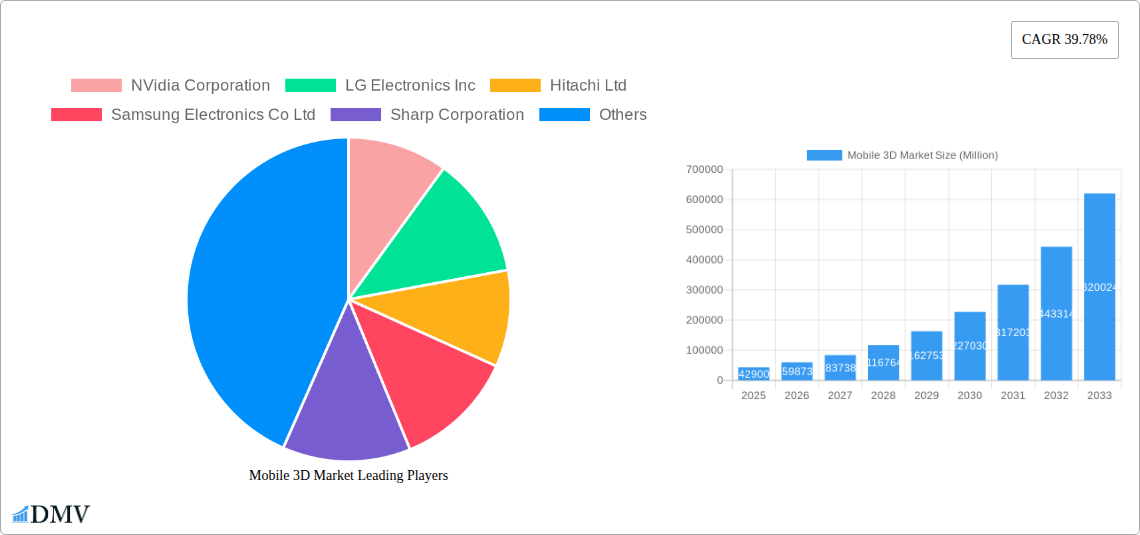
- Market Share Distribution (2024): Samsung: xx%; Qualcomm: xx%; Nvidia: xx%; Others: xx%.
- M&A Activity (2019-2024): Total deal value estimated at xx Million, with a significant increase in activity in the last two years.
Mobile 3D Market Industry Evolution
The Mobile 3D Market has witnessed significant growth since 2019, fueled by continuous technological advancements in display technologies, improved processing power, and the increasing affordability of 3D-enabled devices. Early adoption was primarily driven by the gaming segment, with subsequent expansion into other applications like mobile advertisements and augmented reality experiences. The market's growth trajectory is expected to be strong throughout the forecast period, with a Compound Annual Growth Rate (CAGR) of xx% from 2025 to 2033. Consumer demand is shifting towards more immersive and realistic 3D experiences, pushing innovation in areas like higher resolutions, wider fields of view, and improved power efficiency.
Leading Regions, Countries, or Segments in Mobile 3D Market
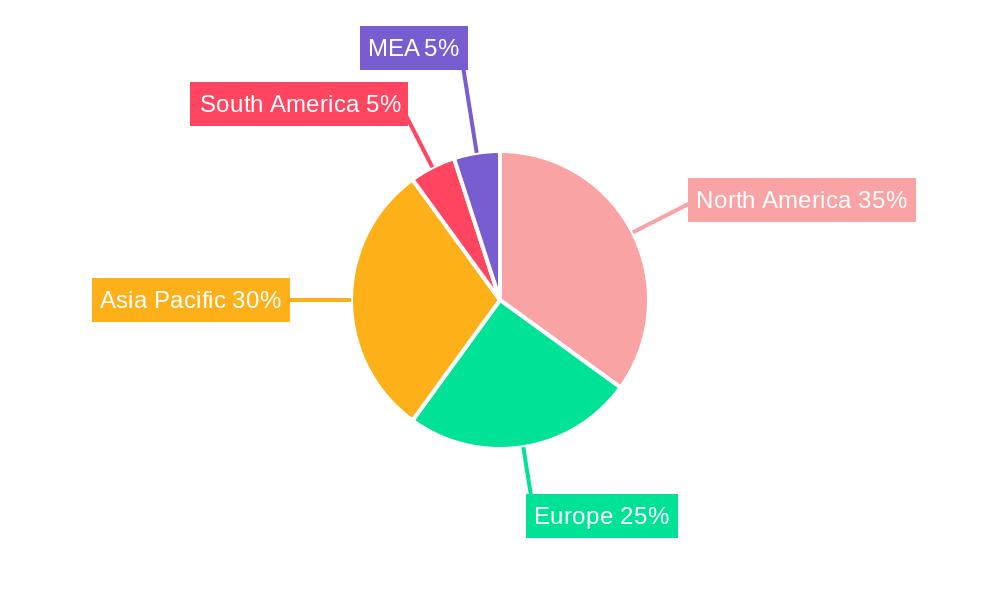
The North American market currently holds the largest share of the Mobile 3D Market, driven by high consumer spending on electronics and strong technological innovation. Asia-Pacific is projected to experience the fastest growth due to increasing smartphone penetration and rising disposable incomes.
- By 3D Enabled Mobile Devices: Smartphones currently dominate the market, followed by tablets and notebooks. Eyewear and other 3D-enabled devices show significant growth potential.
- By Device Components: 3D displays account for the largest segment, while image sensors are experiencing rapid advancements.
- By 3D Applications: Mobile gaming is the leading application, followed by animations. Maps and navigation are also gaining traction.
Key Drivers:
- High levels of private and public investment in R&D for 3D technologies.
- Supportive regulatory environments in key markets, facilitating adoption.
- Increasing consumer demand for immersive and interactive experiences.
Mobile 3D Market Product Innovations
Recent years have witnessed a surge in innovative products, such as glass-free 3D displays enabling comfortable and intuitive viewing experiences for multiple users simultaneously (e.g., Asus Spatial Vision Hub). Improved 3D cameras with wider fields of view and advanced depth sensing capabilities (e.g., Microsoft Femto Mega) are enhancing the creation and consumption of 3D content. These innovations contribute to the overall enhanced realism and usability of mobile 3D experiences.
Propelling Factors for Mobile 3D Market Growth
The growth of the Mobile 3D market is driven by several factors: advancements in display technology (e.g., mini-LED, micro-LED), the rise of 5G and improved processing power, and increasing demand for immersive entertainment and interactive applications. Government initiatives promoting technological development and favorable economic conditions are further fueling this growth.
Obstacles in the Mobile 3D Market
Challenges include high manufacturing costs for advanced 3D components, potential supply chain disruptions, and the need to overcome technical limitations in achieving truly seamless and realistic 3D experiences across diverse applications. Competition from existing 2D display technologies also remains a significant barrier.
Future Opportunities in Mobile 3D Market
The future holds immense potential. Expanding into new markets, particularly developing economies with growing smartphone adoption, is a key opportunity. Integration of 3D technologies with AR/VR applications and advancements in haptic feedback will further enhance the user experience and unlock new opportunities in areas like education, healthcare, and e-commerce.
Major Players in the Mobile 3D Market Ecosystem
- NVidia Corporation
- LG Electronics Inc
- Hitachi Ltd
- Samsung Electronics Co Ltd
- Sharp Corporation
- Apple Inc
- The 3M Company
- Qualcomm Inc
- Intel Corporation
- HTC Corporation
Key Developments in Mobile 3D Market Industry
- January 2023: Asus introduced glass-free 3D OLED technology with Spatial Vision, allowing two users simultaneous viewing.
- January 2023: Microsoft and Orbbec launched the Femto Mega 3D camera with a 120-degree field of vision and PoE connectivity.
- March 2023: ZTE launched the nubia pad 3D, featuring glass-less 3D visuals and pre-installed 3D apps in collaboration with Leia Inc.
Strategic Mobile 3D Market Forecast
The Mobile 3D market is poised for robust growth, driven by ongoing technological advancements and increasing consumer demand for immersive experiences. New applications in diverse sectors and the integration of 3D technology with other emerging technologies promise significant market expansion and potential for substantial returns on investment. The market is predicted to witness a sustained period of growth, with significant opportunities for both established and emerging players.
Mobile 3D Market Segmentation
-
1. 3D Enabled Mobile Devices
- 1.1. Smartphones
- 1.2. Notebooks
- 1.3. Tablets
- 1.4. Eyewear
- 1.5. Other 3D Enabled Devices
-
2. Device Components
- 2.1. Image Sensors
- 2.2. 3D Displays
-
3. 3D Applications
- 3.1. Animations
- 3.2. Maps and Navigation
- 3.3. Mobile Gaming
- 3.4. Mobile Advertisements
- 3.5. Other Applications
Mobile 3D Market Segmentation By Geography
-
1. North America
- 1.1. United States
- 1.2. Canada
-
2. Europe
- 2.1. United Kingdom
- 2.2. Germany
- 2.3. France
- 2.4. Rest of the Europe
-
3. Asia Pacific
- 3.1. China
- 3.2. Japan
- 3.3. India
- 3.4. Rest of the Asia Pacific
- 4. Middle East
- 5. LatinAmerica
Mobile 3D Market REPORT HIGHLIGHTS
| Aspects | Details |
|---|---|
| Study Period | 2019-2033 |
| Base Year | 2024 |
| Estimated Year | 2025 |
| Forecast Period | 2025-2033 |
| Historical Period | 2019-2024 |
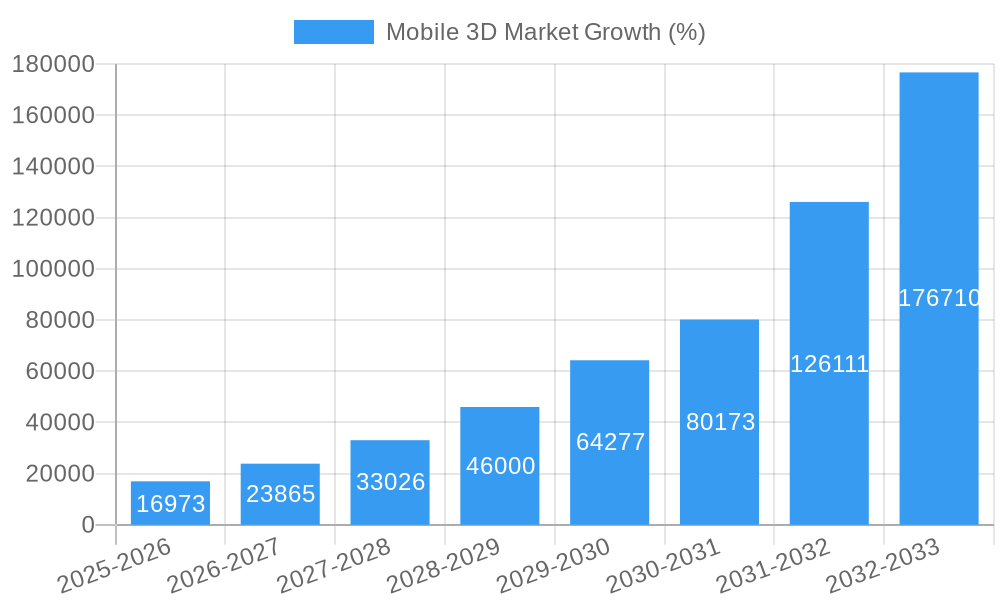
| Growth Rate | CAGR of 39.78% from 2019-2033 |
| Segmentation |
|
Table of Contents
- 1. Introduction
- 1.1. Research Scope
- 1.2. Market Segmentation
- 1.3. Research Methodology
- 1.4. Definitions and Assumptions
- 2. Executive Summary
- 2.1. Introduction
- 3. Market Dynamics
- 3.1. Introduction
- 3.2. Market Drivers
- 3.2.1. Rise in Smartphone Usage
- 3.3. Market Restrains
- 3.3.1. High Cost of 3D Devices and Content
- 3.4. Market Trends
- 3.4.1. Gaming Applications are Expected to Account for the Largest Share
- 4. Market Factor Analysis
- 4.1. Porters Five Forces
- 4.2. Supply/Value Chain
- 4.3. PESTEL analysis
- 4.4. Market Entropy
- 4.5. Patent/Trademark Analysis
- 5. Global Mobile 3D Market Analysis, Insights and Forecast, 2019-2031
- 5.1. Market Analysis, Insights and Forecast - by 3D Enabled Mobile Devices
- 5.1.1. Smartphones
- 5.1.2. Notebooks
- 5.1.3. Tablets
- 5.1.4. Eyewear
- 5.1.5. Other 3D Enabled Devices
- 5.2. Market Analysis, Insights and Forecast - by Device Components
- 5.2.1. Image Sensors
- 5.2.2. 3D Displays
- 5.3. Market Analysis, Insights and Forecast - by 3D Applications
- 5.3.1. Animations
- 5.3.2. Maps and Navigation
- 5.3.3. Mobile Gaming
- 5.3.4. Mobile Advertisements
- 5.3.5. Other Applications
- 5.4. Market Analysis, Insights and Forecast - by Region
- 5.4.1. North America
- 5.4.2. Europe
- 5.4.3. Asia Pacific
- 5.4.4. Middle East
- 5.4.5. LatinAmerica
- 5.1. Market Analysis, Insights and Forecast - by 3D Enabled Mobile Devices
- 6. North America Mobile 3D Market Analysis, Insights and Forecast, 2019-2031
- 6.1. Market Analysis, Insights and Forecast - by 3D Enabled Mobile Devices
- 6.1.1. Smartphones
- 6.1.2. Notebooks
- 6.1.3. Tablets
- 6.1.4. Eyewear
- 6.1.5. Other 3D Enabled Devices
- 6.2. Market Analysis, Insights and Forecast - by Device Components
- 6.2.1. Image Sensors
- 6.2.2. 3D Displays
- 6.3. Market Analysis, Insights and Forecast - by 3D Applications
- 6.3.1. Animations
- 6.3.2. Maps and Navigation
- 6.3.3. Mobile Gaming
- 6.3.4. Mobile Advertisements
- 6.3.5. Other Applications
- 6.1. Market Analysis, Insights and Forecast - by 3D Enabled Mobile Devices
- 7. Europe Mobile 3D Market Analysis, Insights and Forecast, 2019-2031
- 7.1. Market Analysis, Insights and Forecast - by 3D Enabled Mobile Devices
- 7.1.1. Smartphones
- 7.1.2. Notebooks
- 7.1.3. Tablets
- 7.1.4. Eyewear
- 7.1.5. Other 3D Enabled Devices
- 7.2. Market Analysis, Insights and Forecast - by Device Components
- 7.2.1. Image Sensors
- 7.2.2. 3D Displays
- 7.3. Market Analysis, Insights and Forecast - by 3D Applications
- 7.3.1. Animations
- 7.3.2. Maps and Navigation
- 7.3.3. Mobile Gaming
- 7.3.4. Mobile Advertisements
- 7.3.5. Other Applications
- 7.1. Market Analysis, Insights and Forecast - by 3D Enabled Mobile Devices
- 8. Asia Pacific Mobile 3D Market Analysis, Insights and Forecast, 2019-2031
- 8.1. Market Analysis, Insights and Forecast - by 3D Enabled Mobile Devices
- 8.1.1. Smartphones
- 8.1.2. Notebooks
- 8.1.3. Tablets
- 8.1.4. Eyewear
- 8.1.5. Other 3D Enabled Devices
- 8.2. Market Analysis, Insights and Forecast - by Device Components
- 8.2.1. Image Sensors
- 8.2.2. 3D Displays
- 8.3. Market Analysis, Insights and Forecast - by 3D Applications
- 8.3.1. Animations
- 8.3.2. Maps and Navigation
- 8.3.3. Mobile Gaming
- 8.3.4. Mobile Advertisements
- 8.3.5. Other Applications
- 8.1. Market Analysis, Insights and Forecast - by 3D Enabled Mobile Devices
- 9. Middle East Mobile 3D Market Analysis, Insights and Forecast, 2019-2031
- 9.1. Market Analysis, Insights and Forecast - by 3D Enabled Mobile Devices
- 9.1.1. Smartphones
- 9.1.2. Notebooks
- 9.1.3. Tablets
- 9.1.4. Eyewear
- 9.1.5. Other 3D Enabled Devices
- 9.2. Market Analysis, Insights and Forecast - by Device Components
- 9.2.1. Image Sensors
- 9.2.2. 3D Displays
- 9.3. Market Analysis, Insights and Forecast - by 3D Applications
- 9.3.1. Animations
- 9.3.2. Maps and Navigation
- 9.3.3. Mobile Gaming
- 9.3.4. Mobile Advertisements
- 9.3.5. Other Applications
- 9.1. Market Analysis, Insights and Forecast - by 3D Enabled Mobile Devices
- 10. LatinAmerica Mobile 3D Market Analysis, Insights and Forecast, 2019-2031
- 10.1. Market Analysis, Insights and Forecast - by 3D Enabled Mobile Devices
- 10.1.1. Smartphones
- 10.1.2. Notebooks
- 10.1.3. Tablets
- 10.1.4. Eyewear
- 10.1.5. Other 3D Enabled Devices
- 10.2. Market Analysis, Insights and Forecast - by Device Components
- 10.2.1. Image Sensors
- 10.2.2. 3D Displays
- 10.3. Market Analysis, Insights and Forecast - by 3D Applications
- 10.3.1. Animations
- 10.3.2. Maps and Navigation
- 10.3.3. Mobile Gaming
- 10.3.4. Mobile Advertisements
- 10.3.5. Other Applications
- 10.1. Market Analysis, Insights and Forecast - by 3D Enabled Mobile Devices
- 11. North America Mobile 3D Market Analysis, Insights and Forecast, 2019-2031
- 11.1. Market Analysis, Insights and Forecast - By Country/Sub-region
- 11.1.1 United States
- 11.1.2 Canada
- 11.1.3 Mexico
- 12. Europe Mobile 3D Market Analysis, Insights and Forecast, 2019-2031
- 12.1. Market Analysis, Insights and Forecast - By Country/Sub-region
- 12.1.1 Germany
- 12.1.2 United Kingdom
- 12.1.3 France
- 12.1.4 Spain
- 12.1.5 Italy
- 12.1.6 Spain
- 12.1.7 Belgium
- 12.1.8 Netherland
- 12.1.9 Nordics
- 12.1.10 Rest of Europe
- 13. Asia Pacific Mobile 3D Market Analysis, Insights and Forecast, 2019-2031
- 13.1. Market Analysis, Insights and Forecast - By Country/Sub-region
- 13.1.1 China
- 13.1.2 Japan
- 13.1.3 India
- 13.1.4 South Korea
- 13.1.5 Southeast Asia
- 13.1.6 Australia
- 13.1.7 Indonesia
- 13.1.8 Phillipes
- 13.1.9 Singapore
- 13.1.10 Thailandc
- 13.1.11 Rest of Asia Pacific
- 14. South America Mobile 3D Market Analysis, Insights and Forecast, 2019-2031
- 14.1. Market Analysis, Insights and Forecast - By Country/Sub-region
- 14.1.1 Brazil
- 14.1.2 Argentina
- 14.1.3 Peru
- 14.1.4 Chile
- 14.1.5 Colombia
- 14.1.6 Ecuador
- 14.1.7 Venezuela
- 14.1.8 Rest of South America
- 15. North America Mobile 3D Market Analysis, Insights and Forecast, 2019-2031
- 15.1. Market Analysis, Insights and Forecast - By Country/Sub-region
- 15.1.1 United States
- 15.1.2 Canada
- 15.1.3 Mexico
- 16. MEA Mobile 3D Market Analysis, Insights and Forecast, 2019-2031
- 16.1. Market Analysis, Insights and Forecast - By Country/Sub-region
- 16.1.1 United Arab Emirates
- 16.1.2 Saudi Arabia
- 16.1.3 South Africa
- 16.1.4 Rest of Middle East and Africa
- 17. Competitive Analysis
- 17.1. Global Market Share Analysis 2024
- 17.2. Company Profiles
- 17.2.1 NVidia Corporation
- 17.2.1.1. Overview
- 17.2.1.2. Products
- 17.2.1.3. SWOT Analysis
- 17.2.1.4. Recent Developments
- 17.2.1.5. Financials (Based on Availability)
- 17.2.2 LG Electronics Inc
- 17.2.2.1. Overview
- 17.2.2.2. Products
- 17.2.2.3. SWOT Analysis
- 17.2.2.4. Recent Developments
- 17.2.2.5. Financials (Based on Availability)
- 17.2.3 Hitachi Ltd
- 17.2.3.1. Overview
- 17.2.3.2. Products
- 17.2.3.3. SWOT Analysis
- 17.2.3.4. Recent Developments
- 17.2.3.5. Financials (Based on Availability)
- 17.2.4 Samsung Electronics Co Ltd
- 17.2.4.1. Overview
- 17.2.4.2. Products
- 17.2.4.3. SWOT Analysis
- 17.2.4.4. Recent Developments
- 17.2.4.5. Financials (Based on Availability)
- 17.2.5 Sharp Corporation
- 17.2.5.1. Overview
- 17.2.5.2. Products
- 17.2.5.3. SWOT Analysis
- 17.2.5.4. Recent Developments
- 17.2.5.5. Financials (Based on Availability)
- 17.2.6 Apple Inc
- 17.2.6.1. Overview
- 17.2.6.2. Products
- 17.2.6.3. SWOT Analysis
- 17.2.6.4. Recent Developments
- 17.2.6.5. Financials (Based on Availability)
- 17.2.7 The 3M Company
- 17.2.7.1. Overview
- 17.2.7.2. Products
- 17.2.7.3. SWOT Analysis
- 17.2.7.4. Recent Developments
- 17.2.7.5. Financials (Based on Availability)
- 17.2.8 Qualcomm Inc *List Not Exhaustive
- 17.2.8.1. Overview
- 17.2.8.2. Products
- 17.2.8.3. SWOT Analysis
- 17.2.8.4. Recent Developments
- 17.2.8.5. Financials (Based on Availability)
- 17.2.9 Intel Corporation
- 17.2.9.1. Overview
- 17.2.9.2. Products
- 17.2.9.3. SWOT Analysis
- 17.2.9.4. Recent Developments
- 17.2.9.5. Financials (Based on Availability)
- 17.2.10 HTC Corporation
- 17.2.10.1. Overview
- 17.2.10.2. Products
- 17.2.10.3. SWOT Analysis
- 17.2.10.4. Recent Developments
- 17.2.10.5. Financials (Based on Availability)
- 17.2.1 NVidia Corporation
List of Figures
- Figure 1: Global Mobile 3D Market Revenue Breakdown (Million, %) by Region 2024 & 2032
- Figure 2: North America Mobile 3D Market Revenue (Million), by Country 2024 & 2032
- Figure 3: North America Mobile 3D Market Revenue Share (%), by Country 2024 & 2032
- Figure 4: Europe Mobile 3D Market Revenue (Million), by Country 2024 & 2032
- Figure 5: Europe Mobile 3D Market Revenue Share (%), by Country 2024 & 2032
- Figure 6: Asia Pacific Mobile 3D Market Revenue (Million), by Country 2024 & 2032
- Figure 7: Asia Pacific Mobile 3D Market Revenue Share (%), by Country 2024 & 2032
- Figure 8: South America Mobile 3D Market Revenue (Million), by Country 2024 & 2032
- Figure 9: South America Mobile 3D Market Revenue Share (%), by Country 2024 & 2032
- Figure 10: North America Mobile 3D Market Revenue (Million), by Country 2024 & 2032
- Figure 11: North America Mobile 3D Market Revenue Share (%), by Country 2024 & 2032
- Figure 12: MEA Mobile 3D Market Revenue (Million), by Country 2024 & 2032
- Figure 13: MEA Mobile 3D Market Revenue Share (%), by Country 2024 & 2032
- Figure 14: North America Mobile 3D Market Revenue (Million), by 3D Enabled Mobile Devices 2024 & 2032
- Figure 15: North America Mobile 3D Market Revenue Share (%), by 3D Enabled Mobile Devices 2024 & 2032
- Figure 16: North America Mobile 3D Market Revenue (Million), by Device Components 2024 & 2032
- Figure 17: North America Mobile 3D Market Revenue Share (%), by Device Components 2024 & 2032
- Figure 18: North America Mobile 3D Market Revenue (Million), by 3D Applications 2024 & 2032
- Figure 19: North America Mobile 3D Market Revenue Share (%), by 3D Applications 2024 & 2032
- Figure 20: North America Mobile 3D Market Revenue (Million), by Country 2024 & 2032
- Figure 21: North America Mobile 3D Market Revenue Share (%), by Country 2024 & 2032
- Figure 22: Europe Mobile 3D Market Revenue (Million), by 3D Enabled Mobile Devices 2024 & 2032
- Figure 23: Europe Mobile 3D Market Revenue Share (%), by 3D Enabled Mobile Devices 2024 & 2032
- Figure 24: Europe Mobile 3D Market Revenue (Million), by Device Components 2024 & 2032
- Figure 25: Europe Mobile 3D Market Revenue Share (%), by Device Components 2024 & 2032
- Figure 26: Europe Mobile 3D Market Revenue (Million), by 3D Applications 2024 & 2032
- Figure 27: Europe Mobile 3D Market Revenue Share (%), by 3D Applications 2024 & 2032
- Figure 28: Europe Mobile 3D Market Revenue (Million), by Country 2024 & 2032
- Figure 29: Europe Mobile 3D Market Revenue Share (%), by Country 2024 & 2032
- Figure 30: Asia Pacific Mobile 3D Market Revenue (Million), by 3D Enabled Mobile Devices 2024 & 2032
- Figure 31: Asia Pacific Mobile 3D Market Revenue Share (%), by 3D Enabled Mobile Devices 2024 & 2032
- Figure 32: Asia Pacific Mobile 3D Market Revenue (Million), by Device Components 2024 & 2032
- Figure 33: Asia Pacific Mobile 3D Market Revenue Share (%), by Device Components 2024 & 2032
- Figure 34: Asia Pacific Mobile 3D Market Revenue (Million), by 3D Applications 2024 & 2032
- Figure 35: Asia Pacific Mobile 3D Market Revenue Share (%), by 3D Applications 2024 & 2032
- Figure 36: Asia Pacific Mobile 3D Market Revenue (Million), by Country 2024 & 2032
- Figure 37: Asia Pacific Mobile 3D Market Revenue Share (%), by Country 2024 & 2032
- Figure 38: Middle East Mobile 3D Market Revenue (Million), by 3D Enabled Mobile Devices 2024 & 2032
- Figure 39: Middle East Mobile 3D Market Revenue Share (%), by 3D Enabled Mobile Devices 2024 & 2032
- Figure 40: Middle East Mobile 3D Market Revenue (Million), by Device Components 2024 & 2032
- Figure 41: Middle East Mobile 3D Market Revenue Share (%), by Device Components 2024 & 2032
- Figure 42: Middle East Mobile 3D Market Revenue (Million), by 3D Applications 2024 & 2032
- Figure 43: Middle East Mobile 3D Market Revenue Share (%), by 3D Applications 2024 & 2032
- Figure 44: Middle East Mobile 3D Market Revenue (Million), by Country 2024 & 2032
- Figure 45: Middle East Mobile 3D Market Revenue Share (%), by Country 2024 & 2032
- Figure 46: LatinAmerica Mobile 3D Market Revenue (Million), by 3D Enabled Mobile Devices 2024 & 2032
- Figure 47: LatinAmerica Mobile 3D Market Revenue Share (%), by 3D Enabled Mobile Devices 2024 & 2032
- Figure 48: LatinAmerica Mobile 3D Market Revenue (Million), by Device Components 2024 & 2032
- Figure 49: LatinAmerica Mobile 3D Market Revenue Share (%), by Device Components 2024 & 2032
- Figure 50: LatinAmerica Mobile 3D Market Revenue (Million), by 3D Applications 2024 & 2032
- Figure 51: LatinAmerica Mobile 3D Market Revenue Share (%), by 3D Applications 2024 & 2032
- Figure 52: LatinAmerica Mobile 3D Market Revenue (Million), by Country 2024 & 2032
- Figure 53: LatinAmerica Mobile 3D Market Revenue Share (%), by Country 2024 & 2032
List of Tables
- Table 1: Global Mobile 3D Market Revenue Million Forecast, by Region 2019 & 2032
- Table 2: Global Mobile 3D Market Revenue Million Forecast, by 3D Enabled Mobile Devices 2019 & 2032
- Table 3: Global Mobile 3D Market Revenue Million Forecast, by Device Components 2019 & 2032
- Table 4: Global Mobile 3D Market Revenue Million Forecast, by 3D Applications 2019 & 2032
- Table 5: Global Mobile 3D Market Revenue Million Forecast, by Region 2019 & 2032
- Table 6: Global Mobile 3D Market Revenue Million Forecast, by Country 2019 & 2032
- Table 7: United States Mobile 3D Market Revenue (Million) Forecast, by Application 2019 & 2032
- Table 8: Canada Mobile 3D Market Revenue (Million) Forecast, by Application 2019 & 2032
- Table 9: Mexico Mobile 3D Market Revenue (Million) Forecast, by Application 2019 & 2032
- Table 10: Global Mobile 3D Market Revenue Million Forecast, by Country 2019 & 2032
- Table 11: Germany Mobile 3D Market Revenue (Million) Forecast, by Application 2019 & 2032
- Table 12: United Kingdom Mobile 3D Market Revenue (Million) Forecast, by Application 2019 & 2032
- Table 13: France Mobile 3D Market Revenue (Million) Forecast, by Application 2019 & 2032
- Table 14: Spain Mobile 3D Market Revenue (Million) Forecast, by Application 2019 & 2032
- Table 15: Italy Mobile 3D Market Revenue (Million) Forecast, by Application 2019 & 2032
- Table 16: Spain Mobile 3D Market Revenue (Million) Forecast, by Application 2019 & 2032
- Table 17: Belgium Mobile 3D Market Revenue (Million) Forecast, by Application 2019 & 2032
- Table 18: Netherland Mobile 3D Market Revenue (Million) Forecast, by Application 2019 & 2032
- Table 19: Nordics Mobile 3D Market Revenue (Million) Forecast, by Application 2019 & 2032
- Table 20: Rest of Europe Mobile 3D Market Revenue (Million) Forecast, by Application 2019 & 2032
- Table 21: Global Mobile 3D Market Revenue Million Forecast, by Country 2019 & 2032
- Table 22: China Mobile 3D Market Revenue (Million) Forecast, by Application 2019 & 2032
- Table 23: Japan Mobile 3D Market Revenue (Million) Forecast, by Application 2019 & 2032
- Table 24: India Mobile 3D Market Revenue (Million) Forecast, by Application 2019 & 2032
- Table 25: South Korea Mobile 3D Market Revenue (Million) Forecast, by Application 2019 & 2032
- Table 26: Southeast Asia Mobile 3D Market Revenue (Million) Forecast, by Application 2019 & 2032
- Table 27: Australia Mobile 3D Market Revenue (Million) Forecast, by Application 2019 & 2032
- Table 28: Indonesia Mobile 3D Market Revenue (Million) Forecast, by Application 2019 & 2032
- Table 29: Phillipes Mobile 3D Market Revenue (Million) Forecast, by Application 2019 & 2032
- Table 30: Singapore Mobile 3D Market Revenue (Million) Forecast, by Application 2019 & 2032
- Table 31: Thailandc Mobile 3D Market Revenue (Million) Forecast, by Application 2019 & 2032
- Table 32: Rest of Asia Pacific Mobile 3D Market Revenue (Million) Forecast, by Application 2019 & 2032
- Table 33: Global Mobile 3D Market Revenue Million Forecast, by Country 2019 & 2032
- Table 34: Brazil Mobile 3D Market Revenue (Million) Forecast, by Application 2019 & 2032
- Table 35: Argentina Mobile 3D Market Revenue (Million) Forecast, by Application 2019 & 2032
- Table 36: Peru Mobile 3D Market Revenue (Million) Forecast, by Application 2019 & 2032
- Table 37: Chile Mobile 3D Market Revenue (Million) Forecast, by Application 2019 & 2032
- Table 38: Colombia Mobile 3D Market Revenue (Million) Forecast, by Application 2019 & 2032
- Table 39: Ecuador Mobile 3D Market Revenue (Million) Forecast, by Application 2019 & 2032
- Table 40: Venezuela Mobile 3D Market Revenue (Million) Forecast, by Application 2019 & 2032
- Table 41: Rest of South America Mobile 3D Market Revenue (Million) Forecast, by Application 2019 & 2032
- Table 42: Global Mobile 3D Market Revenue Million Forecast, by Country 2019 & 2032
- Table 43: United States Mobile 3D Market Revenue (Million) Forecast, by Application 2019 & 2032
- Table 44: Canada Mobile 3D Market Revenue (Million) Forecast, by Application 2019 & 2032
- Table 45: Mexico Mobile 3D Market Revenue (Million) Forecast, by Application 2019 & 2032
- Table 46: Global Mobile 3D Market Revenue Million Forecast, by Country 2019 & 2032
- Table 47: United Arab Emirates Mobile 3D Market Revenue (Million) Forecast, by Application 2019 & 2032
- Table 48: Saudi Arabia Mobile 3D Market Revenue (Million) Forecast, by Application 2019 & 2032
- Table 49: South Africa Mobile 3D Market Revenue (Million) Forecast, by Application 2019 & 2032
- Table 50: Rest of Middle East and Africa Mobile 3D Market Revenue (Million) Forecast, by Application 2019 & 2032
- Table 51: Global Mobile 3D Market Revenue Million Forecast, by 3D Enabled Mobile Devices 2019 & 2032
- Table 52: Global Mobile 3D Market Revenue Million Forecast, by Device Components 2019 & 2032
- Table 53: Global Mobile 3D Market Revenue Million Forecast, by 3D Applications 2019 & 2032
- Table 54: Global Mobile 3D Market Revenue Million Forecast, by Country 2019 & 2032
- Table 55: United States Mobile 3D Market Revenue (Million) Forecast, by Application 2019 & 2032
- Table 56: Canada Mobile 3D Market Revenue (Million) Forecast, by Application 2019 & 2032
- Table 57: Global Mobile 3D Market Revenue Million Forecast, by 3D Enabled Mobile Devices 2019 & 2032
- Table 58: Global Mobile 3D Market Revenue Million Forecast, by Device Components 2019 & 2032
- Table 59: Global Mobile 3D Market Revenue Million Forecast, by 3D Applications 2019 & 2032
- Table 60: Global Mobile 3D Market Revenue Million Forecast, by Country 2019 & 2032
- Table 61: United Kingdom Mobile 3D Market Revenue (Million) Forecast, by Application 2019 & 2032
- Table 62: Germany Mobile 3D Market Revenue (Million) Forecast, by Application 2019 & 2032
- Table 63: France Mobile 3D Market Revenue (Million) Forecast, by Application 2019 & 2032
- Table 64: Rest of the Europe Mobile 3D Market Revenue (Million) Forecast, by Application 2019 & 2032
- Table 65: Global Mobile 3D Market Revenue Million Forecast, by 3D Enabled Mobile Devices 2019 & 2032
- Table 66: Global Mobile 3D Market Revenue Million Forecast, by Device Components 2019 & 2032
- Table 67: Global Mobile 3D Market Revenue Million Forecast, by 3D Applications 2019 & 2032
- Table 68: Global Mobile 3D Market Revenue Million Forecast, by Country 2019 & 2032
- Table 69: China Mobile 3D Market Revenue (Million) Forecast, by Application 2019 & 2032
- Table 70: Japan Mobile 3D Market Revenue (Million) Forecast, by Application 2019 & 2032
- Table 71: India Mobile 3D Market Revenue (Million) Forecast, by Application 2019 & 2032
- Table 72: Rest of the Asia Pacific Mobile 3D Market Revenue (Million) Forecast, by Application 2019 & 2032
- Table 73: Global Mobile 3D Market Revenue Million Forecast, by 3D Enabled Mobile Devices 2019 & 2032
- Table 74: Global Mobile 3D Market Revenue Million Forecast, by Device Components 2019 & 2032
- Table 75: Global Mobile 3D Market Revenue Million Forecast, by 3D Applications 2019 & 2032
- Table 76: Global Mobile 3D Market Revenue Million Forecast, by Country 2019 & 2032
- Table 77: Global Mobile 3D Market Revenue Million Forecast, by 3D Enabled Mobile Devices 2019 & 2032
- Table 78: Global Mobile 3D Market Revenue Million Forecast, by Device Components 2019 & 2032
- Table 79: Global Mobile 3D Market Revenue Million Forecast, by 3D Applications 2019 & 2032
- Table 80: Global Mobile 3D Market Revenue Million Forecast, by Country 2019 & 2032
Frequently Asked Questions
1. What is the projected Compound Annual Growth Rate (CAGR) of the Mobile 3D Market?
The projected CAGR is approximately 39.78%.
2. Which companies are prominent players in the Mobile 3D Market?
Key companies in the market include NVidia Corporation, LG Electronics Inc, Hitachi Ltd, Samsung Electronics Co Ltd, Sharp Corporation, Apple Inc, The 3M Company, Qualcomm Inc *List Not Exhaustive, Intel Corporation, HTC Corporation.
3. What are the main segments of the Mobile 3D Market?
The market segments include 3D Enabled Mobile Devices, Device Components, 3D Applications.
4. Can you provide details about the market size?
The market size is estimated to be USD 42.90 Million as of 2022.
5. What are some drivers contributing to market growth?
Rise in Smartphone Usage.
6. What are the notable trends driving market growth?
Gaming Applications are Expected to Account for the Largest Share.
7. Are there any restraints impacting market growth?
High Cost of 3D Devices and Content.
8. Can you provide examples of recent developments in the market?
March 2023 - ZTE launched nubia pad 3D, which offers glass-less 3D visuals. The product is the combined effort of Leia Inc and ZTE. The tablet can display native 3D content and convert 2D content into 3D in real-time. Leia will also provide pre-installed 3D games and educational apps. The tablet runs on Andriod 13 OS, and Snapdragon 888 SoC is used for faster processing.
9. What pricing options are available for accessing the report?
Pricing options include single-user, multi-user, and enterprise licenses priced at USD 4750, USD 5250, and USD 8750 respectively.
10. Is the market size provided in terms of value or volume?
The market size is provided in terms of value, measured in Million.
11. Are there any specific market keywords associated with the report?
Yes, the market keyword associated with the report is "Mobile 3D Market," which aids in identifying and referencing the specific market segment covered.
12. How do I determine which pricing option suits my needs best?
The pricing options vary based on user requirements and access needs. Individual users may opt for single-user licenses, while businesses requiring broader access may choose multi-user or enterprise licenses for cost-effective access to the report.
13. Are there any additional resources or data provided in the Mobile 3D Market report?
While the report offers comprehensive insights, it's advisable to review the specific contents or supplementary materials provided to ascertain if additional resources or data are available.
14. How can I stay updated on further developments or reports in the Mobile 3D Market?
To stay informed about further developments, trends, and reports in the Mobile 3D Market, consider subscribing to industry newsletters, following relevant companies and organizations, or regularly checking reputable industry news sources and publications.
Methodology
Step 1 - Identification of Relevant Samples Size from Population Database


Step 2 - Approaches for Defining Global Market Size (Value, Volume* & Price*)

Note*: In applicable scenarios
Step 3 - Data Sources
Primary Research
- Web Analytics
- Survey Reports
- Research Institute
- Latest Research Reports
- Opinion Leaders
Secondary Research
- Annual Reports
- White Paper
- Latest Press Release
- Industry Association
- Paid Database
- Investor Presentations

Step 4 - Data Triangulation
Involves using different sources of information in order to increase the validity of a study
These sources are likely to be stakeholders in a program - participants, other researchers, program staff, other community members, and so on.
Then we put all data in single framework & apply various statistical tools to find out the dynamic on the market.
During the analysis stage, feedback from the stakeholder groups would be compared to determine areas of agreement as well as areas of divergence
