

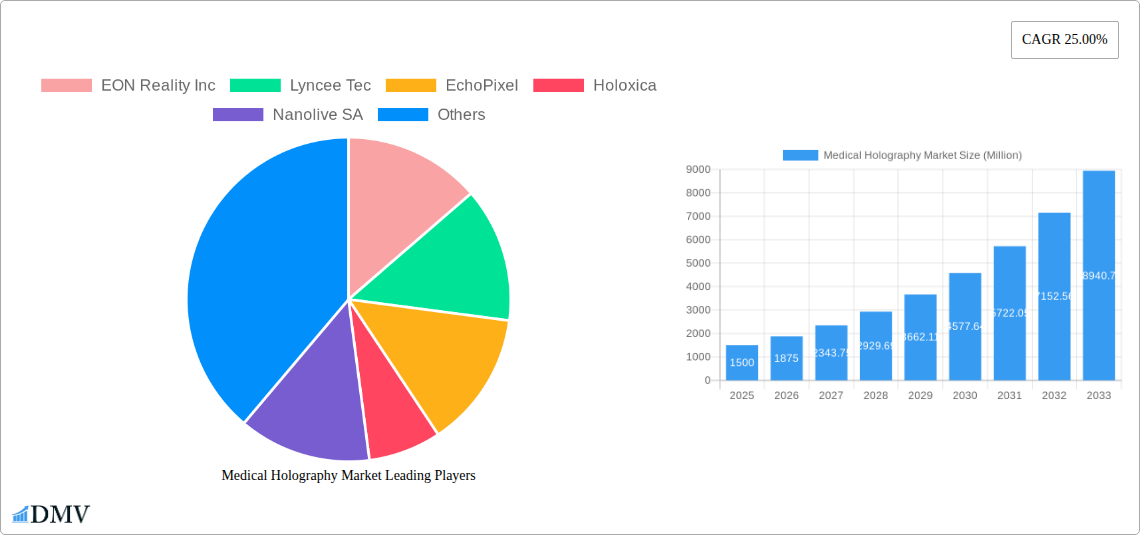
Key Insights
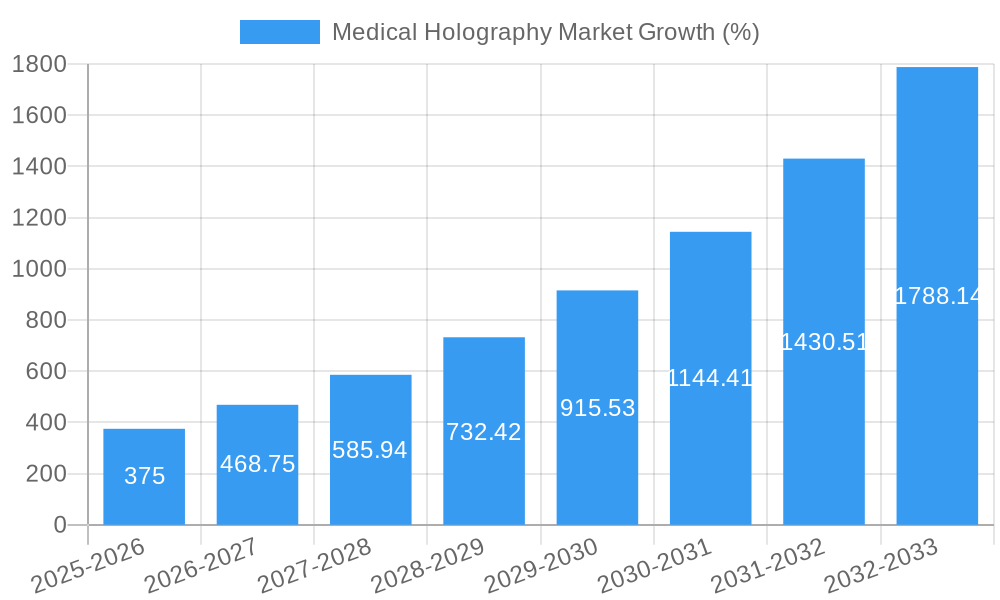
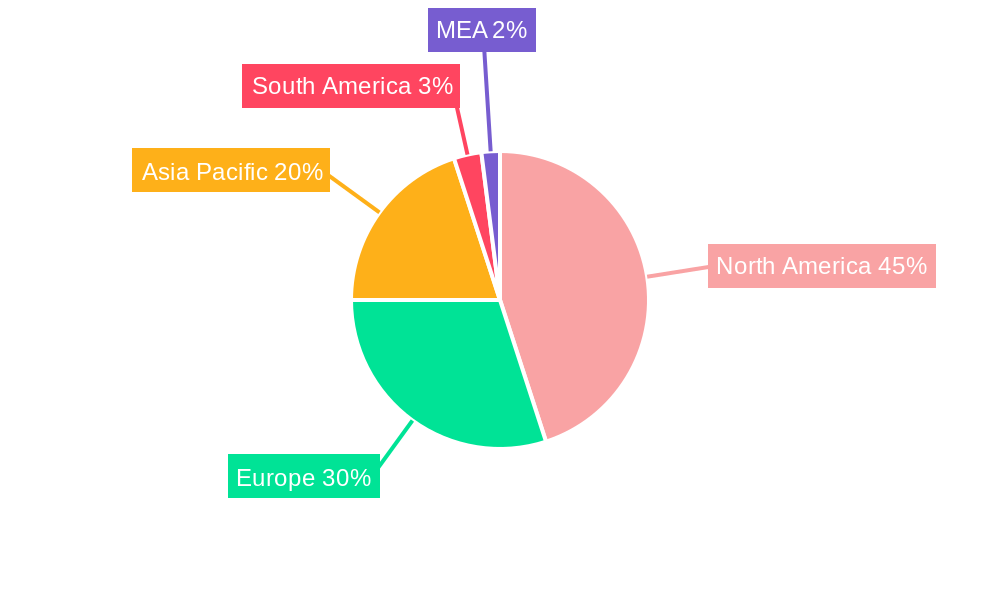
The medical holography market is experiencing robust growth, driven by the increasing adoption of advanced imaging techniques and the rising demand for minimally invasive procedures. The market's 25% CAGR indicates significant potential for expansion over the forecast period (2025-2033). Key drivers include the improved visualization capabilities of holographic technologies compared to traditional methods, leading to more accurate diagnoses and treatment planning. The ability to create 3D models of anatomical structures offers surgeons unparalleled precision during complex operations, minimizing risks and improving patient outcomes. Furthermore, the use of holography in medical education is gaining traction, offering immersive and realistic training simulations for medical professionals. While the market faces restraints like the high initial investment costs associated with holographic equipment and the need for specialized expertise, the benefits in terms of improved patient care and increased efficiency are outweighing these challenges. The market segmentation reveals that holographic displays and microscopes are the leading product types, with applications in medical imaging and education dominating the landscape. Major players like EON Reality Inc., Lyncee Tec, and Holoxica are actively contributing to technological advancements and market expansion, while the geographical distribution shows strong growth in North America and Europe, followed by the Asia-Pacific region. The substantial growth in the biopharmaceutical sector is also driving demand for advanced imaging technologies to support drug development and research. Over the next decade, we expect further technological innovations and wider adoption across various medical specialties to propel the market towards significant expansion.
The North American market currently holds the largest market share, fueled by significant investments in healthcare infrastructure and the presence of key players in the region. However, the Asia-Pacific region is projected to exhibit the fastest growth, driven by the increasing adoption of advanced medical technologies and rising disposable incomes in countries like China and India. Europe is also a key market, contributing significant revenue due to well-established healthcare systems and strong regulatory frameworks. The competitive landscape is characterized by a mix of established players and emerging companies, fostering innovation and collaboration to meet the growing demand for sophisticated holographic solutions in the medical sector. Strategic partnerships and acquisitions will likely play a major role in shaping the future dynamics of the market. Continued research and development into improving image resolution, reducing costs, and expanding applications will further solidify the position of medical holography as a vital tool in modern healthcare.
Medical Holography Market: A Comprehensive Report (2019-2033)
This insightful report provides a comprehensive analysis of the Medical Holography Market, offering a detailed examination of market trends, key players, technological advancements, and future growth prospects. The study period spans from 2019 to 2033, with 2025 serving as the base and estimated year. The forecast period covers 2025-2033, while the historical period encompasses 2019-2024. This report is crucial for stakeholders seeking to understand the dynamics of this rapidly evolving market and make informed strategic decisions. The market is projected to reach xx Million by 2033.
Medical Holography Market Market Composition & Trends
The Medical Holography Market is characterized by a moderately concentrated landscape, with several key players vying for market share. Innovation is a major catalyst, driven by advancements in holographic imaging technologies and their increasing applications in medical diagnostics and treatment. The regulatory landscape plays a significant role, influencing the adoption and commercialization of new products. Substitute products, such as advanced 2D imaging techniques, pose a competitive challenge. End-users, primarily hospitals and clinics, as well as biopharmaceutical companies, are driving demand. M&A activities are expected to increase, with larger players acquiring smaller companies with innovative technologies.
- Market Share Distribution (2025): EON Reality Inc. holds approximately xx% market share, followed by Lyncee Tec (xx%), and EchoPixel (xx%). The remaining market share is distributed among other players.
- M&A Activity (2019-2024): A total of xx M&A deals were recorded, with an aggregate value of approximately xx Million. This signifies significant consolidation and strategic investment within the sector.
- Innovation Catalysts: Development of advanced algorithms for 3D image reconstruction and improved holographic display technologies are significant catalysts.
- Regulatory Landscape: Stringent regulatory approvals for medical devices are a significant factor in market growth.
Medical Holography Market Industry Evolution
The Medical Holography Market has experienced significant growth in recent years, driven by the increasing demand for advanced medical imaging techniques. Technological advancements, such as improved resolution and reduced costs of holographic systems, have fueled market expansion. Consumer demand for non-invasive, high-resolution imaging is increasing, driving the adoption of holographic technologies in various medical applications. The market has witnessed a Compound Annual Growth Rate (CAGR) of xx% during the historical period (2019-2024) and is projected to maintain a CAGR of xx% during the forecast period (2025-2033). This growth is fueled by the increasing adoption of holographic microscopy in biomedical research and the growing use of holographic displays for medical education. Early adoption among hospitals and clinics in developed countries is contributing significantly to the market's evolution, while emerging markets are anticipated to show accelerated growth in the coming years. Market penetration of holographic technologies in surgical planning and minimally invasive procedures is also expected to rise, further boosting market expansion. The integration of AI and machine learning in holographic image analysis is an emerging trend with the potential to significantly improve diagnostic accuracy and treatment outcomes.
Leading Regions, Countries, or Segments in Medical Holography Market
North America currently dominates the Medical Holography Market, driven by high healthcare expenditure, technological advancements, and early adoption of innovative medical technologies. Within North America, the United States holds a significant market share. Europe is a rapidly growing market, followed by Asia-Pacific.
- By Product Type: Holography Microscopes currently holds the largest market share, followed by Holographic Displays. This is primarily driven by their adoption in research and diagnostics.
- By Application: Imaging in medical indications represents the largest application segment, followed by medical education. The use of holography in surgical planning and minimally invasive procedures is a rapidly growing area.
- By End User: Hospitals and Clinics are the leading end-users, followed by Biopharmaceutical Companies. This is driven by the need for high-resolution images for diagnosis and research.
Key Drivers:
- High Investment in R&D: Significant investments from both public and private sectors in developing new holographic technologies.
- Regulatory Support: Favorable regulatory frameworks in developed countries are accelerating the adoption of holographic technologies.
- Technological Advancements: Continuous improvements in resolution, speed, and cost-effectiveness of holographic systems.
Medical Holography Market Product Innovations
Recent innovations have focused on improving the resolution and speed of holographic imaging systems, while also reducing costs. New holographic microscopes offer enhanced capabilities for visualizing cellular structures and processes. Holographic displays are becoming more user-friendly and affordable, making them suitable for medical education and training. The development of software solutions for processing and analyzing holographic images is also driving product innovation. The integration of artificial intelligence and machine learning for automated image analysis is a promising area of advancement, enabling faster and more accurate diagnostics.
Propelling Factors for Medical Holography Market Growth
Technological advancements are a key driver, with improvements in holographic display technology, image resolution, and data processing capabilities. Economic factors, such as increasing healthcare spending and government funding for medical research, are also contributing. Regulatory support, particularly in the form of approvals for new medical devices incorporating holographic technology, is crucial for market expansion. The growing demand for minimally invasive surgical procedures and the increasing adoption of advanced imaging technologies in hospitals are also pushing market growth.
Obstacles in the Medical Holography Market Market
High initial investment costs associated with purchasing and implementing holographic systems represent a significant barrier. Supply chain disruptions and the scarcity of skilled personnel capable of operating and maintaining sophisticated holographic equipment also pose challenges. Competitive pressure from alternative imaging technologies, such as advanced 2D imaging techniques, is another limiting factor. Strict regulatory pathways and lengthy approval processes for new medical devices can also hinder market growth. The complexity of data processing and analysis of holographic images can also limit widespread adoption, requiring more sophisticated data analysis tools.
Future Opportunities in Medical Holography Market
Expansion into emerging markets, particularly in developing countries, presents a significant opportunity. The development of more compact, portable holographic systems would expand their accessibility and applications. The integration of artificial intelligence and machine learning to automate image analysis and enhance diagnostic accuracy offers significant potential. New applications in areas like drug discovery and development, and personalized medicine, could significantly expand market size.
Major Players in the Medical Holography Market Ecosystem
- EON Reality Inc
- Lyncee Tec
- EchoPixel
- Holoxica
- Nanolive SA
- RealView Imaging Ltd
- Ovizio
- Hexagon AB
- Zebra Imaging Inc
- Holografika Kft
- Phase Holographic Imaging PHI AB
- zSpace Inc
Key Developments in Medical Holography Market Industry
- March 2023: GigXR launched a new holographic healthcare training module focused on basic life support. This enhances medical education and training, expanding the applications of holographic technology.
- June 2022: Bruker Corporation released the NeuraLight 3D Ultra module for advanced neuroscience research. This demonstrates the application of holographic technology in specialized research areas, potentially leading to new diagnostic and treatment approaches.
Strategic Medical Holography Market Market Forecast
The Medical Holography Market is poised for robust growth in the coming years, driven by several factors. Continued technological advancements, increasing healthcare expenditure, and favorable regulatory environments will propel market expansion. New applications, particularly in minimally invasive surgery, personalized medicine, and drug discovery, offer significant opportunities. The integration of artificial intelligence and machine learning will further enhance the capabilities of holographic systems, accelerating market growth and creating new avenues for innovation. The market's future is bright, indicating significant potential for investors and businesses operating in this sector.
Medical Holography Market Segmentation
-
1. Product Type
- 1.1. Holographic Displays
- 1.2. Holography Microscopes
- 1.3. Holographic Prints
- 1.4. Holographic Software
- 1.5. Other Products
-
2. Application
- 2.1. Imaging in Medical Indications
- 2.2. Medical Education
- 2.3. Other Applications
-
3. End User
- 3.1. Hospitals/Clinics
- 3.2. Biopharmaceutical Companies
- 3.3. Other End Users
Medical Holography Market Segmentation By Geography
-
1. North America
- 1.1. United States
- 1.2. Canada
- 1.3. Mexico
-
2. Europe
- 2.1. France
- 2.2. Germany
- 2.3. United Kingdom
- 2.4. Italy
- 2.5. Spain
- 2.6. Rest of Europe
-
3. Asia Pacific
- 3.1. China
- 3.2. Japan
- 3.3. India
- 3.4. Australia
- 3.5. South Korea
- 3.6. Rest of Asia Pacific
- 4. Rest of the World
Medical Holography Market REPORT HIGHLIGHTS
| Aspects | Details |
|---|---|
| Study Period | 2019-2033 |
| Base Year | 2024 |
| Estimated Year | 2025 |
| Forecast Period | 2025-2033 |
| Historical Period | 2019-2024 |
| Growth Rate | CAGR of 25.00% from 2019-2033 |
| Segmentation |
|
Table of Contents
- 1. Introduction
- 1.1. Research Scope
- 1.2. Market Segmentation
- 1.3. Research Methodology
- 1.4. Definitions and Assumptions
- 2. Executive Summary
- 2.1. Introduction
- 3. Market Dynamics
- 3.1. Introduction
- 3.2. Market Drivers
- 3.2.1. Growing Usage of Holography Products in Medical Facilities; Technological Advancements and R&D Investments by Biopharmaceutical Companies
- 3.3. Market Restrains
- 3.3.1. High Initial Investments in Healthcare Facilities to Include Holographic Applications; Shortage of Skilled Professionals
- 3.4. Market Trends
- 3.4.1. The Holographic Display Segment is Expected to Witness Considerable Growth Over the Forecast Period
- 4. Market Factor Analysis
- 4.1. Porters Five Forces
- 4.2. Supply/Value Chain
- 4.3. PESTEL analysis
- 4.4. Market Entropy
- 4.5. Patent/Trademark Analysis
- 5. Global Medical Holography Market Analysis, Insights and Forecast, 2019-2031
- 5.1. Market Analysis, Insights and Forecast - by Product Type
- 5.1.1. Holographic Displays
- 5.1.2. Holography Microscopes
- 5.1.3. Holographic Prints
- 5.1.4. Holographic Software
- 5.1.5. Other Products
- 5.2. Market Analysis, Insights and Forecast - by Application
- 5.2.1. Imaging in Medical Indications
- 5.2.2. Medical Education
- 5.2.3. Other Applications
- 5.3. Market Analysis, Insights and Forecast - by End User
- 5.3.1. Hospitals/Clinics
- 5.3.2. Biopharmaceutical Companies
- 5.3.3. Other End Users
- 5.4. Market Analysis, Insights and Forecast - by Region
- 5.4.1. North America
- 5.4.2. Europe
- 5.4.3. Asia Pacific
- 5.4.4. Rest of the World
- 5.1. Market Analysis, Insights and Forecast - by Product Type
- 6. North America Medical Holography Market Analysis, Insights and Forecast, 2019-2031
- 6.1. Market Analysis, Insights and Forecast - by Product Type
- 6.1.1. Holographic Displays
- 6.1.2. Holography Microscopes
- 6.1.3. Holographic Prints
- 6.1.4. Holographic Software
- 6.1.5. Other Products
- 6.2. Market Analysis, Insights and Forecast - by Application
- 6.2.1. Imaging in Medical Indications
- 6.2.2. Medical Education
- 6.2.3. Other Applications
- 6.3. Market Analysis, Insights and Forecast - by End User
- 6.3.1. Hospitals/Clinics
- 6.3.2. Biopharmaceutical Companies
- 6.3.3. Other End Users
- 6.1. Market Analysis, Insights and Forecast - by Product Type
- 7. Europe Medical Holography Market Analysis, Insights and Forecast, 2019-2031
- 7.1. Market Analysis, Insights and Forecast - by Product Type
- 7.1.1. Holographic Displays
- 7.1.2. Holography Microscopes
- 7.1.3. Holographic Prints
- 7.1.4. Holographic Software
- 7.1.5. Other Products
- 7.2. Market Analysis, Insights and Forecast - by Application
- 7.2.1. Imaging in Medical Indications
- 7.2.2. Medical Education
- 7.2.3. Other Applications
- 7.3. Market Analysis, Insights and Forecast - by End User
- 7.3.1. Hospitals/Clinics
- 7.3.2. Biopharmaceutical Companies
- 7.3.3. Other End Users
- 7.1. Market Analysis, Insights and Forecast - by Product Type
- 8. Asia Pacific Medical Holography Market Analysis, Insights and Forecast, 2019-2031
- 8.1. Market Analysis, Insights and Forecast - by Product Type
- 8.1.1. Holographic Displays
- 8.1.2. Holography Microscopes
- 8.1.3. Holographic Prints
- 8.1.4. Holographic Software
- 8.1.5. Other Products
- 8.2. Market Analysis, Insights and Forecast - by Application
- 8.2.1. Imaging in Medical Indications
- 8.2.2. Medical Education
- 8.2.3. Other Applications
- 8.3. Market Analysis, Insights and Forecast - by End User
- 8.3.1. Hospitals/Clinics
- 8.3.2. Biopharmaceutical Companies
- 8.3.3. Other End Users
- 8.1. Market Analysis, Insights and Forecast - by Product Type
- 9. Rest of the World Medical Holography Market Analysis, Insights and Forecast, 2019-2031
- 9.1. Market Analysis, Insights and Forecast - by Product Type
- 9.1.1. Holographic Displays
- 9.1.2. Holography Microscopes
- 9.1.3. Holographic Prints
- 9.1.4. Holographic Software
- 9.1.5. Other Products
- 9.2. Market Analysis, Insights and Forecast - by Application
- 9.2.1. Imaging in Medical Indications
- 9.2.2. Medical Education
- 9.2.3. Other Applications
- 9.3. Market Analysis, Insights and Forecast - by End User
- 9.3.1. Hospitals/Clinics
- 9.3.2. Biopharmaceutical Companies
- 9.3.3. Other End Users
- 9.1. Market Analysis, Insights and Forecast - by Product Type
- 10. North America Medical Holography Market Analysis, Insights and Forecast, 2019-2031
- 10.1. Market Analysis, Insights and Forecast - By Country/Sub-region
- 10.1.1 United States
- 10.1.2 Canada
- 10.1.3 Mexico
- 11. Europe Medical Holography Market Analysis, Insights and Forecast, 2019-2031
- 11.1. Market Analysis, Insights and Forecast - By Country/Sub-region
- 11.1.1 Germany
- 11.1.2 United Kingdom
- 11.1.3 France
- 11.1.4 Spain
- 11.1.5 Italy
- 11.1.6 Spain
- 11.1.7 Belgium
- 11.1.8 Netherland
- 11.1.9 Nordics
- 11.1.10 Rest of Europe
- 12. Asia Pacific Medical Holography Market Analysis, Insights and Forecast, 2019-2031
- 12.1. Market Analysis, Insights and Forecast - By Country/Sub-region
- 12.1.1 China
- 12.1.2 Japan
- 12.1.3 India
- 12.1.4 South Korea
- 12.1.5 Southeast Asia
- 12.1.6 Australia
- 12.1.7 Indonesia
- 12.1.8 Phillipes
- 12.1.9 Singapore
- 12.1.10 Thailandc
- 12.1.11 Rest of Asia Pacific
- 13. South America Medical Holography Market Analysis, Insights and Forecast, 2019-2031
- 13.1. Market Analysis, Insights and Forecast - By Country/Sub-region
- 13.1.1 Brazil
- 13.1.2 Argentina
- 13.1.3 Peru
- 13.1.4 Chile
- 13.1.5 Colombia
- 13.1.6 Ecuador
- 13.1.7 Venezuela
- 13.1.8 Rest of South America
- 14. North America Medical Holography Market Analysis, Insights and Forecast, 2019-2031
- 14.1. Market Analysis, Insights and Forecast - By Country/Sub-region
- 14.1.1 United States
- 14.1.2 Canada
- 14.1.3 Mexico
- 15. MEA Medical Holography Market Analysis, Insights and Forecast, 2019-2031
- 15.1. Market Analysis, Insights and Forecast - By Country/Sub-region
- 15.1.1 United Arab Emirates
- 15.1.2 Saudi Arabia
- 15.1.3 South Africa
- 15.1.4 Rest of Middle East and Africa
- 16. Competitive Analysis
- 16.1. Global Market Share Analysis 2024
- 16.2. Company Profiles
- 16.2.1 EON Reality Inc
- 16.2.1.1. Overview
- 16.2.1.2. Products
- 16.2.1.3. SWOT Analysis
- 16.2.1.4. Recent Developments
- 16.2.1.5. Financials (Based on Availability)
- 16.2.2 Lyncee Tec
- 16.2.2.1. Overview
- 16.2.2.2. Products
- 16.2.2.3. SWOT Analysis
- 16.2.2.4. Recent Developments
- 16.2.2.5. Financials (Based on Availability)
- 16.2.3 EchoPixel
- 16.2.3.1. Overview
- 16.2.3.2. Products
- 16.2.3.3. SWOT Analysis
- 16.2.3.4. Recent Developments
- 16.2.3.5. Financials (Based on Availability)
- 16.2.4 Holoxica
- 16.2.4.1. Overview
- 16.2.4.2. Products
- 16.2.4.3. SWOT Analysis
- 16.2.4.4. Recent Developments
- 16.2.4.5. Financials (Based on Availability)
- 16.2.5 Nanolive SA
- 16.2.5.1. Overview
- 16.2.5.2. Products
- 16.2.5.3. SWOT Analysis
- 16.2.5.4. Recent Developments
- 16.2.5.5. Financials (Based on Availability)
- 16.2.6 RealView Imaging Ltd
- 16.2.6.1. Overview
- 16.2.6.2. Products
- 16.2.6.3. SWOT Analysis
- 16.2.6.4. Recent Developments
- 16.2.6.5. Financials (Based on Availability)
- 16.2.7 Ovizio
- 16.2.7.1. Overview
- 16.2.7.2. Products
- 16.2.7.3. SWOT Analysis
- 16.2.7.4. Recent Developments
- 16.2.7.5. Financials (Based on Availability)
- 16.2.8 Hexagon AB
- 16.2.8.1. Overview
- 16.2.8.2. Products
- 16.2.8.3. SWOT Analysis
- 16.2.8.4. Recent Developments
- 16.2.8.5. Financials (Based on Availability)
- 16.2.9 Zebra Imaging Inc
- 16.2.9.1. Overview
- 16.2.9.2. Products
- 16.2.9.3. SWOT Analysis
- 16.2.9.4. Recent Developments
- 16.2.9.5. Financials (Based on Availability)
- 16.2.10 Holografika Kft
- 16.2.10.1. Overview
- 16.2.10.2. Products
- 16.2.10.3. SWOT Analysis
- 16.2.10.4. Recent Developments
- 16.2.10.5. Financials (Based on Availability)
- 16.2.11 Phase Holographic Imaging PHI AB
- 16.2.11.1. Overview
- 16.2.11.2. Products
- 16.2.11.3. SWOT Analysis
- 16.2.11.4. Recent Developments
- 16.2.11.5. Financials (Based on Availability)
- 16.2.12 zSpace Inc *List Not Exhaustive
- 16.2.12.1. Overview
- 16.2.12.2. Products
- 16.2.12.3. SWOT Analysis
- 16.2.12.4. Recent Developments
- 16.2.12.5. Financials (Based on Availability)
- 16.2.1 EON Reality Inc
List of Figures
- Figure 1: Global Medical Holography Market Revenue Breakdown (Million, %) by Region 2024 & 2032
- Figure 2: North America Medical Holography Market Revenue (Million), by Country 2024 & 2032
- Figure 3: North America Medical Holography Market Revenue Share (%), by Country 2024 & 2032
- Figure 4: Europe Medical Holography Market Revenue (Million), by Country 2024 & 2032
- Figure 5: Europe Medical Holography Market Revenue Share (%), by Country 2024 & 2032
- Figure 6: Asia Pacific Medical Holography Market Revenue (Million), by Country 2024 & 2032
- Figure 7: Asia Pacific Medical Holography Market Revenue Share (%), by Country 2024 & 2032
- Figure 8: South America Medical Holography Market Revenue (Million), by Country 2024 & 2032
- Figure 9: South America Medical Holography Market Revenue Share (%), by Country 2024 & 2032
- Figure 10: North America Medical Holography Market Revenue (Million), by Country 2024 & 2032
- Figure 11: North America Medical Holography Market Revenue Share (%), by Country 2024 & 2032
- Figure 12: MEA Medical Holography Market Revenue (Million), by Country 2024 & 2032
- Figure 13: MEA Medical Holography Market Revenue Share (%), by Country 2024 & 2032
- Figure 14: North America Medical Holography Market Revenue (Million), by Product Type 2024 & 2032
- Figure 15: North America Medical Holography Market Revenue Share (%), by Product Type 2024 & 2032
- Figure 16: North America Medical Holography Market Revenue (Million), by Application 2024 & 2032
- Figure 17: North America Medical Holography Market Revenue Share (%), by Application 2024 & 2032
- Figure 18: North America Medical Holography Market Revenue (Million), by End User 2024 & 2032
- Figure 19: North America Medical Holography Market Revenue Share (%), by End User 2024 & 2032
- Figure 20: North America Medical Holography Market Revenue (Million), by Country 2024 & 2032
- Figure 21: North America Medical Holography Market Revenue Share (%), by Country 2024 & 2032
- Figure 22: Europe Medical Holography Market Revenue (Million), by Product Type 2024 & 2032
- Figure 23: Europe Medical Holography Market Revenue Share (%), by Product Type 2024 & 2032
- Figure 24: Europe Medical Holography Market Revenue (Million), by Application 2024 & 2032
- Figure 25: Europe Medical Holography Market Revenue Share (%), by Application 2024 & 2032
- Figure 26: Europe Medical Holography Market Revenue (Million), by End User 2024 & 2032
- Figure 27: Europe Medical Holography Market Revenue Share (%), by End User 2024 & 2032
- Figure 28: Europe Medical Holography Market Revenue (Million), by Country 2024 & 2032
- Figure 29: Europe Medical Holography Market Revenue Share (%), by Country 2024 & 2032
- Figure 30: Asia Pacific Medical Holography Market Revenue (Million), by Product Type 2024 & 2032
- Figure 31: Asia Pacific Medical Holography Market Revenue Share (%), by Product Type 2024 & 2032
- Figure 32: Asia Pacific Medical Holography Market Revenue (Million), by Application 2024 & 2032
- Figure 33: Asia Pacific Medical Holography Market Revenue Share (%), by Application 2024 & 2032
- Figure 34: Asia Pacific Medical Holography Market Revenue (Million), by End User 2024 & 2032
- Figure 35: Asia Pacific Medical Holography Market Revenue Share (%), by End User 2024 & 2032
- Figure 36: Asia Pacific Medical Holography Market Revenue (Million), by Country 2024 & 2032
- Figure 37: Asia Pacific Medical Holography Market Revenue Share (%), by Country 2024 & 2032
- Figure 38: Rest of the World Medical Holography Market Revenue (Million), by Product Type 2024 & 2032
- Figure 39: Rest of the World Medical Holography Market Revenue Share (%), by Product Type 2024 & 2032
- Figure 40: Rest of the World Medical Holography Market Revenue (Million), by Application 2024 & 2032
- Figure 41: Rest of the World Medical Holography Market Revenue Share (%), by Application 2024 & 2032
- Figure 42: Rest of the World Medical Holography Market Revenue (Million), by End User 2024 & 2032
- Figure 43: Rest of the World Medical Holography Market Revenue Share (%), by End User 2024 & 2032
- Figure 44: Rest of the World Medical Holography Market Revenue (Million), by Country 2024 & 2032
- Figure 45: Rest of the World Medical Holography Market Revenue Share (%), by Country 2024 & 2032
List of Tables
- Table 1: Global Medical Holography Market Revenue Million Forecast, by Region 2019 & 2032
- Table 2: Global Medical Holography Market Revenue Million Forecast, by Product Type 2019 & 2032
- Table 3: Global Medical Holography Market Revenue Million Forecast, by Application 2019 & 2032
- Table 4: Global Medical Holography Market Revenue Million Forecast, by End User 2019 & 2032
- Table 5: Global Medical Holography Market Revenue Million Forecast, by Region 2019 & 2032
- Table 6: Global Medical Holography Market Revenue Million Forecast, by Country 2019 & 2032
- Table 7: United States Medical Holography Market Revenue (Million) Forecast, by Application 2019 & 2032
- Table 8: Canada Medical Holography Market Revenue (Million) Forecast, by Application 2019 & 2032
- Table 9: Mexico Medical Holography Market Revenue (Million) Forecast, by Application 2019 & 2032
- Table 10: Global Medical Holography Market Revenue Million Forecast, by Country 2019 & 2032
- Table 11: Germany Medical Holography Market Revenue (Million) Forecast, by Application 2019 & 2032
- Table 12: United Kingdom Medical Holography Market Revenue (Million) Forecast, by Application 2019 & 2032
- Table 13: France Medical Holography Market Revenue (Million) Forecast, by Application 2019 & 2032
- Table 14: Spain Medical Holography Market Revenue (Million) Forecast, by Application 2019 & 2032
- Table 15: Italy Medical Holography Market Revenue (Million) Forecast, by Application 2019 & 2032
- Table 16: Spain Medical Holography Market Revenue (Million) Forecast, by Application 2019 & 2032
- Table 17: Belgium Medical Holography Market Revenue (Million) Forecast, by Application 2019 & 2032
- Table 18: Netherland Medical Holography Market Revenue (Million) Forecast, by Application 2019 & 2032
- Table 19: Nordics Medical Holography Market Revenue (Million) Forecast, by Application 2019 & 2032
- Table 20: Rest of Europe Medical Holography Market Revenue (Million) Forecast, by Application 2019 & 2032
- Table 21: Global Medical Holography Market Revenue Million Forecast, by Country 2019 & 2032
- Table 22: China Medical Holography Market Revenue (Million) Forecast, by Application 2019 & 2032
- Table 23: Japan Medical Holography Market Revenue (Million) Forecast, by Application 2019 & 2032
- Table 24: India Medical Holography Market Revenue (Million) Forecast, by Application 2019 & 2032
- Table 25: South Korea Medical Holography Market Revenue (Million) Forecast, by Application 2019 & 2032
- Table 26: Southeast Asia Medical Holography Market Revenue (Million) Forecast, by Application 2019 & 2032
- Table 27: Australia Medical Holography Market Revenue (Million) Forecast, by Application 2019 & 2032
- Table 28: Indonesia Medical Holography Market Revenue (Million) Forecast, by Application 2019 & 2032
- Table 29: Phillipes Medical Holography Market Revenue (Million) Forecast, by Application 2019 & 2032
- Table 30: Singapore Medical Holography Market Revenue (Million) Forecast, by Application 2019 & 2032
- Table 31: Thailandc Medical Holography Market Revenue (Million) Forecast, by Application 2019 & 2032
- Table 32: Rest of Asia Pacific Medical Holography Market Revenue (Million) Forecast, by Application 2019 & 2032
- Table 33: Global Medical Holography Market Revenue Million Forecast, by Country 2019 & 2032
- Table 34: Brazil Medical Holography Market Revenue (Million) Forecast, by Application 2019 & 2032
- Table 35: Argentina Medical Holography Market Revenue (Million) Forecast, by Application 2019 & 2032
- Table 36: Peru Medical Holography Market Revenue (Million) Forecast, by Application 2019 & 2032
- Table 37: Chile Medical Holography Market Revenue (Million) Forecast, by Application 2019 & 2032
- Table 38: Colombia Medical Holography Market Revenue (Million) Forecast, by Application 2019 & 2032
- Table 39: Ecuador Medical Holography Market Revenue (Million) Forecast, by Application 2019 & 2032
- Table 40: Venezuela Medical Holography Market Revenue (Million) Forecast, by Application 2019 & 2032
- Table 41: Rest of South America Medical Holography Market Revenue (Million) Forecast, by Application 2019 & 2032
- Table 42: Global Medical Holography Market Revenue Million Forecast, by Country 2019 & 2032
- Table 43: United States Medical Holography Market Revenue (Million) Forecast, by Application 2019 & 2032
- Table 44: Canada Medical Holography Market Revenue (Million) Forecast, by Application 2019 & 2032
- Table 45: Mexico Medical Holography Market Revenue (Million) Forecast, by Application 2019 & 2032
- Table 46: Global Medical Holography Market Revenue Million Forecast, by Country 2019 & 2032
- Table 47: United Arab Emirates Medical Holography Market Revenue (Million) Forecast, by Application 2019 & 2032
- Table 48: Saudi Arabia Medical Holography Market Revenue (Million) Forecast, by Application 2019 & 2032
- Table 49: South Africa Medical Holography Market Revenue (Million) Forecast, by Application 2019 & 2032
- Table 50: Rest of Middle East and Africa Medical Holography Market Revenue (Million) Forecast, by Application 2019 & 2032
- Table 51: Global Medical Holography Market Revenue Million Forecast, by Product Type 2019 & 2032
- Table 52: Global Medical Holography Market Revenue Million Forecast, by Application 2019 & 2032
- Table 53: Global Medical Holography Market Revenue Million Forecast, by End User 2019 & 2032
- Table 54: Global Medical Holography Market Revenue Million Forecast, by Country 2019 & 2032
- Table 55: United States Medical Holography Market Revenue (Million) Forecast, by Application 2019 & 2032
- Table 56: Canada Medical Holography Market Revenue (Million) Forecast, by Application 2019 & 2032
- Table 57: Mexico Medical Holography Market Revenue (Million) Forecast, by Application 2019 & 2032
- Table 58: Global Medical Holography Market Revenue Million Forecast, by Product Type 2019 & 2032
- Table 59: Global Medical Holography Market Revenue Million Forecast, by Application 2019 & 2032
- Table 60: Global Medical Holography Market Revenue Million Forecast, by End User 2019 & 2032
- Table 61: Global Medical Holography Market Revenue Million Forecast, by Country 2019 & 2032
- Table 62: France Medical Holography Market Revenue (Million) Forecast, by Application 2019 & 2032
- Table 63: Germany Medical Holography Market Revenue (Million) Forecast, by Application 2019 & 2032
- Table 64: United Kingdom Medical Holography Market Revenue (Million) Forecast, by Application 2019 & 2032
- Table 65: Italy Medical Holography Market Revenue (Million) Forecast, by Application 2019 & 2032
- Table 66: Spain Medical Holography Market Revenue (Million) Forecast, by Application 2019 & 2032
- Table 67: Rest of Europe Medical Holography Market Revenue (Million) Forecast, by Application 2019 & 2032
- Table 68: Global Medical Holography Market Revenue Million Forecast, by Product Type 2019 & 2032
- Table 69: Global Medical Holography Market Revenue Million Forecast, by Application 2019 & 2032
- Table 70: Global Medical Holography Market Revenue Million Forecast, by End User 2019 & 2032
- Table 71: Global Medical Holography Market Revenue Million Forecast, by Country 2019 & 2032
- Table 72: China Medical Holography Market Revenue (Million) Forecast, by Application 2019 & 2032
- Table 73: Japan Medical Holography Market Revenue (Million) Forecast, by Application 2019 & 2032
- Table 74: India Medical Holography Market Revenue (Million) Forecast, by Application 2019 & 2032
- Table 75: Australia Medical Holography Market Revenue (Million) Forecast, by Application 2019 & 2032
- Table 76: South Korea Medical Holography Market Revenue (Million) Forecast, by Application 2019 & 2032
- Table 77: Rest of Asia Pacific Medical Holography Market Revenue (Million) Forecast, by Application 2019 & 2032
- Table 78: Global Medical Holography Market Revenue Million Forecast, by Product Type 2019 & 2032
- Table 79: Global Medical Holography Market Revenue Million Forecast, by Application 2019 & 2032
- Table 80: Global Medical Holography Market Revenue Million Forecast, by End User 2019 & 2032
- Table 81: Global Medical Holography Market Revenue Million Forecast, by Country 2019 & 2032
Frequently Asked Questions
1. What is the projected Compound Annual Growth Rate (CAGR) of the Medical Holography Market?
The projected CAGR is approximately 25.00%.
2. Which companies are prominent players in the Medical Holography Market?
Key companies in the market include EON Reality Inc, Lyncee Tec, EchoPixel, Holoxica, Nanolive SA, RealView Imaging Ltd, Ovizio, Hexagon AB, Zebra Imaging Inc, Holografika Kft, Phase Holographic Imaging PHI AB, zSpace Inc *List Not Exhaustive.
3. What are the main segments of the Medical Holography Market?
The market segments include Product Type, Application, End User.
4. Can you provide details about the market size?
The market size is estimated to be USD XX Million as of 2022.
5. What are some drivers contributing to market growth?
Growing Usage of Holography Products in Medical Facilities; Technological Advancements and R&D Investments by Biopharmaceutical Companies.
6. What are the notable trends driving market growth?
The Holographic Display Segment is Expected to Witness Considerable Growth Over the Forecast Period.
7. Are there any restraints impacting market growth?
High Initial Investments in Healthcare Facilities to Include Holographic Applications; Shortage of Skilled Professionals.
8. Can you provide examples of recent developments in the market?
In March 2023, GigXR, a developer of holographic healthcare training launched a new module focused on basic life support.
9. What pricing options are available for accessing the report?
Pricing options include single-user, multi-user, and enterprise licenses priced at USD 4750, USD 5250, and USD 8750 respectively.
10. Is the market size provided in terms of value or volume?
The market size is provided in terms of value, measured in Million.
11. Are there any specific market keywords associated with the report?
Yes, the market keyword associated with the report is "Medical Holography Market," which aids in identifying and referencing the specific market segment covered.
12. How do I determine which pricing option suits my needs best?
The pricing options vary based on user requirements and access needs. Individual users may opt for single-user licenses, while businesses requiring broader access may choose multi-user or enterprise licenses for cost-effective access to the report.
13. Are there any additional resources or data provided in the Medical Holography Market report?
While the report offers comprehensive insights, it's advisable to review the specific contents or supplementary materials provided to ascertain if additional resources or data are available.
14. How can I stay updated on further developments or reports in the Medical Holography Market?
To stay informed about further developments, trends, and reports in the Medical Holography Market, consider subscribing to industry newsletters, following relevant companies and organizations, or regularly checking reputable industry news sources and publications.
Methodology
Step 1 - Identification of Relevant Samples Size from Population Database


Step 2 - Approaches for Defining Global Market Size (Value, Volume* & Price*)

Note*: In applicable scenarios
Step 3 - Data Sources
Primary Research
- Web Analytics
- Survey Reports
- Research Institute
- Latest Research Reports
- Opinion Leaders
Secondary Research
- Annual Reports
- White Paper
- Latest Press Release
- Industry Association
- Paid Database
- Investor Presentations

Step 4 - Data Triangulation
Involves using different sources of information in order to increase the validity of a study
These sources are likely to be stakeholders in a program - participants, other researchers, program staff, other community members, and so on.
Then we put all data in single framework & apply various statistical tools to find out the dynamic on the market.
During the analysis stage, feedback from the stakeholder groups would be compared to determine areas of agreement as well as areas of divergence
