

Key Insights
The LNG Storage Tank market is experiencing robust growth, driven by the increasing global demand for liquefied natural gas (LNG) as a cleaner energy source and the expansion of LNG infrastructure. The market size, estimated at $XX million in 2025, is projected to grow at a Compound Annual Growth Rate (CAGR) exceeding 5% through 2033. This growth is fueled by several key factors: the rising adoption of LNG as a fuel for transportation (maritime and trucking), the expanding power generation sector utilizing LNG, and the ongoing development of LNG import and export terminals worldwide. Technological advancements in tank design, such as the development of more efficient and cost-effective self-supporting and non-self-supporting tanks using materials like steel, 9% nickel steel, and aluminum alloys, are further contributing to market expansion. However, the market faces challenges including the volatility of LNG prices, regulatory hurdles related to LNG storage and transportation, and potential environmental concerns associated with LNG production and handling. The market is segmented by product type (self-supporting and non-self-supporting tanks) and material type, reflecting the diverse technological landscape and customer preferences. Major players like McDermott International Inc, Cryolor, and Chart Industries are actively shaping market dynamics through innovation and strategic expansion. The Asia-Pacific region, particularly China and India, are expected to witness significant growth due to increasing energy demand and infrastructure development. North America and Europe will also remain substantial markets, driven by existing infrastructure upgrades and ongoing investments in LNG facilities.
The competitive landscape is characterized by a mix of established global players and regional specialists. Companies are focusing on strategic partnerships, acquisitions, and technological advancements to maintain their market share. The industry's future growth will depend on the continued adoption of LNG as a transition fuel, the success of large-scale LNG projects, and the effective mitigation of environmental concerns. The forecast period (2025-2033) offers substantial opportunities for market expansion, with significant investment in new infrastructure and the development of innovative LNG storage solutions expected to drive growth. The ongoing shift towards cleaner energy sources and the need for reliable and efficient energy storage solutions will remain key drivers for the LNG Storage Tank market.
LNG Storage Tank Industry Market Report: 2019-2033
This comprehensive report provides an in-depth analysis of the LNG Storage Tank industry, offering invaluable insights for stakeholders seeking to navigate this dynamic market. With a focus on market trends, technological advancements, and key players, this report is essential for informed decision-making. The study period spans 2019-2033, with a base and estimated year of 2025. The market is segmented by product type (Self-Supporting Tanks, Non-Self-Supporting Tanks) and material type (Steel, 9% Nickel Steel, Aluminium Alloys, Other). The report projects a market value reaching xx Million by 2033.
LNG Storage Tank Industry Market Composition & Trends
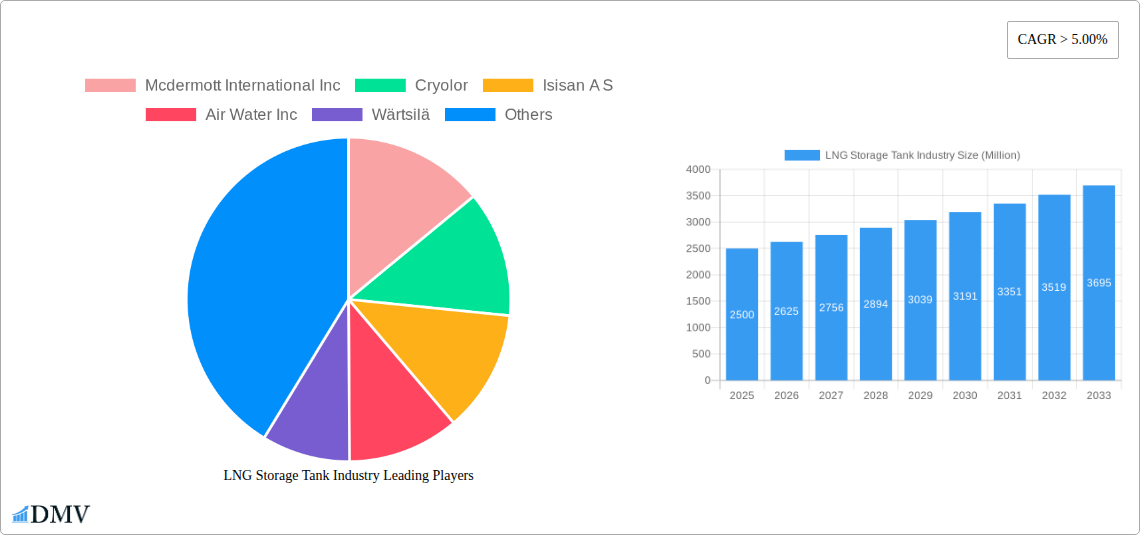
This section analyzes the competitive landscape, innovation drivers, regulatory environment, and market dynamics of the LNG Storage Tank industry. The market is moderately concentrated, with key players such as McDermott International Inc, Cryolor, Isisan A S, Air Water Inc, Wärtsilä, Linde Plc, CIMC Enric, Chart Industries, IHI Corporation, and Inox India vying for market share. Innovation is driven by the need for enhanced efficiency, safety, and cost-effectiveness in LNG storage and transportation. Stringent safety regulations and environmental concerns significantly shape the industry landscape. Substitute products like cryogenic tanks made from alternative materials pose a competitive challenge. M&A activities are expected to remain significant, although the total deal value for the period 2019-2024 was estimated at xx Million.
- Market Share Distribution: Linde Plc and Chart Industries hold a combined market share of approximately xx%, while other players account for the remaining xx%.
- M&A Deal Values (2019-2024): xx Million.
- Innovation Catalysts: Demand for larger capacity tanks, improved insulation technologies, and lighter-weight materials.
- Regulatory Landscape: Stringent safety standards and environmental regulations influence design and manufacturing.
- Substitute Products: Cryogenic tanks made from composite materials.
- End-User Profiles: Petrochemical companies, LNG producers, and energy transportation firms.

LNG Storage Tank Industry Industry Evolution
The LNG storage tank industry has witnessed substantial growth from 2019 to 2024, driven by increasing global demand for natural gas and the expansion of LNG infrastructure. Technological advancements, such as the development of advanced materials and improved insulation technologies, have enhanced the efficiency and safety of LNG storage tanks. The market experienced a Compound Annual Growth Rate (CAGR) of xx% during the historical period (2019-2024) and is projected to maintain a robust growth trajectory of xx% during the forecast period (2025-2033), driven by factors such as increasing demand from emerging economies, investments in new LNG projects, and supportive government policies. The adoption of self-supporting tanks is increasing at a CAGR of xx% due to their superior strength and ease of construction. Shifting consumer demands towards more sustainable and cost-effective storage solutions are reshaping the market. This includes increased adoption of advanced materials, such as 9% nickel steel, and a focus on minimizing environmental impact.
Leading Regions, Countries, or Segments in LNG Storage Tank Industry
The Asia-Pacific region is currently the leading market for LNG storage tanks, driven by rapid economic growth, rising energy demand, and significant investments in LNG infrastructure projects. North America and Europe also hold significant market share.
- Key Drivers (Asia-Pacific):
- Strong government support for LNG infrastructure development.
- Rising energy demand from rapidly growing economies (e.g., China, India).
- Significant investments in new LNG import terminals.
- Dominance Factors (Asia-Pacific): This region benefits from a combination of high demand, robust infrastructure investment, and favorable government policies promoting LNG adoption.
Within product types, self-supporting tanks hold the largest market share due to their superior structural strength and reduced maintenance requirements. Similarly, steel remains the dominant material due to its cost-effectiveness and readily available supply. However, the use of 9% Nickel Steel is expected to increase due to its superior cryogenic properties.
LNG Storage Tank Industry Product Innovations
Recent innovations include the development of advanced insulation systems that reduce boil-off rates, improving efficiency and reducing operational costs. Lightweight materials and improved tank designs are reducing transportation costs and improving structural integrity. Unique selling propositions focus on enhanced safety features, reduced environmental impact, and optimized operational performance. Technological advancements emphasize improved automation, remote monitoring capabilities, and predictive maintenance strategies.
Propelling Factors for LNG Storage Tank Industry Growth
The growth of the LNG storage tank industry is driven by several factors, including rising global demand for natural gas, increased investment in LNG infrastructure, and technological advancements leading to more efficient and safer storage solutions. Government policies supporting the development of cleaner energy sources and LNG infrastructure are also major contributors. Economic growth in emerging markets further fuels this growth.
Obstacles in the LNG Storage Tank Industry Market
The industry faces challenges including fluctuating raw material prices, supply chain disruptions that can delay projects, and intense competition among major players. Strict safety regulations and environmental compliance requirements also contribute to increased production costs. These factors can potentially limit the profitability and market expansion for some companies.
Future Opportunities in LNG Storage Tank Industry
Future growth will be driven by exploring new markets in developing nations, developing innovative materials for superior cryogenic performance, and incorporating advanced technologies such as IoT and AI into storage management systems. A growing focus on sustainable solutions and reducing carbon footprints presents significant opportunities for innovation and market expansion.
Major Players in the LNG Storage Tank Industry Ecosystem
- McDermott International Inc
- Cryolor
- Isisan A S
- Air Water Inc
- Wärtsilä
- Linde Plc
- CIMC Enric
- Chart Industries
- IHI Corporation
- Inox India
Key Developments in LNG Storage Tank Industry Industry
- April 2022: Linde Plc announces the expansion of its La Porte, Texas facility, doubling merchant liquid production capacity by 2024 to meet growing demand in the U.S. Gulf Coast.
- May 2022: CIMC Enric successfully develops China's first 40-foot liquid helium storage tank container, marking a significant advancement in domestic large-scale liquid helium storage and transportation technology.
Strategic LNG Storage Tank Industry Market Forecast
The LNG storage tank market is poised for continued growth, driven by increasing global demand for natural gas and ongoing investments in LNG infrastructure. Technological advancements and innovative product designs will further enhance market opportunities, particularly in emerging economies. The focus on sustainability and cost-efficiency will continue to shape the industry's trajectory, creating exciting prospects for major players and new entrants alike.
LNG Storage Tank Industry Segmentation
-
1. Product Type
- 1.1. Self-Supporting Tanks
- 1.2. Non-Self Supporting Tanks
-
2. Material Type
- 2.1. Steel
- 2.2. 9% Nickel Steel
- 2.3. Aluminium Alloys
- 2.4. Other
LNG Storage Tank Industry Segmentation By Geography
-
1. North America
- 1.1. US
- 1.2. Canada
- 1.3. Mexico
-
2. Europe
- 2.1. Germany
- 2.2. UK
- 2.3. France
- 2.4. Russia
- 2.5. Spain
- 2.6. Rest of Europe
-
3. Asia Pacific
- 3.1. India
- 3.2. China
- 3.3. Japan
- 3.4. Singapore
- 3.5. Malaysia
- 3.6. South Korea
- 3.7. Australia
- 3.8. Rest of Asia Pacific
-
4. South America
- 4.1. Brazil
- 4.2. Argentina
- 4.3. Rest of South America
- 5. Middle East
-
6. UAE
- 6.1. Saudi Arabia
- 6.2. South Africa
- 6.3. Rest of Middle East

LNG Storage Tank Industry REPORT HIGHLIGHTS
| Aspects | Details |
|---|---|
| Study Period | 2019-2033 |
| Base Year | 2024 |
| Estimated Year | 2025 |
| Forecast Period | 2025-2033 |
| Historical Period | 2019-2024 |
| Growth Rate | CAGR of > 5.00% from 2019-2033 |
| Segmentation |
|
Table of Contents
- 1. Introduction
- 1.1. Research Scope
- 1.2. Market Segmentation
- 1.3. Research Methodology
- 1.4. Definitions and Assumptions
- 2. Executive Summary
- 2.1. Introduction
- 3. Market Dynamics
- 3.1. Introduction
- 3.2. Market Drivers
- 3.2.1. 4.; Increasing Demand From Refining And Industrial Sector4.; Favourable Government Policies
- 3.3. Market Restrains
- 3.3.1. 4.; High Capital Costs For Hydrogen Energy Storage
- 3.4. Market Trends
- 3.4.1. Increasing demand for LNG
- 4. Market Factor Analysis
- 4.1. Porters Five Forces
- 4.2. Supply/Value Chain
- 4.3. PESTEL analysis
- 4.4. Market Entropy
- 4.5. Patent/Trademark Analysis
- 5. Global LNG Storage Tank Industry Analysis, Insights and Forecast, 2019-2031
- 5.1. Market Analysis, Insights and Forecast - by Product Type
- 5.1.1. Self-Supporting Tanks
- 5.1.2. Non-Self Supporting Tanks
- 5.2. Market Analysis, Insights and Forecast - by Material Type
- 5.2.1. Steel
- 5.2.2. 9% Nickel Steel
- 5.2.3. Aluminium Alloys
- 5.2.4. Other
- 5.3. Market Analysis, Insights and Forecast - by Region
- 5.3.1. North America
- 5.3.2. Europe
- 5.3.3. Asia Pacific
- 5.3.4. South America
- 5.3.5. Middle East
- 5.3.6. UAE
- 5.1. Market Analysis, Insights and Forecast - by Product Type
- 6. North America LNG Storage Tank Industry Analysis, Insights and Forecast, 2019-2031
- 6.1. Market Analysis, Insights and Forecast - by Product Type
- 6.1.1. Self-Supporting Tanks
- 6.1.2. Non-Self Supporting Tanks
- 6.2. Market Analysis, Insights and Forecast - by Material Type
- 6.2.1. Steel
- 6.2.2. 9% Nickel Steel
- 6.2.3. Aluminium Alloys
- 6.2.4. Other
- 6.1. Market Analysis, Insights and Forecast - by Product Type
- 7. Europe LNG Storage Tank Industry Analysis, Insights and Forecast, 2019-2031
- 7.1. Market Analysis, Insights and Forecast - by Product Type
- 7.1.1. Self-Supporting Tanks
- 7.1.2. Non-Self Supporting Tanks
- 7.2. Market Analysis, Insights and Forecast - by Material Type
- 7.2.1. Steel
- 7.2.2. 9% Nickel Steel
- 7.2.3. Aluminium Alloys
- 7.2.4. Other
- 7.1. Market Analysis, Insights and Forecast - by Product Type
- 8. Asia Pacific LNG Storage Tank Industry Analysis, Insights and Forecast, 2019-2031
- 8.1. Market Analysis, Insights and Forecast - by Product Type
- 8.1.1. Self-Supporting Tanks
- 8.1.2. Non-Self Supporting Tanks
- 8.2. Market Analysis, Insights and Forecast - by Material Type
- 8.2.1. Steel
- 8.2.2. 9% Nickel Steel
- 8.2.3. Aluminium Alloys
- 8.2.4. Other
- 8.1. Market Analysis, Insights and Forecast - by Product Type
- 9. South America LNG Storage Tank Industry Analysis, Insights and Forecast, 2019-2031
- 9.1. Market Analysis, Insights and Forecast - by Product Type
- 9.1.1. Self-Supporting Tanks
- 9.1.2. Non-Self Supporting Tanks
- 9.2. Market Analysis, Insights and Forecast - by Material Type
- 9.2.1. Steel
- 9.2.2. 9% Nickel Steel
- 9.2.3. Aluminium Alloys
- 9.2.4. Other
- 9.1. Market Analysis, Insights and Forecast - by Product Type
- 10. Middle East LNG Storage Tank Industry Analysis, Insights and Forecast, 2019-2031
- 10.1. Market Analysis, Insights and Forecast - by Product Type
- 10.1.1. Self-Supporting Tanks
- 10.1.2. Non-Self Supporting Tanks
- 10.2. Market Analysis, Insights and Forecast - by Material Type
- 10.2.1. Steel
- 10.2.2. 9% Nickel Steel
- 10.2.3. Aluminium Alloys
- 10.2.4. Other
- 10.1. Market Analysis, Insights and Forecast - by Product Type
- 11. UAE LNG Storage Tank Industry Analysis, Insights and Forecast, 2019-2031
- 11.1. Market Analysis, Insights and Forecast - by Product Type
- 11.1.1. Self-Supporting Tanks
- 11.1.2. Non-Self Supporting Tanks
- 11.2. Market Analysis, Insights and Forecast - by Material Type
- 11.2.1. Steel
- 11.2.2. 9% Nickel Steel
- 11.2.3. Aluminium Alloys
- 11.2.4. Other
- 11.1. Market Analysis, Insights and Forecast - by Product Type
- 12. North America LNG Storage Tank Industry Analysis, Insights and Forecast, 2019-2031
- 12.1. Market Analysis, Insights and Forecast - By Country/Sub-region
- 12.1.1 US
- 12.1.2 Canada
- 12.1.3 Mexico
- 13. Europe LNG Storage Tank Industry Analysis, Insights and Forecast, 2019-2031
- 13.1. Market Analysis, Insights and Forecast - By Country/Sub-region
- 13.1.1 Germany
- 13.1.2 UK
- 13.1.3 France
- 13.1.4 Russia
- 13.1.5 Spain
- 13.1.6 Rest of Europe
- 14. Asia Pacific LNG Storage Tank Industry Analysis, Insights and Forecast, 2019-2031
- 14.1. Market Analysis, Insights and Forecast - By Country/Sub-region
- 14.1.1 India
- 14.1.2 China
- 14.1.3 Japan
- 14.1.4 Singapore
- 14.1.5 Malaysia
- 14.1.6 South Korea
- 14.1.7 Australia
- 14.1.8 Rest of Asia Pacific
- 15. South America LNG Storage Tank Industry Analysis, Insights and Forecast, 2019-2031
- 15.1. Market Analysis, Insights and Forecast - By Country/Sub-region
- 15.1.1 Brazil
- 15.1.2 Argentina
- 15.1.3 Rest of South America
- 16. MEA LNG Storage Tank Industry Analysis, Insights and Forecast, 2019-2031
- 16.1. Market Analysis, Insights and Forecast - By Country/Sub-region
- 16.1.1 United Arab Emirates
- 16.1.2 Saudi Arabia
- 16.1.3 South Africa
- 16.1.4 Rest of Middle East and Africa
- 17. Competitive Analysis
- 17.1. Global Market Share Analysis 2024
- 17.2. Company Profiles
- 17.2.1 Mcdermott International Inc
- 17.2.1.1. Overview
- 17.2.1.2. Products
- 17.2.1.3. SWOT Analysis
- 17.2.1.4. Recent Developments
- 17.2.1.5. Financials (Based on Availability)
- 17.2.2 Cryolor
- 17.2.2.1. Overview
- 17.2.2.2. Products
- 17.2.2.3. SWOT Analysis
- 17.2.2.4. Recent Developments
- 17.2.2.5. Financials (Based on Availability)
- 17.2.3 Isisan A S
- 17.2.3.1. Overview
- 17.2.3.2. Products
- 17.2.3.3. SWOT Analysis
- 17.2.3.4. Recent Developments
- 17.2.3.5. Financials (Based on Availability)
- 17.2.4 Air Water Inc
- 17.2.4.1. Overview
- 17.2.4.2. Products
- 17.2.4.3. SWOT Analysis
- 17.2.4.4. Recent Developments
- 17.2.4.5. Financials (Based on Availability)
- 17.2.5 Wärtsilä
- 17.2.5.1. Overview
- 17.2.5.2. Products
- 17.2.5.3. SWOT Analysis
- 17.2.5.4. Recent Developments
- 17.2.5.5. Financials (Based on Availability)
- 17.2.6 Linde Plc
- 17.2.6.1. Overview
- 17.2.6.2. Products
- 17.2.6.3. SWOT Analysis
- 17.2.6.4. Recent Developments
- 17.2.6.5. Financials (Based on Availability)
- 17.2.7 Cimc Enric
- 17.2.7.1. Overview
- 17.2.7.2. Products
- 17.2.7.3. SWOT Analysis
- 17.2.7.4. Recent Developments
- 17.2.7.5. Financials (Based on Availability)
- 17.2.8 Chart Industries
- 17.2.8.1. Overview
- 17.2.8.2. Products
- 17.2.8.3. SWOT Analysis
- 17.2.8.4. Recent Developments
- 17.2.8.5. Financials (Based on Availability)
- 17.2.9 IHI Corporation
- 17.2.9.1. Overview
- 17.2.9.2. Products
- 17.2.9.3. SWOT Analysis
- 17.2.9.4. Recent Developments
- 17.2.9.5. Financials (Based on Availability)
- 17.2.10 Inox India
- 17.2.10.1. Overview
- 17.2.10.2. Products
- 17.2.10.3. SWOT Analysis
- 17.2.10.4. Recent Developments
- 17.2.10.5. Financials (Based on Availability)
- 17.2.1 Mcdermott International Inc
List of Figures
- Figure 1: Global LNG Storage Tank Industry Revenue Breakdown (Million, %) by Region 2024 & 2032
- Figure 2: Global LNG Storage Tank Industry Volume Breakdown (Litre, %) by Region 2024 & 2032
- Figure 3: North America LNG Storage Tank Industry Revenue (Million), by Country 2024 & 2032
- Figure 4: North America LNG Storage Tank Industry Volume (Litre), by Country 2024 & 2032
- Figure 5: North America LNG Storage Tank Industry Revenue Share (%), by Country 2024 & 2032
- Figure 6: North America LNG Storage Tank Industry Volume Share (%), by Country 2024 & 2032
- Figure 7: Europe LNG Storage Tank Industry Revenue (Million), by Country 2024 & 2032
- Figure 8: Europe LNG Storage Tank Industry Volume (Litre), by Country 2024 & 2032
- Figure 9: Europe LNG Storage Tank Industry Revenue Share (%), by Country 2024 & 2032
- Figure 10: Europe LNG Storage Tank Industry Volume Share (%), by Country 2024 & 2032
- Figure 11: Asia Pacific LNG Storage Tank Industry Revenue (Million), by Country 2024 & 2032
- Figure 12: Asia Pacific LNG Storage Tank Industry Volume (Litre), by Country 2024 & 2032
- Figure 13: Asia Pacific LNG Storage Tank Industry Revenue Share (%), by Country 2024 & 2032
- Figure 14: Asia Pacific LNG Storage Tank Industry Volume Share (%), by Country 2024 & 2032
- Figure 15: South America LNG Storage Tank Industry Revenue (Million), by Country 2024 & 2032
- Figure 16: South America LNG Storage Tank Industry Volume (Litre), by Country 2024 & 2032
- Figure 17: South America LNG Storage Tank Industry Revenue Share (%), by Country 2024 & 2032
- Figure 18: South America LNG Storage Tank Industry Volume Share (%), by Country 2024 & 2032
- Figure 19: MEA LNG Storage Tank Industry Revenue (Million), by Country 2024 & 2032
- Figure 20: MEA LNG Storage Tank Industry Volume (Litre), by Country 2024 & 2032
- Figure 21: MEA LNG Storage Tank Industry Revenue Share (%), by Country 2024 & 2032
- Figure 22: MEA LNG Storage Tank Industry Volume Share (%), by Country 2024 & 2032
- Figure 23: North America LNG Storage Tank Industry Revenue (Million), by Product Type 2024 & 2032
- Figure 24: North America LNG Storage Tank Industry Volume (Litre), by Product Type 2024 & 2032
- Figure 25: North America LNG Storage Tank Industry Revenue Share (%), by Product Type 2024 & 2032
- Figure 26: North America LNG Storage Tank Industry Volume Share (%), by Product Type 2024 & 2032
- Figure 27: North America LNG Storage Tank Industry Revenue (Million), by Material Type 2024 & 2032
- Figure 28: North America LNG Storage Tank Industry Volume (Litre), by Material Type 2024 & 2032
- Figure 29: North America LNG Storage Tank Industry Revenue Share (%), by Material Type 2024 & 2032
- Figure 30: North America LNG Storage Tank Industry Volume Share (%), by Material Type 2024 & 2032
- Figure 31: North America LNG Storage Tank Industry Revenue (Million), by Country 2024 & 2032
- Figure 32: North America LNG Storage Tank Industry Volume (Litre), by Country 2024 & 2032
- Figure 33: North America LNG Storage Tank Industry Revenue Share (%), by Country 2024 & 2032
- Figure 34: North America LNG Storage Tank Industry Volume Share (%), by Country 2024 & 2032
- Figure 35: Europe LNG Storage Tank Industry Revenue (Million), by Product Type 2024 & 2032
- Figure 36: Europe LNG Storage Tank Industry Volume (Litre), by Product Type 2024 & 2032
- Figure 37: Europe LNG Storage Tank Industry Revenue Share (%), by Product Type 2024 & 2032
- Figure 38: Europe LNG Storage Tank Industry Volume Share (%), by Product Type 2024 & 2032
- Figure 39: Europe LNG Storage Tank Industry Revenue (Million), by Material Type 2024 & 2032
- Figure 40: Europe LNG Storage Tank Industry Volume (Litre), by Material Type 2024 & 2032
- Figure 41: Europe LNG Storage Tank Industry Revenue Share (%), by Material Type 2024 & 2032
- Figure 42: Europe LNG Storage Tank Industry Volume Share (%), by Material Type 2024 & 2032
- Figure 43: Europe LNG Storage Tank Industry Revenue (Million), by Country 2024 & 2032
- Figure 44: Europe LNG Storage Tank Industry Volume (Litre), by Country 2024 & 2032
- Figure 45: Europe LNG Storage Tank Industry Revenue Share (%), by Country 2024 & 2032
- Figure 46: Europe LNG Storage Tank Industry Volume Share (%), by Country 2024 & 2032
- Figure 47: Asia Pacific LNG Storage Tank Industry Revenue (Million), by Product Type 2024 & 2032
- Figure 48: Asia Pacific LNG Storage Tank Industry Volume (Litre), by Product Type 2024 & 2032
- Figure 49: Asia Pacific LNG Storage Tank Industry Revenue Share (%), by Product Type 2024 & 2032
- Figure 50: Asia Pacific LNG Storage Tank Industry Volume Share (%), by Product Type 2024 & 2032
- Figure 51: Asia Pacific LNG Storage Tank Industry Revenue (Million), by Material Type 2024 & 2032
- Figure 52: Asia Pacific LNG Storage Tank Industry Volume (Litre), by Material Type 2024 & 2032
- Figure 53: Asia Pacific LNG Storage Tank Industry Revenue Share (%), by Material Type 2024 & 2032
- Figure 54: Asia Pacific LNG Storage Tank Industry Volume Share (%), by Material Type 2024 & 2032
- Figure 55: Asia Pacific LNG Storage Tank Industry Revenue (Million), by Country 2024 & 2032
- Figure 56: Asia Pacific LNG Storage Tank Industry Volume (Litre), by Country 2024 & 2032
- Figure 57: Asia Pacific LNG Storage Tank Industry Revenue Share (%), by Country 2024 & 2032
- Figure 58: Asia Pacific LNG Storage Tank Industry Volume Share (%), by Country 2024 & 2032
- Figure 59: South America LNG Storage Tank Industry Revenue (Million), by Product Type 2024 & 2032
- Figure 60: South America LNG Storage Tank Industry Volume (Litre), by Product Type 2024 & 2032
- Figure 61: South America LNG Storage Tank Industry Revenue Share (%), by Product Type 2024 & 2032
- Figure 62: South America LNG Storage Tank Industry Volume Share (%), by Product Type 2024 & 2032
- Figure 63: South America LNG Storage Tank Industry Revenue (Million), by Material Type 2024 & 2032
- Figure 64: South America LNG Storage Tank Industry Volume (Litre), by Material Type 2024 & 2032
- Figure 65: South America LNG Storage Tank Industry Revenue Share (%), by Material Type 2024 & 2032
- Figure 66: South America LNG Storage Tank Industry Volume Share (%), by Material Type 2024 & 2032
- Figure 67: South America LNG Storage Tank Industry Revenue (Million), by Country 2024 & 2032
- Figure 68: South America LNG Storage Tank Industry Volume (Litre), by Country 2024 & 2032
- Figure 69: South America LNG Storage Tank Industry Revenue Share (%), by Country 2024 & 2032
- Figure 70: South America LNG Storage Tank Industry Volume Share (%), by Country 2024 & 2032
- Figure 71: Middle East LNG Storage Tank Industry Revenue (Million), by Product Type 2024 & 2032
- Figure 72: Middle East LNG Storage Tank Industry Volume (Litre), by Product Type 2024 & 2032
- Figure 73: Middle East LNG Storage Tank Industry Revenue Share (%), by Product Type 2024 & 2032
- Figure 74: Middle East LNG Storage Tank Industry Volume Share (%), by Product Type 2024 & 2032
- Figure 75: Middle East LNG Storage Tank Industry Revenue (Million), by Material Type 2024 & 2032
- Figure 76: Middle East LNG Storage Tank Industry Volume (Litre), by Material Type 2024 & 2032
- Figure 77: Middle East LNG Storage Tank Industry Revenue Share (%), by Material Type 2024 & 2032
- Figure 78: Middle East LNG Storage Tank Industry Volume Share (%), by Material Type 2024 & 2032
- Figure 79: Middle East LNG Storage Tank Industry Revenue (Million), by Country 2024 & 2032
- Figure 80: Middle East LNG Storage Tank Industry Volume (Litre), by Country 2024 & 2032
- Figure 81: Middle East LNG Storage Tank Industry Revenue Share (%), by Country 2024 & 2032
- Figure 82: Middle East LNG Storage Tank Industry Volume Share (%), by Country 2024 & 2032
- Figure 83: UAE LNG Storage Tank Industry Revenue (Million), by Product Type 2024 & 2032
- Figure 84: UAE LNG Storage Tank Industry Volume (Litre), by Product Type 2024 & 2032
- Figure 85: UAE LNG Storage Tank Industry Revenue Share (%), by Product Type 2024 & 2032
- Figure 86: UAE LNG Storage Tank Industry Volume Share (%), by Product Type 2024 & 2032
- Figure 87: UAE LNG Storage Tank Industry Revenue (Million), by Material Type 2024 & 2032
- Figure 88: UAE LNG Storage Tank Industry Volume (Litre), by Material Type 2024 & 2032
- Figure 89: UAE LNG Storage Tank Industry Revenue Share (%), by Material Type 2024 & 2032
- Figure 90: UAE LNG Storage Tank Industry Volume Share (%), by Material Type 2024 & 2032
- Figure 91: UAE LNG Storage Tank Industry Revenue (Million), by Country 2024 & 2032
- Figure 92: UAE LNG Storage Tank Industry Volume (Litre), by Country 2024 & 2032
- Figure 93: UAE LNG Storage Tank Industry Revenue Share (%), by Country 2024 & 2032
- Figure 94: UAE LNG Storage Tank Industry Volume Share (%), by Country 2024 & 2032
List of Tables
- Table 1: Global LNG Storage Tank Industry Revenue Million Forecast, by Region 2019 & 2032
- Table 2: Global LNG Storage Tank Industry Volume Litre Forecast, by Region 2019 & 2032
- Table 3: Global LNG Storage Tank Industry Revenue Million Forecast, by Product Type 2019 & 2032
- Table 4: Global LNG Storage Tank Industry Volume Litre Forecast, by Product Type 2019 & 2032
- Table 5: Global LNG Storage Tank Industry Revenue Million Forecast, by Material Type 2019 & 2032
- Table 6: Global LNG Storage Tank Industry Volume Litre Forecast, by Material Type 2019 & 2032
- Table 7: Global LNG Storage Tank Industry Revenue Million Forecast, by Region 2019 & 2032
- Table 8: Global LNG Storage Tank Industry Volume Litre Forecast, by Region 2019 & 2032
- Table 9: Global LNG Storage Tank Industry Revenue Million Forecast, by Country 2019 & 2032
- Table 10: Global LNG Storage Tank Industry Volume Litre Forecast, by Country 2019 & 2032
- Table 11: US LNG Storage Tank Industry Revenue (Million) Forecast, by Application 2019 & 2032
- Table 12: US LNG Storage Tank Industry Volume (Litre) Forecast, by Application 2019 & 2032
- Table 13: Canada LNG Storage Tank Industry Revenue (Million) Forecast, by Application 2019 & 2032
- Table 14: Canada LNG Storage Tank Industry Volume (Litre) Forecast, by Application 2019 & 2032
- Table 15: Mexico LNG Storage Tank Industry Revenue (Million) Forecast, by Application 2019 & 2032
- Table 16: Mexico LNG Storage Tank Industry Volume (Litre) Forecast, by Application 2019 & 2032
- Table 17: Global LNG Storage Tank Industry Revenue Million Forecast, by Country 2019 & 2032
- Table 18: Global LNG Storage Tank Industry Volume Litre Forecast, by Country 2019 & 2032
- Table 19: Germany LNG Storage Tank Industry Revenue (Million) Forecast, by Application 2019 & 2032
- Table 20: Germany LNG Storage Tank Industry Volume (Litre) Forecast, by Application 2019 & 2032
- Table 21: UK LNG Storage Tank Industry Revenue (Million) Forecast, by Application 2019 & 2032
- Table 22: UK LNG Storage Tank Industry Volume (Litre) Forecast, by Application 2019 & 2032
- Table 23: France LNG Storage Tank Industry Revenue (Million) Forecast, by Application 2019 & 2032
- Table 24: France LNG Storage Tank Industry Volume (Litre) Forecast, by Application 2019 & 2032
- Table 25: Russia LNG Storage Tank Industry Revenue (Million) Forecast, by Application 2019 & 2032
- Table 26: Russia LNG Storage Tank Industry Volume (Litre) Forecast, by Application 2019 & 2032
- Table 27: Spain LNG Storage Tank Industry Revenue (Million) Forecast, by Application 2019 & 2032
- Table 28: Spain LNG Storage Tank Industry Volume (Litre) Forecast, by Application 2019 & 2032
- Table 29: Rest of Europe LNG Storage Tank Industry Revenue (Million) Forecast, by Application 2019 & 2032
- Table 30: Rest of Europe LNG Storage Tank Industry Volume (Litre) Forecast, by Application 2019 & 2032
- Table 31: Global LNG Storage Tank Industry Revenue Million Forecast, by Country 2019 & 2032
- Table 32: Global LNG Storage Tank Industry Volume Litre Forecast, by Country 2019 & 2032
- Table 33: India LNG Storage Tank Industry Revenue (Million) Forecast, by Application 2019 & 2032
- Table 34: India LNG Storage Tank Industry Volume (Litre) Forecast, by Application 2019 & 2032
- Table 35: China LNG Storage Tank Industry Revenue (Million) Forecast, by Application 2019 & 2032
- Table 36: China LNG Storage Tank Industry Volume (Litre) Forecast, by Application 2019 & 2032
- Table 37: Japan LNG Storage Tank Industry Revenue (Million) Forecast, by Application 2019 & 2032
- Table 38: Japan LNG Storage Tank Industry Volume (Litre) Forecast, by Application 2019 & 2032
- Table 39: Singapore LNG Storage Tank Industry Revenue (Million) Forecast, by Application 2019 & 2032
- Table 40: Singapore LNG Storage Tank Industry Volume (Litre) Forecast, by Application 2019 & 2032
- Table 41: Malaysia LNG Storage Tank Industry Revenue (Million) Forecast, by Application 2019 & 2032
- Table 42: Malaysia LNG Storage Tank Industry Volume (Litre) Forecast, by Application 2019 & 2032
- Table 43: South Korea LNG Storage Tank Industry Revenue (Million) Forecast, by Application 2019 & 2032
- Table 44: South Korea LNG Storage Tank Industry Volume (Litre) Forecast, by Application 2019 & 2032
- Table 45: Australia LNG Storage Tank Industry Revenue (Million) Forecast, by Application 2019 & 2032
- Table 46: Australia LNG Storage Tank Industry Volume (Litre) Forecast, by Application 2019 & 2032
- Table 47: Rest of Asia Pacific LNG Storage Tank Industry Revenue (Million) Forecast, by Application 2019 & 2032
- Table 48: Rest of Asia Pacific LNG Storage Tank Industry Volume (Litre) Forecast, by Application 2019 & 2032
- Table 49: Global LNG Storage Tank Industry Revenue Million Forecast, by Country 2019 & 2032
- Table 50: Global LNG Storage Tank Industry Volume Litre Forecast, by Country 2019 & 2032
- Table 51: Brazil LNG Storage Tank Industry Revenue (Million) Forecast, by Application 2019 & 2032
- Table 52: Brazil LNG Storage Tank Industry Volume (Litre) Forecast, by Application 2019 & 2032
- Table 53: Argentina LNG Storage Tank Industry Revenue (Million) Forecast, by Application 2019 & 2032
- Table 54: Argentina LNG Storage Tank Industry Volume (Litre) Forecast, by Application 2019 & 2032
- Table 55: Rest of South America LNG Storage Tank Industry Revenue (Million) Forecast, by Application 2019 & 2032
- Table 56: Rest of South America LNG Storage Tank Industry Volume (Litre) Forecast, by Application 2019 & 2032
- Table 57: Global LNG Storage Tank Industry Revenue Million Forecast, by Country 2019 & 2032
- Table 58: Global LNG Storage Tank Industry Volume Litre Forecast, by Country 2019 & 2032
- Table 59: United Arab Emirates LNG Storage Tank Industry Revenue (Million) Forecast, by Application 2019 & 2032
- Table 60: United Arab Emirates LNG Storage Tank Industry Volume (Litre) Forecast, by Application 2019 & 2032
- Table 61: Saudi Arabia LNG Storage Tank Industry Revenue (Million) Forecast, by Application 2019 & 2032
- Table 62: Saudi Arabia LNG Storage Tank Industry Volume (Litre) Forecast, by Application 2019 & 2032
- Table 63: South Africa LNG Storage Tank Industry Revenue (Million) Forecast, by Application 2019 & 2032
- Table 64: South Africa LNG Storage Tank Industry Volume (Litre) Forecast, by Application 2019 & 2032
- Table 65: Rest of Middle East and Africa LNG Storage Tank Industry Revenue (Million) Forecast, by Application 2019 & 2032
- Table 66: Rest of Middle East and Africa LNG Storage Tank Industry Volume (Litre) Forecast, by Application 2019 & 2032
- Table 67: Global LNG Storage Tank Industry Revenue Million Forecast, by Product Type 2019 & 2032
- Table 68: Global LNG Storage Tank Industry Volume Litre Forecast, by Product Type 2019 & 2032
- Table 69: Global LNG Storage Tank Industry Revenue Million Forecast, by Material Type 2019 & 2032
- Table 70: Global LNG Storage Tank Industry Volume Litre Forecast, by Material Type 2019 & 2032
- Table 71: Global LNG Storage Tank Industry Revenue Million Forecast, by Country 2019 & 2032
- Table 72: Global LNG Storage Tank Industry Volume Litre Forecast, by Country 2019 & 2032
- Table 73: US LNG Storage Tank Industry Revenue (Million) Forecast, by Application 2019 & 2032
- Table 74: US LNG Storage Tank Industry Volume (Litre) Forecast, by Application 2019 & 2032
- Table 75: Canada LNG Storage Tank Industry Revenue (Million) Forecast, by Application 2019 & 2032
- Table 76: Canada LNG Storage Tank Industry Volume (Litre) Forecast, by Application 2019 & 2032
- Table 77: Mexico LNG Storage Tank Industry Revenue (Million) Forecast, by Application 2019 & 2032
- Table 78: Mexico LNG Storage Tank Industry Volume (Litre) Forecast, by Application 2019 & 2032
- Table 79: Global LNG Storage Tank Industry Revenue Million Forecast, by Product Type 2019 & 2032
- Table 80: Global LNG Storage Tank Industry Volume Litre Forecast, by Product Type 2019 & 2032
- Table 81: Global LNG Storage Tank Industry Revenue Million Forecast, by Material Type 2019 & 2032
- Table 82: Global LNG Storage Tank Industry Volume Litre Forecast, by Material Type 2019 & 2032
- Table 83: Global LNG Storage Tank Industry Revenue Million Forecast, by Country 2019 & 2032
- Table 84: Global LNG Storage Tank Industry Volume Litre Forecast, by Country 2019 & 2032
- Table 85: Germany LNG Storage Tank Industry Revenue (Million) Forecast, by Application 2019 & 2032
- Table 86: Germany LNG Storage Tank Industry Volume (Litre) Forecast, by Application 2019 & 2032
- Table 87: UK LNG Storage Tank Industry Revenue (Million) Forecast, by Application 2019 & 2032
- Table 88: UK LNG Storage Tank Industry Volume (Litre) Forecast, by Application 2019 & 2032
- Table 89: France LNG Storage Tank Industry Revenue (Million) Forecast, by Application 2019 & 2032
- Table 90: France LNG Storage Tank Industry Volume (Litre) Forecast, by Application 2019 & 2032
- Table 91: Russia LNG Storage Tank Industry Revenue (Million) Forecast, by Application 2019 & 2032
- Table 92: Russia LNG Storage Tank Industry Volume (Litre) Forecast, by Application 2019 & 2032
- Table 93: Spain LNG Storage Tank Industry Revenue (Million) Forecast, by Application 2019 & 2032
- Table 94: Spain LNG Storage Tank Industry Volume (Litre) Forecast, by Application 2019 & 2032
- Table 95: Rest of Europe LNG Storage Tank Industry Revenue (Million) Forecast, by Application 2019 & 2032
- Table 96: Rest of Europe LNG Storage Tank Industry Volume (Litre) Forecast, by Application 2019 & 2032
- Table 97: Global LNG Storage Tank Industry Revenue Million Forecast, by Product Type 2019 & 2032
- Table 98: Global LNG Storage Tank Industry Volume Litre Forecast, by Product Type 2019 & 2032
- Table 99: Global LNG Storage Tank Industry Revenue Million Forecast, by Material Type 2019 & 2032
- Table 100: Global LNG Storage Tank Industry Volume Litre Forecast, by Material Type 2019 & 2032
- Table 101: Global LNG Storage Tank Industry Revenue Million Forecast, by Country 2019 & 2032
- Table 102: Global LNG Storage Tank Industry Volume Litre Forecast, by Country 2019 & 2032
- Table 103: India LNG Storage Tank Industry Revenue (Million) Forecast, by Application 2019 & 2032
- Table 104: India LNG Storage Tank Industry Volume (Litre) Forecast, by Application 2019 & 2032
- Table 105: China LNG Storage Tank Industry Revenue (Million) Forecast, by Application 2019 & 2032
- Table 106: China LNG Storage Tank Industry Volume (Litre) Forecast, by Application 2019 & 2032
- Table 107: Japan LNG Storage Tank Industry Revenue (Million) Forecast, by Application 2019 & 2032
- Table 108: Japan LNG Storage Tank Industry Volume (Litre) Forecast, by Application 2019 & 2032
- Table 109: Singapore LNG Storage Tank Industry Revenue (Million) Forecast, by Application 2019 & 2032
- Table 110: Singapore LNG Storage Tank Industry Volume (Litre) Forecast, by Application 2019 & 2032
- Table 111: Malaysia LNG Storage Tank Industry Revenue (Million) Forecast, by Application 2019 & 2032
- Table 112: Malaysia LNG Storage Tank Industry Volume (Litre) Forecast, by Application 2019 & 2032
- Table 113: South Korea LNG Storage Tank Industry Revenue (Million) Forecast, by Application 2019 & 2032
- Table 114: South Korea LNG Storage Tank Industry Volume (Litre) Forecast, by Application 2019 & 2032
- Table 115: Australia LNG Storage Tank Industry Revenue (Million) Forecast, by Application 2019 & 2032
- Table 116: Australia LNG Storage Tank Industry Volume (Litre) Forecast, by Application 2019 & 2032
- Table 117: Rest of Asia Pacific LNG Storage Tank Industry Revenue (Million) Forecast, by Application 2019 & 2032
- Table 118: Rest of Asia Pacific LNG Storage Tank Industry Volume (Litre) Forecast, by Application 2019 & 2032
- Table 119: Global LNG Storage Tank Industry Revenue Million Forecast, by Product Type 2019 & 2032
- Table 120: Global LNG Storage Tank Industry Volume Litre Forecast, by Product Type 2019 & 2032
- Table 121: Global LNG Storage Tank Industry Revenue Million Forecast, by Material Type 2019 & 2032
- Table 122: Global LNG Storage Tank Industry Volume Litre Forecast, by Material Type 2019 & 2032
- Table 123: Global LNG Storage Tank Industry Revenue Million Forecast, by Country 2019 & 2032
- Table 124: Global LNG Storage Tank Industry Volume Litre Forecast, by Country 2019 & 2032
- Table 125: Brazil LNG Storage Tank Industry Revenue (Million) Forecast, by Application 2019 & 2032
- Table 126: Brazil LNG Storage Tank Industry Volume (Litre) Forecast, by Application 2019 & 2032
- Table 127: Argentina LNG Storage Tank Industry Revenue (Million) Forecast, by Application 2019 & 2032
- Table 128: Argentina LNG Storage Tank Industry Volume (Litre) Forecast, by Application 2019 & 2032
- Table 129: Rest of South America LNG Storage Tank Industry Revenue (Million) Forecast, by Application 2019 & 2032
- Table 130: Rest of South America LNG Storage Tank Industry Volume (Litre) Forecast, by Application 2019 & 2032
- Table 131: Global LNG Storage Tank Industry Revenue Million Forecast, by Product Type 2019 & 2032
- Table 132: Global LNG Storage Tank Industry Volume Litre Forecast, by Product Type 2019 & 2032
- Table 133: Global LNG Storage Tank Industry Revenue Million Forecast, by Material Type 2019 & 2032
- Table 134: Global LNG Storage Tank Industry Volume Litre Forecast, by Material Type 2019 & 2032
- Table 135: Global LNG Storage Tank Industry Revenue Million Forecast, by Country 2019 & 2032
- Table 136: Global LNG Storage Tank Industry Volume Litre Forecast, by Country 2019 & 2032
- Table 137: Global LNG Storage Tank Industry Revenue Million Forecast, by Product Type 2019 & 2032
- Table 138: Global LNG Storage Tank Industry Volume Litre Forecast, by Product Type 2019 & 2032
- Table 139: Global LNG Storage Tank Industry Revenue Million Forecast, by Material Type 2019 & 2032
- Table 140: Global LNG Storage Tank Industry Volume Litre Forecast, by Material Type 2019 & 2032
- Table 141: Global LNG Storage Tank Industry Revenue Million Forecast, by Country 2019 & 2032
- Table 142: Global LNG Storage Tank Industry Volume Litre Forecast, by Country 2019 & 2032
- Table 143: Saudi Arabia LNG Storage Tank Industry Revenue (Million) Forecast, by Application 2019 & 2032
- Table 144: Saudi Arabia LNG Storage Tank Industry Volume (Litre) Forecast, by Application 2019 & 2032
- Table 145: South Africa LNG Storage Tank Industry Revenue (Million) Forecast, by Application 2019 & 2032
- Table 146: South Africa LNG Storage Tank Industry Volume (Litre) Forecast, by Application 2019 & 2032
- Table 147: Rest of Middle East LNG Storage Tank Industry Revenue (Million) Forecast, by Application 2019 & 2032
- Table 148: Rest of Middle East LNG Storage Tank Industry Volume (Litre) Forecast, by Application 2019 & 2032
Frequently Asked Questions
1. What is the projected Compound Annual Growth Rate (CAGR) of the LNG Storage Tank Industry?
The projected CAGR is approximately > 5.00%.
2. Which companies are prominent players in the LNG Storage Tank Industry?
Key companies in the market include Mcdermott International Inc, Cryolor, Isisan A S, Air Water Inc, Wärtsilä, Linde Plc, Cimc Enric, Chart Industries, IHI Corporation, Inox India.
3. What are the main segments of the LNG Storage Tank Industry?
The market segments include Product Type, Material Type.
4. Can you provide details about the market size?
The market size is estimated to be USD XX Million as of 2022.
5. What are some drivers contributing to market growth?
4.; Increasing Demand From Refining And Industrial Sector4.; Favourable Government Policies.
6. What are the notable trends driving market growth?
Increasing demand for LNG.
7. Are there any restraints impacting market growth?
4.; High Capital Costs For Hydrogen Energy Storage.
8. Can you provide examples of recent developments in the market?
On 13 April 2022, Linde announced that it is expanding its La Porte, Texas, facility, effectively doubling the facility's merchant liquid production capacity. The increased capacity will help Linde to meet growing demand from the petrochemicals, clean energy, manufacturing, food and aerospace sectors in the U.S. Gulf Coast and is estimated to start by 2024. The expansion will also supply Linde's existing Gulf Coast pipeline system, which includes nitrogen and oxygen pipelines extending from the Houston ship channel south to Freeport, Texas.
9. What pricing options are available for accessing the report?
Pricing options include single-user, multi-user, and enterprise licenses priced at USD 4750, USD 5250, and USD 8750 respectively.
10. Is the market size provided in terms of value or volume?
The market size is provided in terms of value, measured in Million and volume, measured in Litre.
11. Are there any specific market keywords associated with the report?
Yes, the market keyword associated with the report is "LNG Storage Tank Industry," which aids in identifying and referencing the specific market segment covered.
12. How do I determine which pricing option suits my needs best?
The pricing options vary based on user requirements and access needs. Individual users may opt for single-user licenses, while businesses requiring broader access may choose multi-user or enterprise licenses for cost-effective access to the report.
13. Are there any additional resources or data provided in the LNG Storage Tank Industry report?
While the report offers comprehensive insights, it's advisable to review the specific contents or supplementary materials provided to ascertain if additional resources or data are available.
14. How can I stay updated on further developments or reports in the LNG Storage Tank Industry?
To stay informed about further developments, trends, and reports in the LNG Storage Tank Industry, consider subscribing to industry newsletters, following relevant companies and organizations, or regularly checking reputable industry news sources and publications.
Methodology
Step 1 - Identification of Relevant Samples Size from Population Database


Step 2 - Approaches for Defining Global Market Size (Value, Volume* & Price*)

Note*: In applicable scenarios
Step 3 - Data Sources
Primary Research
- Web Analytics
- Survey Reports
- Research Institute
- Latest Research Reports
- Opinion Leaders
Secondary Research
- Annual Reports
- White Paper
- Latest Press Release
- Industry Association
- Paid Database
- Investor Presentations

Step 4 - Data Triangulation
Involves using different sources of information in order to increase the validity of a study
These sources are likely to be stakeholders in a program - participants, other researchers, program staff, other community members, and so on.
Then we put all data in single framework & apply various statistical tools to find out the dynamic on the market.
During the analysis stage, feedback from the stakeholder groups would be compared to determine areas of agreement as well as areas of divergence
