

Key Insights
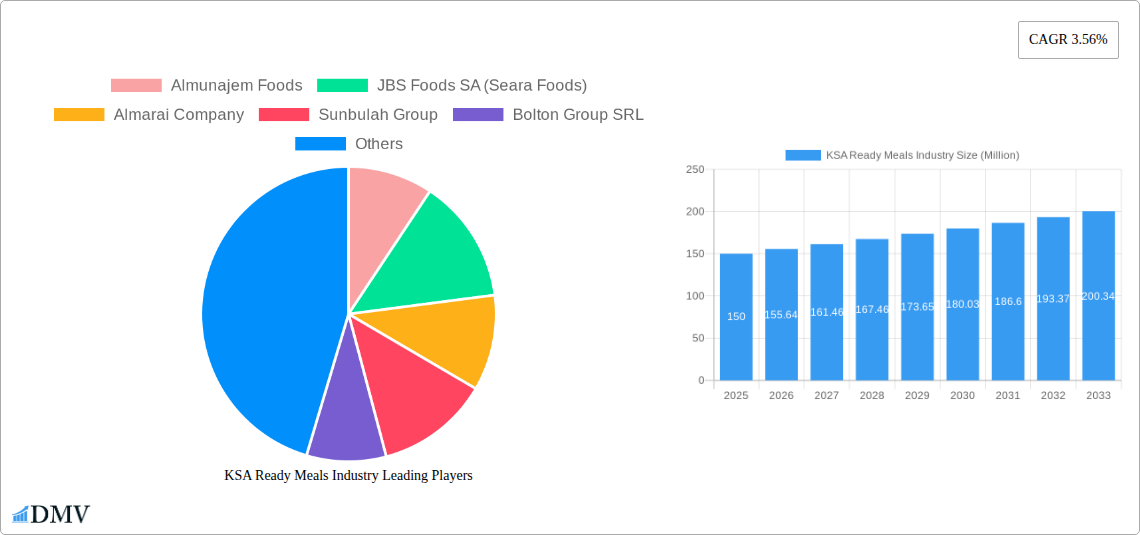
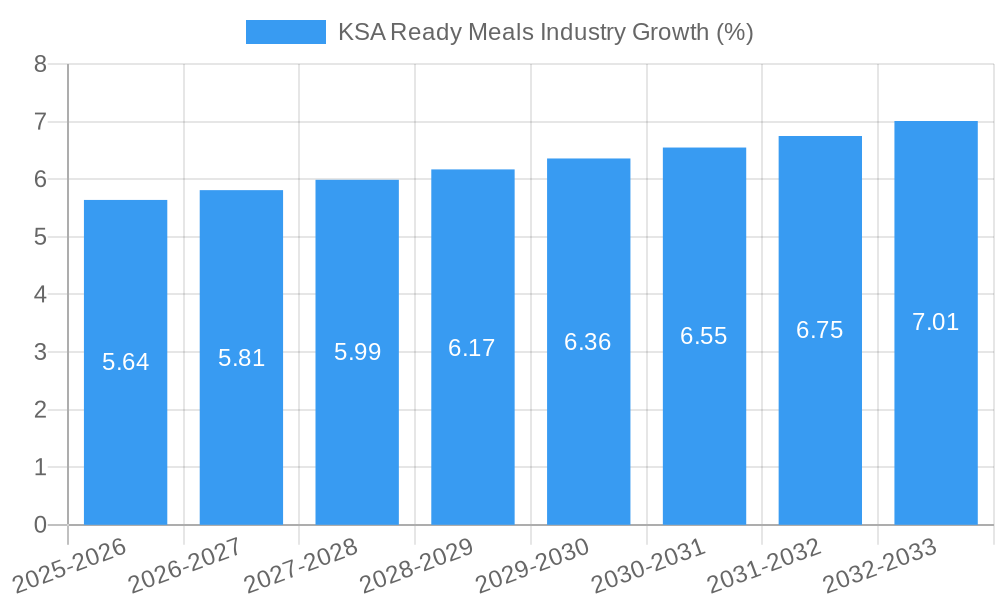
The KSA ready meals market, valued at approximately $XX million in 2025, is projected to experience robust growth, driven by factors such as increasing urbanization, busy lifestyles, and a growing preference for convenient food options. The rising disposable incomes within the Kingdom are fueling demand for premium and diverse ready meal options, while the expansion of organized retail channels, including hypermarkets, supermarkets, and online retail stores, facilitates wider product availability. A significant portion of this market is captured by chilled ready meals, reflecting the preference for fresher products. However, the segment is also witnessing growth in ambient ready meals, driven by longer shelf-life and ease of storage, particularly appealing to a younger demographic. Major players like Almunajem Foods, JBS Foods SA (Seara Foods), and Almarai Company dominate the market, with increasing competition from smaller players focusing on niche segments such as organic or halal-certified options. Government initiatives supporting food diversification and local production contribute positively to the market's expansion. Nonetheless, challenges persist in terms of maintaining consistent product quality and addressing concerns about food safety and nutritional value. The market's growth is expected to moderate slightly in the coming years, stabilizing around a CAGR of 3.56% through 2033, reflecting a maturing market and potential saturation in certain segments.
The forecast period (2025-2033) anticipates continued market expansion, though at a pace somewhat tempered by existing market conditions. The chilled ready meal segment will maintain its leading position, but the ambient ready meal category is expected to show the highest growth rate due to its inherent convenience. Online retail channels are projected to exhibit substantial growth, exceeding the expansion rate of traditional channels. The market will also see increased product diversification, with a focus on catering to health-conscious consumers through options like organic and healthier ingredients. Continued investment in infrastructure and logistics will be crucial for seamless distribution and maintaining the quality and safety of ready meals, which will play a key role in sustaining consumer confidence. Furthermore, successful marketing strategies emphasizing convenience, health benefits, and cultural relevance will be paramount for companies looking to gain a competitive edge in this dynamic and evolving market.
KSA Ready Meals Industry: A Comprehensive Market Report (2019-2033)
This insightful report provides a detailed analysis of the burgeoning KSA ready meals industry, offering valuable insights for stakeholders seeking to navigate this dynamic market. With a comprehensive study period spanning 2019-2033, a base year of 2025, and a forecast period extending to 2033, this report presents a robust overview of market trends, key players, and future growth prospects. The report analyzes a market valued at xx Million USD in 2025, projected to reach xx Million USD by 2033.
KSA Ready Meals Industry Market Composition & Trends
This section delves into the competitive landscape of the KSA ready meals market, examining market concentration, innovation drivers, regulatory frameworks, substitute products, end-user profiles, and mergers & acquisitions (M&A) activities. The report analyzes market share distribution amongst key players like Almunajem Foods, JBS Foods SA (Seara Foods), Almarai Company, Sunbulah Group, and Americana Group, amongst others. It also explores the impact of M&A activities, analyzing deal values and their influence on market dynamics. Innovation catalysts, such as the rising demand for convenient and healthy meal options, are examined alongside regulatory changes and the emergence of substitute products, shaping the overall market trajectory.
- Market Concentration: Analysis of market share held by top 5 players; xx% market share controlled by the top 3 players in 2024.
- Innovation Catalysts: Growing demand for convenient, healthy, and halal-certified ready meals fuels innovation.
- Regulatory Landscape: Impact of Saudi food safety regulations and labeling requirements on market players.
- Substitute Products: Competition from home-cooked meals and other quick-service food options.
- End-User Profiles: Demographic segmentation of consumers based on age, income, and lifestyle.
- M&A Activities: Analysis of past M&A deals (including values) and their implications for market consolidation.
KSA Ready Meals Industry Industry Evolution
This section provides a detailed analysis of the KSA ready meals industry's evolution, tracing market growth trajectories, technological advancements, and evolving consumer preferences from 2019 to 2033. We examine the impact of factors such as increasing urbanization, changing lifestyles, and rising disposable incomes on the growth of the ready meals market. The report includes specific data points like compound annual growth rates (CAGR) for various segments and adoption metrics for new technologies. The evolution of product types (frozen, chilled, ambient), distribution channels, and consumer preferences are thoroughly discussed.
Leading Regions, Countries, or Segments in KSA Ready Meals Industry
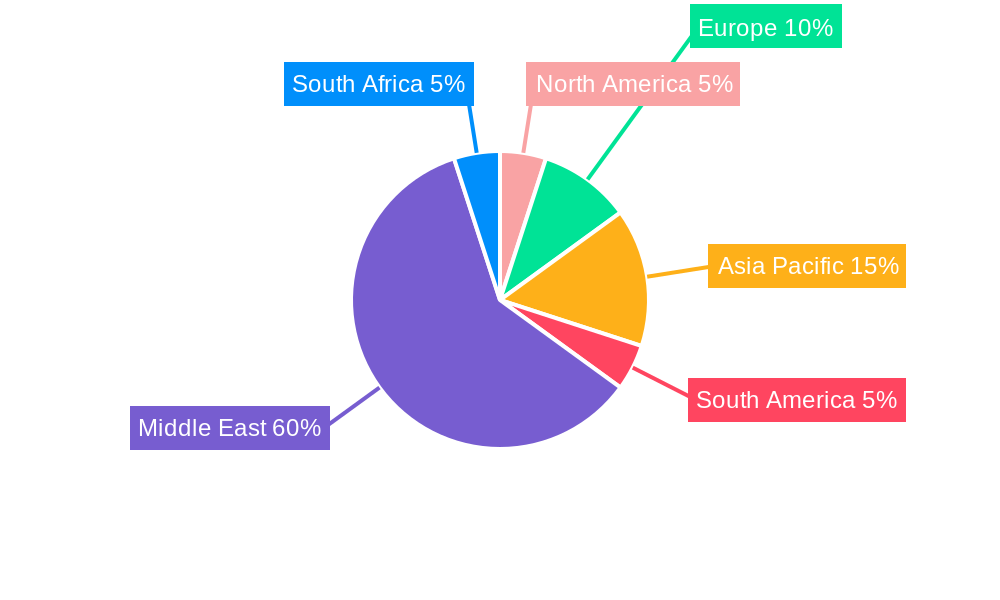
This section identifies the leading regions, countries, or segments within the KSA ready meals market based on product type (Frozen Ready Meal, Chilled Ready Meal, Ambient Ready Meal) and distribution channel (Hypermarkets/Supermarkets, Convenience Stores, Online Retail Stores, Other Distribution Channels). The analysis highlights key drivers of dominance for each segment using bullet points and in-depth paragraph analysis.
- Dominant Segment: Frozen ready meals, driven by longer shelf life and consumer preference.
- Key Drivers:
- Frozen Ready Meals: Longer shelf life, convenience, and affordability.
- Chilled Ready Meals: Focus on freshness and higher quality ingredients.
- Ambient Ready Meals: Ease of storage and suitability for longer trips.
- Hypermarkets/Supermarkets: Large reach and established distribution networks.
- Convenience Stores: Convenience and accessibility for busy consumers.
- Online Retail Stores: Growing e-commerce penetration and ease of access for customers.
KSA Ready Meals Industry Product Innovations
This section details recent product innovations within the KSA ready meals industry, highlighting new product launches, technological advancements, and the unique selling propositions that are driving market growth. The report examines the impact of these innovations on consumer behavior and market trends, emphasizing performance metrics and the overall contribution to market expansion.
Propelling Factors for KSA Ready Meals Industry Growth
This section identifies the key drivers contributing to the growth of the KSA ready meals market. These drivers include, but are not limited to, technological advancements in food processing and preservation, economic growth leading to increased disposable incomes, and supportive government regulations promoting food safety and industry development. Specific examples of such factors will be provided in the report.
Obstacles in the KSA Ready Meals Industry Market
This section outlines the significant barriers and constraints limiting the growth of the KSA ready meals market. These could include regulatory hurdles, supply chain disruptions (quantifiable impact in terms of delays or increased costs), and intensifying competitive pressure. The report analyzes the impact of these obstacles on market growth and profitability.
Future Opportunities in KSA Ready Meals Industry
This section explores emerging opportunities for growth within the KSA ready meals industry, focusing on potential new markets, innovative technologies, and evolving consumer trends. It identifies potential areas for expansion and highlights the strategies that companies can employ to capitalize on these opportunities.
Major Players in the KSA Ready Meals Industry Ecosystem
- Almunajem Foods
- JBS Foods SA (Seara Foods)
- Almarai Company
- Sunbulah Group
- Bolton Group SRL
- Americana Group
- Al Karamah Dough Production Co Ltd
- Zen Frozen Foods
- Al Kabeer Group
- The Oetker Group
- List Not Exhaustive
Key Developments in KSA Ready Meals Industry Industry
- June 2023: Almarai Company signed a memorandum of understanding with the Ministry of Investment to develop the food industry, including ready meals. This significantly impacts market growth by opening new investment avenues.
- July 2022: BRF Sadia expanded its production capacity to 1,200 tons, investing USD 18 Million. This expansion increases production capacity and export potential.
- June 2022: Siwar Food launched a line of frozen meals and desserts, enhancing product variety and distribution through online retailers and vending machines.
Strategic KSA Ready Meals Industry Market Forecast
The KSA ready meals market is poised for significant growth over the forecast period, driven by several factors. Continued economic growth, rising disposable incomes, rapid urbanization, and increasing consumer demand for convenient and high-quality food options will fuel market expansion. Furthermore, government initiatives supporting the food processing sector will create a favorable environment for investment and innovation, leading to substantial market growth and significant opportunities for market participants.
KSA Ready Meals Industry Segmentation
-
1. Product Type
- 1.1. Frozen Ready Meal
- 1.2. Chilled Ready Meal
- 1.3. Ambient Ready Meal
-
2. Distribution Channel
- 2.1. Hypermarkets/Supermarkets
- 2.2. Convenience Stores
- 2.3. Online Retail Stores
- 2.4. Other Distribution Channels
KSA Ready Meals Industry Segmentation By Geography
-
1. North America
- 1.1. United States
- 1.2. Canada
- 1.3. Mexico
-
2. South America
- 2.1. Brazil
- 2.2. Argentina
- 2.3. Rest of South America
-
3. Europe
- 3.1. United Kingdom
- 3.2. Germany
- 3.3. France
- 3.4. Italy
- 3.5. Spain
- 3.6. Russia
- 3.7. Benelux
- 3.8. Nordics
- 3.9. Rest of Europe
-
4. Middle East & Africa
- 4.1. Turkey
- 4.2. Israel
- 4.3. GCC
- 4.4. North Africa
- 4.5. South Africa
- 4.6. Rest of Middle East & Africa
-
5. Asia Pacific
- 5.1. China
- 5.2. India
- 5.3. Japan
- 5.4. South Korea
- 5.5. ASEAN
- 5.6. Oceania
- 5.7. Rest of Asia Pacific
KSA Ready Meals Industry REPORT HIGHLIGHTS
| Aspects | Details |
|---|---|
| Study Period | 2019-2033 |
| Base Year | 2024 |
| Estimated Year | 2025 |
| Forecast Period | 2025-2033 |
| Historical Period | 2019-2024 |
| Growth Rate | CAGR of 3.56% from 2019-2033 |
| Segmentation |
|
Table of Contents
- 1. Introduction
- 1.1. Research Scope
- 1.2. Market Segmentation
- 1.3. Research Methodology
- 1.4. Definitions and Assumptions
- 2. Executive Summary
- 2.1. Introduction
- 3. Market Dynamics
- 3.1. Introduction
- 3.2. Market Drivers
- 3.2.1. Popularity of Convenient Food Products
- 3.3. Market Restrains
- 3.3.1. High Import Dependency for Food Ingredients
- 3.4. Market Trends
- 3.4.1. Increased Demand for Convenience Food Products
- 4. Market Factor Analysis
- 4.1. Porters Five Forces
- 4.2. Supply/Value Chain
- 4.3. PESTEL analysis
- 4.4. Market Entropy
- 4.5. Patent/Trademark Analysis
- 5. Global KSA Ready Meals Industry Analysis, Insights and Forecast, 2019-2031
- 5.1. Market Analysis, Insights and Forecast - by Product Type
- 5.1.1. Frozen Ready Meal
- 5.1.2. Chilled Ready Meal
- 5.1.3. Ambient Ready Meal
- 5.2. Market Analysis, Insights and Forecast - by Distribution Channel
- 5.2.1. Hypermarkets/Supermarkets
- 5.2.2. Convenience Stores
- 5.2.3. Online Retail Stores
- 5.2.4. Other Distribution Channels
- 5.3. Market Analysis, Insights and Forecast - by Region
- 5.3.1. North America
- 5.3.2. South America
- 5.3.3. Europe
- 5.3.4. Middle East & Africa
- 5.3.5. Asia Pacific
- 5.1. Market Analysis, Insights and Forecast - by Product Type
- 6. North America KSA Ready Meals Industry Analysis, Insights and Forecast, 2019-2031
- 6.1. Market Analysis, Insights and Forecast - by Product Type
- 6.1.1. Frozen Ready Meal
- 6.1.2. Chilled Ready Meal
- 6.1.3. Ambient Ready Meal
- 6.2. Market Analysis, Insights and Forecast - by Distribution Channel
- 6.2.1. Hypermarkets/Supermarkets
- 6.2.2. Convenience Stores
- 6.2.3. Online Retail Stores
- 6.2.4. Other Distribution Channels
- 6.1. Market Analysis, Insights and Forecast - by Product Type
- 7. South America KSA Ready Meals Industry Analysis, Insights and Forecast, 2019-2031
- 7.1. Market Analysis, Insights and Forecast - by Product Type
- 7.1.1. Frozen Ready Meal
- 7.1.2. Chilled Ready Meal
- 7.1.3. Ambient Ready Meal
- 7.2. Market Analysis, Insights and Forecast - by Distribution Channel
- 7.2.1. Hypermarkets/Supermarkets
- 7.2.2. Convenience Stores
- 7.2.3. Online Retail Stores
- 7.2.4. Other Distribution Channels
- 7.1. Market Analysis, Insights and Forecast - by Product Type
- 8. Europe KSA Ready Meals Industry Analysis, Insights and Forecast, 2019-2031
- 8.1. Market Analysis, Insights and Forecast - by Product Type
- 8.1.1. Frozen Ready Meal
- 8.1.2. Chilled Ready Meal
- 8.1.3. Ambient Ready Meal
- 8.2. Market Analysis, Insights and Forecast - by Distribution Channel
- 8.2.1. Hypermarkets/Supermarkets
- 8.2.2. Convenience Stores
- 8.2.3. Online Retail Stores
- 8.2.4. Other Distribution Channels
- 8.1. Market Analysis, Insights and Forecast - by Product Type
- 9. Middle East & Africa KSA Ready Meals Industry Analysis, Insights and Forecast, 2019-2031
- 9.1. Market Analysis, Insights and Forecast - by Product Type
- 9.1.1. Frozen Ready Meal
- 9.1.2. Chilled Ready Meal
- 9.1.3. Ambient Ready Meal
- 9.2. Market Analysis, Insights and Forecast - by Distribution Channel
- 9.2.1. Hypermarkets/Supermarkets
- 9.2.2. Convenience Stores
- 9.2.3. Online Retail Stores
- 9.2.4. Other Distribution Channels
- 9.1. Market Analysis, Insights and Forecast - by Product Type
- 10. Asia Pacific KSA Ready Meals Industry Analysis, Insights and Forecast, 2019-2031
- 10.1. Market Analysis, Insights and Forecast - by Product Type
- 10.1.1. Frozen Ready Meal
- 10.1.2. Chilled Ready Meal
- 10.1.3. Ambient Ready Meal
- 10.2. Market Analysis, Insights and Forecast - by Distribution Channel
- 10.2.1. Hypermarkets/Supermarkets
- 10.2.2. Convenience Stores
- 10.2.3. Online Retail Stores
- 10.2.4. Other Distribution Channels
- 10.1. Market Analysis, Insights and Forecast - by Product Type
- 11. North America KSA Ready Meals Industry Analysis, Insights and Forecast, 2019-2031
- 11.1. Market Analysis, Insights and Forecast - By Country/Sub-region
- 11.1.1 United States
- 11.1.2 Canada
- 11.1.3 Mexico
- 11.1.4 Rest of North America
- 12. Europe KSA Ready Meals Industry Analysis, Insights and Forecast, 2019-2031
- 12.1. Market Analysis, Insights and Forecast - By Country/Sub-region
- 12.1.1 Spain
- 12.1.2 United Kingdom
- 12.1.3 France
- 12.1.4 Germany
- 12.1.5 Russia
- 12.1.6 Italy
- 12.1.7 Rest of Europe
- 13. Asia Pacific KSA Ready Meals Industry Analysis, Insights and Forecast, 2019-2031
- 13.1. Market Analysis, Insights and Forecast - By Country/Sub-region
- 13.1.1 China
- 13.1.2 Japan
- 13.1.3 India
- 13.1.4 Australia
- 13.1.5 Rest of Asia Pacific
- 14. South America KSA Ready Meals Industry Analysis, Insights and Forecast, 2019-2031
- 14.1. Market Analysis, Insights and Forecast - By Country/Sub-region
- 14.1.1 Brazil
- 14.1.2 Argentina
- 14.1.3 Rest of South America
- 15. Middle East KSA Ready Meals Industry Analysis, Insights and Forecast, 2019-2031
- 15.1. Market Analysis, Insights and Forecast - By Country/Sub-region
- 15.1.1.
- 16. South Africa KSA Ready Meals Industry Analysis, Insights and Forecast, 2019-2031
- 16.1. Market Analysis, Insights and Forecast - By Country/Sub-region
- 16.1.1 Saudi Arabia
- 16.1.2 Rest of Middle East
- 17. Competitive Analysis
- 17.1. Global Market Share Analysis 2024
- 17.2. Company Profiles
- 17.2.1 Almunajem Foods
- 17.2.1.1. Overview
- 17.2.1.2. Products
- 17.2.1.3. SWOT Analysis
- 17.2.1.4. Recent Developments
- 17.2.1.5. Financials (Based on Availability)
- 17.2.2 JBS Foods SA (Seara Foods)
- 17.2.2.1. Overview
- 17.2.2.2. Products
- 17.2.2.3. SWOT Analysis
- 17.2.2.4. Recent Developments
- 17.2.2.5. Financials (Based on Availability)
- 17.2.3 Almarai Company
- 17.2.3.1. Overview
- 17.2.3.2. Products
- 17.2.3.3. SWOT Analysis
- 17.2.3.4. Recent Developments
- 17.2.3.5. Financials (Based on Availability)
- 17.2.4 Sunbulah Group
- 17.2.4.1. Overview
- 17.2.4.2. Products
- 17.2.4.3. SWOT Analysis
- 17.2.4.4. Recent Developments
- 17.2.4.5. Financials (Based on Availability)
- 17.2.5 Bolton Group SRL
- 17.2.5.1. Overview
- 17.2.5.2. Products
- 17.2.5.3. SWOT Analysis
- 17.2.5.4. Recent Developments
- 17.2.5.5. Financials (Based on Availability)
- 17.2.6 Americana Group
- 17.2.6.1. Overview
- 17.2.6.2. Products
- 17.2.6.3. SWOT Analysis
- 17.2.6.4. Recent Developments
- 17.2.6.5. Financials (Based on Availability)
- 17.2.7 Al Karamah Dough Production Co Ltd
- 17.2.7.1. Overview
- 17.2.7.2. Products
- 17.2.7.3. SWOT Analysis
- 17.2.7.4. Recent Developments
- 17.2.7.5. Financials (Based on Availability)
- 17.2.8 Zen Frozen Foods
- 17.2.8.1. Overview
- 17.2.8.2. Products
- 17.2.8.3. SWOT Analysis
- 17.2.8.4. Recent Developments
- 17.2.8.5. Financials (Based on Availability)
- 17.2.9 Al Kabeer Group
- 17.2.9.1. Overview
- 17.2.9.2. Products
- 17.2.9.3. SWOT Analysis
- 17.2.9.4. Recent Developments
- 17.2.9.5. Financials (Based on Availability)
- 17.2.10 The Oetker Group *List Not Exhaustive
- 17.2.10.1. Overview
- 17.2.10.2. Products
- 17.2.10.3. SWOT Analysis
- 17.2.10.4. Recent Developments
- 17.2.10.5. Financials (Based on Availability)
- 17.2.1 Almunajem Foods
List of Figures
- Figure 1: Global KSA Ready Meals Industry Revenue Breakdown (Million, %) by Region 2024 & 2032
- Figure 2: North America KSA Ready Meals Industry Revenue (Million), by Country 2024 & 2032
- Figure 3: North America KSA Ready Meals Industry Revenue Share (%), by Country 2024 & 2032
- Figure 4: Europe KSA Ready Meals Industry Revenue (Million), by Country 2024 & 2032
- Figure 5: Europe KSA Ready Meals Industry Revenue Share (%), by Country 2024 & 2032
- Figure 6: Asia Pacific KSA Ready Meals Industry Revenue (Million), by Country 2024 & 2032
- Figure 7: Asia Pacific KSA Ready Meals Industry Revenue Share (%), by Country 2024 & 2032
- Figure 8: South America KSA Ready Meals Industry Revenue (Million), by Country 2024 & 2032
- Figure 9: South America KSA Ready Meals Industry Revenue Share (%), by Country 2024 & 2032
- Figure 10: Middle East KSA Ready Meals Industry Revenue (Million), by Country 2024 & 2032
- Figure 11: Middle East KSA Ready Meals Industry Revenue Share (%), by Country 2024 & 2032
- Figure 12: South Africa KSA Ready Meals Industry Revenue (Million), by Country 2024 & 2032
- Figure 13: South Africa KSA Ready Meals Industry Revenue Share (%), by Country 2024 & 2032
- Figure 14: North America KSA Ready Meals Industry Revenue (Million), by Product Type 2024 & 2032
- Figure 15: North America KSA Ready Meals Industry Revenue Share (%), by Product Type 2024 & 2032
- Figure 16: North America KSA Ready Meals Industry Revenue (Million), by Distribution Channel 2024 & 2032
- Figure 17: North America KSA Ready Meals Industry Revenue Share (%), by Distribution Channel 2024 & 2032
- Figure 18: North America KSA Ready Meals Industry Revenue (Million), by Country 2024 & 2032
- Figure 19: North America KSA Ready Meals Industry Revenue Share (%), by Country 2024 & 2032
- Figure 20: South America KSA Ready Meals Industry Revenue (Million), by Product Type 2024 & 2032
- Figure 21: South America KSA Ready Meals Industry Revenue Share (%), by Product Type 2024 & 2032
- Figure 22: South America KSA Ready Meals Industry Revenue (Million), by Distribution Channel 2024 & 2032
- Figure 23: South America KSA Ready Meals Industry Revenue Share (%), by Distribution Channel 2024 & 2032
- Figure 24: South America KSA Ready Meals Industry Revenue (Million), by Country 2024 & 2032
- Figure 25: South America KSA Ready Meals Industry Revenue Share (%), by Country 2024 & 2032
- Figure 26: Europe KSA Ready Meals Industry Revenue (Million), by Product Type 2024 & 2032
- Figure 27: Europe KSA Ready Meals Industry Revenue Share (%), by Product Type 2024 & 2032
- Figure 28: Europe KSA Ready Meals Industry Revenue (Million), by Distribution Channel 2024 & 2032
- Figure 29: Europe KSA Ready Meals Industry Revenue Share (%), by Distribution Channel 2024 & 2032
- Figure 30: Europe KSA Ready Meals Industry Revenue (Million), by Country 2024 & 2032
- Figure 31: Europe KSA Ready Meals Industry Revenue Share (%), by Country 2024 & 2032
- Figure 32: Middle East & Africa KSA Ready Meals Industry Revenue (Million), by Product Type 2024 & 2032
- Figure 33: Middle East & Africa KSA Ready Meals Industry Revenue Share (%), by Product Type 2024 & 2032
- Figure 34: Middle East & Africa KSA Ready Meals Industry Revenue (Million), by Distribution Channel 2024 & 2032
- Figure 35: Middle East & Africa KSA Ready Meals Industry Revenue Share (%), by Distribution Channel 2024 & 2032
- Figure 36: Middle East & Africa KSA Ready Meals Industry Revenue (Million), by Country 2024 & 2032
- Figure 37: Middle East & Africa KSA Ready Meals Industry Revenue Share (%), by Country 2024 & 2032
- Figure 38: Asia Pacific KSA Ready Meals Industry Revenue (Million), by Product Type 2024 & 2032
- Figure 39: Asia Pacific KSA Ready Meals Industry Revenue Share (%), by Product Type 2024 & 2032
- Figure 40: Asia Pacific KSA Ready Meals Industry Revenue (Million), by Distribution Channel 2024 & 2032
- Figure 41: Asia Pacific KSA Ready Meals Industry Revenue Share (%), by Distribution Channel 2024 & 2032
- Figure 42: Asia Pacific KSA Ready Meals Industry Revenue (Million), by Country 2024 & 2032
- Figure 43: Asia Pacific KSA Ready Meals Industry Revenue Share (%), by Country 2024 & 2032
List of Tables
- Table 1: Global KSA Ready Meals Industry Revenue Million Forecast, by Region 2019 & 2032
- Table 2: Global KSA Ready Meals Industry Revenue Million Forecast, by Product Type 2019 & 2032
- Table 3: Global KSA Ready Meals Industry Revenue Million Forecast, by Distribution Channel 2019 & 2032
- Table 4: Global KSA Ready Meals Industry Revenue Million Forecast, by Region 2019 & 2032
- Table 5: Global KSA Ready Meals Industry Revenue Million Forecast, by Country 2019 & 2032
- Table 6: United States KSA Ready Meals Industry Revenue (Million) Forecast, by Application 2019 & 2032
- Table 7: Canada KSA Ready Meals Industry Revenue (Million) Forecast, by Application 2019 & 2032
- Table 8: Mexico KSA Ready Meals Industry Revenue (Million) Forecast, by Application 2019 & 2032
- Table 9: Rest of North America KSA Ready Meals Industry Revenue (Million) Forecast, by Application 2019 & 2032
- Table 10: Global KSA Ready Meals Industry Revenue Million Forecast, by Country 2019 & 2032
- Table 11: Spain KSA Ready Meals Industry Revenue (Million) Forecast, by Application 2019 & 2032
- Table 12: United Kingdom KSA Ready Meals Industry Revenue (Million) Forecast, by Application 2019 & 2032
- Table 13: France KSA Ready Meals Industry Revenue (Million) Forecast, by Application 2019 & 2032
- Table 14: Germany KSA Ready Meals Industry Revenue (Million) Forecast, by Application 2019 & 2032
- Table 15: Russia KSA Ready Meals Industry Revenue (Million) Forecast, by Application 2019 & 2032
- Table 16: Italy KSA Ready Meals Industry Revenue (Million) Forecast, by Application 2019 & 2032
- Table 17: Rest of Europe KSA Ready Meals Industry Revenue (Million) Forecast, by Application 2019 & 2032
- Table 18: Global KSA Ready Meals Industry Revenue Million Forecast, by Country 2019 & 2032
- Table 19: China KSA Ready Meals Industry Revenue (Million) Forecast, by Application 2019 & 2032
- Table 20: Japan KSA Ready Meals Industry Revenue (Million) Forecast, by Application 2019 & 2032
- Table 21: India KSA Ready Meals Industry Revenue (Million) Forecast, by Application 2019 & 2032
- Table 22: Australia KSA Ready Meals Industry Revenue (Million) Forecast, by Application 2019 & 2032
- Table 23: Rest of Asia Pacific KSA Ready Meals Industry Revenue (Million) Forecast, by Application 2019 & 2032
- Table 24: Global KSA Ready Meals Industry Revenue Million Forecast, by Country 2019 & 2032
- Table 25: Brazil KSA Ready Meals Industry Revenue (Million) Forecast, by Application 2019 & 2032
- Table 26: Argentina KSA Ready Meals Industry Revenue (Million) Forecast, by Application 2019 & 2032
- Table 27: Rest of South America KSA Ready Meals Industry Revenue (Million) Forecast, by Application 2019 & 2032
- Table 28: Global KSA Ready Meals Industry Revenue Million Forecast, by Country 2019 & 2032
- Table 29: KSA Ready Meals Industry Revenue (Million) Forecast, by Application 2019 & 2032
- Table 30: Global KSA Ready Meals Industry Revenue Million Forecast, by Country 2019 & 2032
- Table 31: Saudi Arabia KSA Ready Meals Industry Revenue (Million) Forecast, by Application 2019 & 2032
- Table 32: Rest of Middle East KSA Ready Meals Industry Revenue (Million) Forecast, by Application 2019 & 2032
- Table 33: Global KSA Ready Meals Industry Revenue Million Forecast, by Product Type 2019 & 2032
- Table 34: Global KSA Ready Meals Industry Revenue Million Forecast, by Distribution Channel 2019 & 2032
- Table 35: Global KSA Ready Meals Industry Revenue Million Forecast, by Country 2019 & 2032
- Table 36: United States KSA Ready Meals Industry Revenue (Million) Forecast, by Application 2019 & 2032
- Table 37: Canada KSA Ready Meals Industry Revenue (Million) Forecast, by Application 2019 & 2032
- Table 38: Mexico KSA Ready Meals Industry Revenue (Million) Forecast, by Application 2019 & 2032
- Table 39: Global KSA Ready Meals Industry Revenue Million Forecast, by Product Type 2019 & 2032
- Table 40: Global KSA Ready Meals Industry Revenue Million Forecast, by Distribution Channel 2019 & 2032
- Table 41: Global KSA Ready Meals Industry Revenue Million Forecast, by Country 2019 & 2032
- Table 42: Brazil KSA Ready Meals Industry Revenue (Million) Forecast, by Application 2019 & 2032
- Table 43: Argentina KSA Ready Meals Industry Revenue (Million) Forecast, by Application 2019 & 2032
- Table 44: Rest of South America KSA Ready Meals Industry Revenue (Million) Forecast, by Application 2019 & 2032
- Table 45: Global KSA Ready Meals Industry Revenue Million Forecast, by Product Type 2019 & 2032
- Table 46: Global KSA Ready Meals Industry Revenue Million Forecast, by Distribution Channel 2019 & 2032
- Table 47: Global KSA Ready Meals Industry Revenue Million Forecast, by Country 2019 & 2032
- Table 48: United Kingdom KSA Ready Meals Industry Revenue (Million) Forecast, by Application 2019 & 2032
- Table 49: Germany KSA Ready Meals Industry Revenue (Million) Forecast, by Application 2019 & 2032
- Table 50: France KSA Ready Meals Industry Revenue (Million) Forecast, by Application 2019 & 2032
- Table 51: Italy KSA Ready Meals Industry Revenue (Million) Forecast, by Application 2019 & 2032
- Table 52: Spain KSA Ready Meals Industry Revenue (Million) Forecast, by Application 2019 & 2032
- Table 53: Russia KSA Ready Meals Industry Revenue (Million) Forecast, by Application 2019 & 2032
- Table 54: Benelux KSA Ready Meals Industry Revenue (Million) Forecast, by Application 2019 & 2032
- Table 55: Nordics KSA Ready Meals Industry Revenue (Million) Forecast, by Application 2019 & 2032
- Table 56: Rest of Europe KSA Ready Meals Industry Revenue (Million) Forecast, by Application 2019 & 2032
- Table 57: Global KSA Ready Meals Industry Revenue Million Forecast, by Product Type 2019 & 2032
- Table 58: Global KSA Ready Meals Industry Revenue Million Forecast, by Distribution Channel 2019 & 2032
- Table 59: Global KSA Ready Meals Industry Revenue Million Forecast, by Country 2019 & 2032
- Table 60: Turkey KSA Ready Meals Industry Revenue (Million) Forecast, by Application 2019 & 2032
- Table 61: Israel KSA Ready Meals Industry Revenue (Million) Forecast, by Application 2019 & 2032
- Table 62: GCC KSA Ready Meals Industry Revenue (Million) Forecast, by Application 2019 & 2032
- Table 63: North Africa KSA Ready Meals Industry Revenue (Million) Forecast, by Application 2019 & 2032
- Table 64: South Africa KSA Ready Meals Industry Revenue (Million) Forecast, by Application 2019 & 2032
- Table 65: Rest of Middle East & Africa KSA Ready Meals Industry Revenue (Million) Forecast, by Application 2019 & 2032
- Table 66: Global KSA Ready Meals Industry Revenue Million Forecast, by Product Type 2019 & 2032
- Table 67: Global KSA Ready Meals Industry Revenue Million Forecast, by Distribution Channel 2019 & 2032
- Table 68: Global KSA Ready Meals Industry Revenue Million Forecast, by Country 2019 & 2032
- Table 69: China KSA Ready Meals Industry Revenue (Million) Forecast, by Application 2019 & 2032
- Table 70: India KSA Ready Meals Industry Revenue (Million) Forecast, by Application 2019 & 2032
- Table 71: Japan KSA Ready Meals Industry Revenue (Million) Forecast, by Application 2019 & 2032
- Table 72: South Korea KSA Ready Meals Industry Revenue (Million) Forecast, by Application 2019 & 2032
- Table 73: ASEAN KSA Ready Meals Industry Revenue (Million) Forecast, by Application 2019 & 2032
- Table 74: Oceania KSA Ready Meals Industry Revenue (Million) Forecast, by Application 2019 & 2032
- Table 75: Rest of Asia Pacific KSA Ready Meals Industry Revenue (Million) Forecast, by Application 2019 & 2032
Frequently Asked Questions
1. What is the projected Compound Annual Growth Rate (CAGR) of the KSA Ready Meals Industry?
The projected CAGR is approximately 3.56%.
2. Which companies are prominent players in the KSA Ready Meals Industry?
Key companies in the market include Almunajem Foods, JBS Foods SA (Seara Foods), Almarai Company, Sunbulah Group, Bolton Group SRL, Americana Group, Al Karamah Dough Production Co Ltd, Zen Frozen Foods, Al Kabeer Group, The Oetker Group *List Not Exhaustive.
3. What are the main segments of the KSA Ready Meals Industry?
The market segments include Product Type, Distribution Channel.
4. Can you provide details about the market size?
The market size is estimated to be USD XX Million as of 2022.
5. What are some drivers contributing to market growth?
Popularity of Convenient Food Products.
6. What are the notable trends driving market growth?
Increased Demand for Convenience Food Products.
7. Are there any restraints impacting market growth?
High Import Dependency for Food Ingredients.
8. Can you provide examples of recent developments in the market?
In June 2023, Almarai Company signed a memorandum of understanding with the Ministry of Investment on June 6, 2023, to discuss ways to develop the food industry (including ready meals) in the country through new investment opportunities in the food sector, which has great potential that has contributed significantly to the arrival of these products to various regions of the country and contributing to increasing exports, regionally and internationally.
9. What pricing options are available for accessing the report?
Pricing options include single-user, multi-user, and enterprise licenses priced at USD 3800, USD 4500, and USD 5800 respectively.
10. Is the market size provided in terms of value or volume?
The market size is provided in terms of value, measured in Million.
11. Are there any specific market keywords associated with the report?
Yes, the market keyword associated with the report is "KSA Ready Meals Industry," which aids in identifying and referencing the specific market segment covered.
12. How do I determine which pricing option suits my needs best?
The pricing options vary based on user requirements and access needs. Individual users may opt for single-user licenses, while businesses requiring broader access may choose multi-user or enterprise licenses for cost-effective access to the report.
13. Are there any additional resources or data provided in the KSA Ready Meals Industry report?
While the report offers comprehensive insights, it's advisable to review the specific contents or supplementary materials provided to ascertain if additional resources or data are available.
14. How can I stay updated on further developments or reports in the KSA Ready Meals Industry?
To stay informed about further developments, trends, and reports in the KSA Ready Meals Industry, consider subscribing to industry newsletters, following relevant companies and organizations, or regularly checking reputable industry news sources and publications.
Methodology
Step 1 - Identification of Relevant Samples Size from Population Database


Step 2 - Approaches for Defining Global Market Size (Value, Volume* & Price*)

Note*: In applicable scenarios
Step 3 - Data Sources
Primary Research
- Web Analytics
- Survey Reports
- Research Institute
- Latest Research Reports
- Opinion Leaders
Secondary Research
- Annual Reports
- White Paper
- Latest Press Release
- Industry Association
- Paid Database
- Investor Presentations

Step 4 - Data Triangulation
Involves using different sources of information in order to increase the validity of a study
These sources are likely to be stakeholders in a program - participants, other researchers, program staff, other community members, and so on.
Then we put all data in single framework & apply various statistical tools to find out the dynamic on the market.
During the analysis stage, feedback from the stakeholder groups would be compared to determine areas of agreement as well as areas of divergence
