

Key Insights
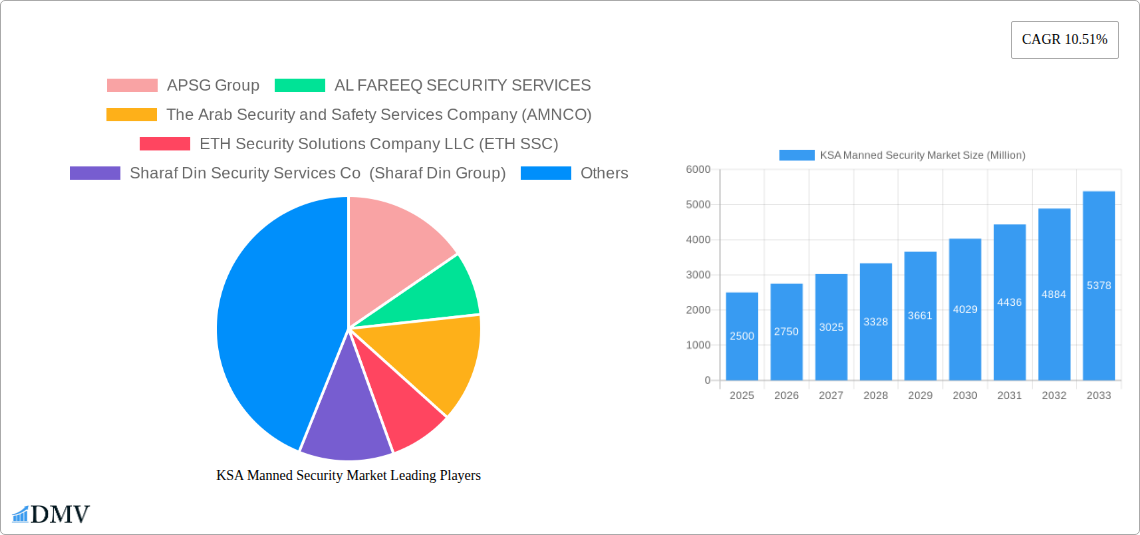
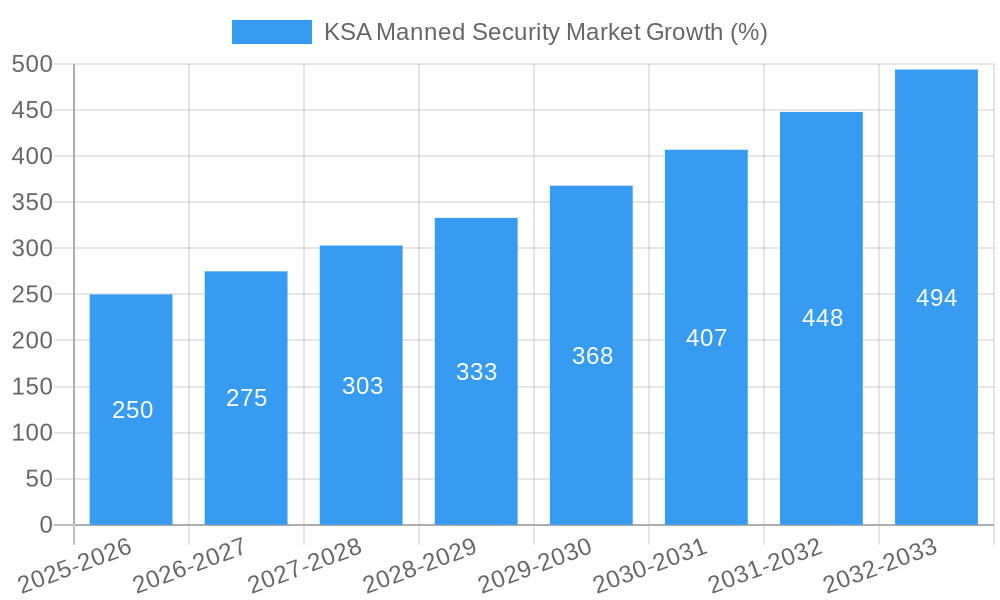
The Kingdom of Saudi Arabia (KSA) manned security market is experiencing robust growth, driven by increasing government investments in infrastructure projects, heightened security concerns across various sectors, and a burgeoning private sector. A Compound Annual Growth Rate (CAGR) of 10.51% from 2019-2033 indicates a significant expansion, with the market projected to reach substantial value within the forecast period. This growth is fueled by the rising demand for security personnel in crucial areas such as commercial complexes, residential developments, industrial facilities, and government institutions. Furthermore, the increasing adoption of advanced security technologies alongside traditional manned guarding services is contributing to market expansion. Key players like APSG Group, AL FAREEQ Security Services, and AMNCO are strategically positioning themselves to capitalize on this growth, focusing on service diversification and technological integration to enhance their offerings and competitive edge. The market is segmented by class, implying varying levels of service quality and pricing impacting overall market dynamics. Regional growth within the KSA market itself is likely to be geographically dispersed, correlating with population density and infrastructure development, with major metropolitan areas seeing the most significant expansion.
While the overall market outlook is positive, challenges remain. These include fluctuations in oil prices (indirectly impacting government spending), competition among existing players leading to pricing pressures, and the need for continuous training and skill development within the security workforce. To mitigate these restraints, security companies are focusing on improving operational efficiency, implementing robust training programs for their personnel, and leveraging technological solutions for enhanced surveillance and response capabilities. The market's future success will depend on addressing these challenges while capitalizing on the opportunities presented by Saudi Arabia's ongoing economic diversification and infrastructure modernization initiatives. A deeper understanding of specific regional contributions within KSA is needed for a more precise analysis but the overall upward trajectory is demonstrably clear.
KSA Manned Security Market Report: 2019-2033 Forecast
This comprehensive report provides a detailed analysis of the Kingdom of Saudi Arabia (KSA) manned security market, offering invaluable insights for stakeholders seeking to understand its current state and future trajectory. Covering the period 2019-2033, with a focus on 2025, this report delves into market dynamics, key players, and emerging trends, equipping you with the knowledge to navigate this rapidly evolving landscape. The market is projected to reach xx Million by 2033.
KSA Manned Security Market Composition & Trends
This section examines the KSA manned security market's competitive landscape, innovative drivers, regulatory framework, and market forces. The market is characterized by a moderate level of concentration, with key players including APSG Group, AL FAREEQ SECURITY SERVICES, The Arab Security and Safety Services Company (AMNCO), ETH Security Solutions Company LLC (ETH SSC), Sharaf Din Security Services Co (Sharaf Din Group), and Securitas AB holding significant market share. However, the market also witnesses the entry of smaller, specialized firms.
- Market Share Distribution: APSG Group holds an estimated xx% market share in 2025, followed by AL FAREEQ SECURITY SERVICES at xx%. The remaining share is distributed among other players, including AMNCO, ETH SSC, Sharaf Din Group, and Securitas AB.
- Innovation Catalysts: Technological advancements, such as AI-powered surveillance and access control systems, are driving innovation. Growing demand for specialized security services (e.g., cybersecurity, risk management) further fuels this trend.
- Regulatory Landscape: The KSA government's focus on national security and infrastructure development significantly shapes the market. Stringent licensing and compliance requirements influence market entry and operational procedures.
- Substitute Products: Technological advancements in surveillance and automation are providing some level of substitution but manned security remains vital for tasks requiring human judgment and interaction.
- End-User Profiles: The market caters to diverse sectors, including government agencies, commercial establishments, residential complexes, and industrial facilities.
- M&A Activities: The KSA manned security market has witnessed xx M&A deals between 2019 and 2024, with a total value of approximately xx Million. These activities reflect consolidation and expansion efforts within the sector.
KSA Manned Security Market Industry Evolution
The KSA manned security market exhibits strong growth, driven by robust infrastructure development, increasing urbanization, and heightened security concerns. From 2019 to 2024, the market experienced a Compound Annual Growth Rate (CAGR) of xx%, reaching xx Million in 2024. This growth trajectory is projected to continue, with a forecasted CAGR of xx% from 2025 to 2033, reaching xx Million by 2033. Technological advancements, such as advanced surveillance technologies and integrated security systems, are accelerating market evolution. Furthermore, changing consumer preferences towards more sophisticated and customized security solutions are influencing market dynamics. The increasing adoption of cloud-based security management systems and the integration of biometric authentication technologies are also shaping the industry. The rise of managed security services is another key trend impacting the market.
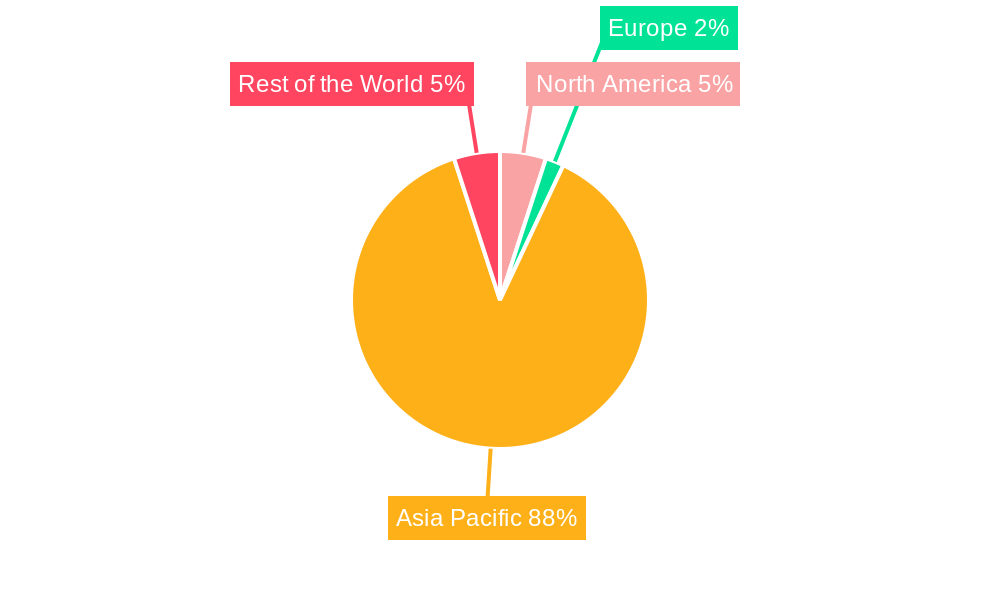
Leading Regions, Countries, or Segments in KSA Manned Security Market
The KSA manned security market is geographically concentrated, with major cities such as Riyadh, Jeddah, and Dammam exhibiting the highest demand. The Class A segment, encompassing high-security solutions for critical infrastructure and government facilities, dominates the market.
- Key Drivers for Class A Segment Dominance:
- Significant Government Investment: Large-scale infrastructure projects and national security initiatives fuel demand in this segment.
- Stringent Regulatory Requirements: Class A security mandates sophisticated systems and highly trained personnel, leading to higher spending.
- High-Value Assets Protection: The segment focuses on protecting high-value assets, necessitating advanced security solutions.
The dominance of the Class A segment is attributed to the KSA government's substantial investments in infrastructure and national security. The region's concentration of critical infrastructure and government facilities, coupled with strict regulatory frameworks, reinforces this segment's market leadership.
KSA Manned Security Market Product Innovations
Recent innovations include the integration of AI-powered video analytics for improved threat detection, cloud-based security management platforms enhancing operational efficiency, and the deployment of biometric authentication systems for enhanced access control. These innovations provide enhanced security, cost-effectiveness, and improved situational awareness. Unique selling propositions emphasize customized solutions, advanced technology integration, and specialized expertise in various sectors.
Propelling Factors for KSA Manned Security Market Growth
Several factors drive the KSA manned security market's growth:
- Economic Expansion: The nation's economic diversification and Vision 2030 initiatives fuel demand for security services across diverse sectors.
- Infrastructure Development: Large-scale infrastructure projects require robust security solutions, boosting market growth.
- Government Initiatives: Increased investment in national security and public safety enhances demand.
Obstacles in the KSA Manned Security Market
Challenges include:
- Regulatory Compliance: Stringent licensing and regulatory requirements can hinder market entry and operation.
- Competition: Intense competition from both established and emerging players puts pressure on profit margins.
- Labor Costs: Rising labor costs and the need for highly skilled personnel can increase operational expenses.
Future Opportunities in KSA Manned Security Market
Future opportunities include:
- Emerging Technologies: Integration of AI, IoT, and advanced analytics holds significant potential.
- Specialized Services: Growth in demand for specialized security services like cybersecurity and risk management.
- Market Expansion: Growing security needs in secondary cities and regions present expansion opportunities.
Major Players in the KSA Manned Security Market Ecosystem
- APSG Group
- AL FAREEQ SECURITY SERVICES
- The Arab Security and Safety Services Company (AMNCO)
- ETH Security Solutions Company LLC (ETH SSC)
- Sharaf Din Security Services Co (Sharaf Din Group)
- Securitas AB
Key Developments in KSA Manned Security Market Industry
- June 2023: Neom finalized contracts worth SAR 21 billion (USD 5.60 billion) for residential community expansion, significantly boosting demand for security services in the region.
- May 2023: Accor's hotel development agreement with Amsa Hospitality signifies increased security needs in secondary cities across KSA.
Strategic KSA Manned Security Market Forecast
The KSA manned security market is poised for robust growth, driven by continued economic expansion, substantial infrastructure development, and rising security concerns. The adoption of advanced technologies and the increasing demand for specialized services will further propel market expansion. The forecast indicates significant growth potential, presenting lucrative opportunities for market participants.
KSA Manned Security Market Segmentation
-
1. Service
- 1.1. Manned security
- 1.2. Mobile patrols
- 1.3. Risk assessment
- 1.4. Investigations
-
2. End-user
- 2.1. Commercial
- 2.2. Industrial
- 2.3. Residential
- 2.4. Government
KSA Manned Security Market Segmentation By Geography
-
1. North America
- 1.1. United States
- 1.2. Canada
- 1.3. Mexico
-
2. South America
- 2.1. Brazil
- 2.2. Argentina
- 2.3. Rest of South America
-
3. Europe
- 3.1. United Kingdom
- 3.2. Germany
- 3.3. France
- 3.4. Italy
- 3.5. Spain
- 3.6. Russia
- 3.7. Benelux
- 3.8. Nordics
- 3.9. Rest of Europe
-
4. Middle East & Africa
- 4.1. Turkey
- 4.2. Israel
- 4.3. GCC
- 4.4. North Africa
- 4.5. South Africa
- 4.6. Rest of Middle East & Africa
-
5. Asia Pacific
- 5.1. China
- 5.2. India
- 5.3. Japan
- 5.4. South Korea
- 5.5. ASEAN
- 5.6. Oceania
- 5.7. Rest of Asia Pacific
KSA Manned Security Market REPORT HIGHLIGHTS
| Aspects | Details |
|---|---|
| Study Period | 2019-2033 |
| Base Year | 2024 |
| Estimated Year | 2025 |
| Forecast Period | 2025-2033 |
| Historical Period | 2019-2024 |
| Growth Rate | CAGR of 10.51% from 2019-2033 |
| Segmentation |
|
Table of Contents
- 1. Introduction
- 1.1. Research Scope
- 1.2. Market Segmentation
- 1.3. Research Methodology
- 1.4. Definitions and Assumptions
- 2. Executive Summary
- 2.1. Introduction
- 3. Market Dynamics
- 3.1. Introduction
- 3.2. Market Drivers
- 3.2.1. 4.; Growing Construction Activity in the Commercial and Industrial Domain4.; Rising Awareness of the Need to Outsource Manned Security Services to Competent Vendors4.; Changing Geopolitical Scenario in the Region Expected to Drive Growth
- 3.3. Market Restrains
- 3.3.1. 4.; Adoption of Alternative Technology-based Video Surveillance and Advanced Access Control
- 3.4. Market Trends
- 3.4.1. Growing Construction Activity in the Commercial and Industrial Domain is Expected to Drive the Market
- 4. Market Factor Analysis
- 4.1. Porters Five Forces
- 4.2. Supply/Value Chain
- 4.3. PESTEL analysis
- 4.4. Market Entropy
- 4.5. Patent/Trademark Analysis
- 5. Global KSA Manned Security Market Analysis, Insights and Forecast, 2019-2031
- 5.1. Market Analysis, Insights and Forecast - by Service
- 5.1.1. Manned security
- 5.1.2. Mobile patrols
- 5.1.3. Risk assessment
- 5.1.4. Investigations
- 5.2. Market Analysis, Insights and Forecast - by End-user
- 5.2.1. Commercial
- 5.2.2. Industrial
- 5.2.3. Residential
- 5.2.4. Government
- 5.3. Market Analysis, Insights and Forecast - by Region
- 5.3.1. North America
- 5.3.2. South America
- 5.3.3. Europe
- 5.3.4. Middle East & Africa
- 5.3.5. Asia Pacific
- 5.1. Market Analysis, Insights and Forecast - by Service
- 6. North America KSA Manned Security Market Analysis, Insights and Forecast, 2019-2031
- 6.1. Market Analysis, Insights and Forecast - by Service
- 6.1.1. Manned security
- 6.1.2. Mobile patrols
- 6.1.3. Risk assessment
- 6.1.4. Investigations
- 6.2. Market Analysis, Insights and Forecast - by End-user
- 6.2.1. Commercial
- 6.2.2. Industrial
- 6.2.3. Residential
- 6.2.4. Government
- 6.1. Market Analysis, Insights and Forecast - by Service
- 7. South America KSA Manned Security Market Analysis, Insights and Forecast, 2019-2031
- 7.1. Market Analysis, Insights and Forecast - by Service
- 7.1.1. Manned security
- 7.1.2. Mobile patrols
- 7.1.3. Risk assessment
- 7.1.4. Investigations
- 7.2. Market Analysis, Insights and Forecast - by End-user
- 7.2.1. Commercial
- 7.2.2. Industrial
- 7.2.3. Residential
- 7.2.4. Government
- 7.1. Market Analysis, Insights and Forecast - by Service
- 8. Europe KSA Manned Security Market Analysis, Insights and Forecast, 2019-2031
- 8.1. Market Analysis, Insights and Forecast - by Service
- 8.1.1. Manned security
- 8.1.2. Mobile patrols
- 8.1.3. Risk assessment
- 8.1.4. Investigations
- 8.2. Market Analysis, Insights and Forecast - by End-user
- 8.2.1. Commercial
- 8.2.2. Industrial
- 8.2.3. Residential
- 8.2.4. Government
- 8.1. Market Analysis, Insights and Forecast - by Service
- 9. Middle East & Africa KSA Manned Security Market Analysis, Insights and Forecast, 2019-2031
- 9.1. Market Analysis, Insights and Forecast - by Service
- 9.1.1. Manned security
- 9.1.2. Mobile patrols
- 9.1.3. Risk assessment
- 9.1.4. Investigations
- 9.2. Market Analysis, Insights and Forecast - by End-user
- 9.2.1. Commercial
- 9.2.2. Industrial
- 9.2.3. Residential
- 9.2.4. Government
- 9.1. Market Analysis, Insights and Forecast - by Service
- 10. Asia Pacific KSA Manned Security Market Analysis, Insights and Forecast, 2019-2031
- 10.1. Market Analysis, Insights and Forecast - by Service
- 10.1.1. Manned security
- 10.1.2. Mobile patrols
- 10.1.3. Risk assessment
- 10.1.4. Investigations
- 10.2. Market Analysis, Insights and Forecast - by End-user
- 10.2.1. Commercial
- 10.2.2. Industrial
- 10.2.3. Residential
- 10.2.4. Government
- 10.1. Market Analysis, Insights and Forecast - by Service
- 11. North America KSA Manned Security Market Analysis, Insights and Forecast, 2019-2031
- 11.1. Market Analysis, Insights and Forecast - By Country/Sub-region
- 11.1.1.
- 12. Europe KSA Manned Security Market Analysis, Insights and Forecast, 2019-2031
- 12.1. Market Analysis, Insights and Forecast - By Country/Sub-region
- 12.1.1.
- 13. Asia Pacific KSA Manned Security Market Analysis, Insights and Forecast, 2019-2031
- 13.1. Market Analysis, Insights and Forecast - By Country/Sub-region
- 13.1.1.
- 14. Rest of the World KSA Manned Security Market Analysis, Insights and Forecast, 2019-2031
- 14.1. Market Analysis, Insights and Forecast - By Country/Sub-region
- 14.1.1.
- 15. Competitive Analysis
- 15.1. Global Market Share Analysis 2024
- 15.2. Company Profiles
- 15.2.1 APSG Group
- 15.2.1.1. Overview
- 15.2.1.2. Products
- 15.2.1.3. SWOT Analysis
- 15.2.1.4. Recent Developments
- 15.2.1.5. Financials (Based on Availability)
- 15.2.2 AL FAREEQ SECURITY SERVICES
- 15.2.2.1. Overview
- 15.2.2.2. Products
- 15.2.2.3. SWOT Analysis
- 15.2.2.4. Recent Developments
- 15.2.2.5. Financials (Based on Availability)
- 15.2.3 The Arab Security and Safety Services Company (AMNCO)
- 15.2.3.1. Overview
- 15.2.3.2. Products
- 15.2.3.3. SWOT Analysis
- 15.2.3.4. Recent Developments
- 15.2.3.5. Financials (Based on Availability)
- 15.2.4 ETH Security Solutions Company LLC (ETH SSC)
- 15.2.4.1. Overview
- 15.2.4.2. Products
- 15.2.4.3. SWOT Analysis
- 15.2.4.4. Recent Developments
- 15.2.4.5. Financials (Based on Availability)
- 15.2.5 Sharaf Din Security Services Co (Sharaf Din Group)
- 15.2.5.1. Overview
- 15.2.5.2. Products
- 15.2.5.3. SWOT Analysis
- 15.2.5.4. Recent Developments
- 15.2.5.5. Financials (Based on Availability)
- 15.2.6 Securitas AB
- 15.2.6.1. Overview
- 15.2.6.2. Products
- 15.2.6.3. SWOT Analysis
- 15.2.6.4. Recent Developments
- 15.2.6.5. Financials (Based on Availability)
- 15.2.1 APSG Group
List of Figures
- Figure 1: Global KSA Manned Security Market Revenue Breakdown (Million, %) by Region 2024 & 2032
- Figure 2: Global KSA Manned Security Market Volume Breakdown (K Unit, %) by Region 2024 & 2032
- Figure 3: North America KSA Manned Security Market Revenue (Million), by Country 2024 & 2032
- Figure 4: North America KSA Manned Security Market Volume (K Unit), by Country 2024 & 2032
- Figure 5: North America KSA Manned Security Market Revenue Share (%), by Country 2024 & 2032
- Figure 6: North America KSA Manned Security Market Volume Share (%), by Country 2024 & 2032
- Figure 7: Europe KSA Manned Security Market Revenue (Million), by Country 2024 & 2032
- Figure 8: Europe KSA Manned Security Market Volume (K Unit), by Country 2024 & 2032
- Figure 9: Europe KSA Manned Security Market Revenue Share (%), by Country 2024 & 2032
- Figure 10: Europe KSA Manned Security Market Volume Share (%), by Country 2024 & 2032
- Figure 11: Asia Pacific KSA Manned Security Market Revenue (Million), by Country 2024 & 2032
- Figure 12: Asia Pacific KSA Manned Security Market Volume (K Unit), by Country 2024 & 2032
- Figure 13: Asia Pacific KSA Manned Security Market Revenue Share (%), by Country 2024 & 2032
- Figure 14: Asia Pacific KSA Manned Security Market Volume Share (%), by Country 2024 & 2032
- Figure 15: Rest of the World KSA Manned Security Market Revenue (Million), by Country 2024 & 2032
- Figure 16: Rest of the World KSA Manned Security Market Volume (K Unit), by Country 2024 & 2032
- Figure 17: Rest of the World KSA Manned Security Market Revenue Share (%), by Country 2024 & 2032
- Figure 18: Rest of the World KSA Manned Security Market Volume Share (%), by Country 2024 & 2032
- Figure 19: North America KSA Manned Security Market Revenue (Million), by Service 2024 & 2032
- Figure 20: North America KSA Manned Security Market Volume (K Unit), by Service 2024 & 2032
- Figure 21: North America KSA Manned Security Market Revenue Share (%), by Service 2024 & 2032
- Figure 22: North America KSA Manned Security Market Volume Share (%), by Service 2024 & 2032
- Figure 23: North America KSA Manned Security Market Revenue (Million), by End-user 2024 & 2032
- Figure 24: North America KSA Manned Security Market Volume (K Unit), by End-user 2024 & 2032
- Figure 25: North America KSA Manned Security Market Revenue Share (%), by End-user 2024 & 2032
- Figure 26: North America KSA Manned Security Market Volume Share (%), by End-user 2024 & 2032
- Figure 27: North America KSA Manned Security Market Revenue (Million), by Country 2024 & 2032
- Figure 28: North America KSA Manned Security Market Volume (K Unit), by Country 2024 & 2032
- Figure 29: North America KSA Manned Security Market Revenue Share (%), by Country 2024 & 2032
- Figure 30: North America KSA Manned Security Market Volume Share (%), by Country 2024 & 2032
- Figure 31: South America KSA Manned Security Market Revenue (Million), by Service 2024 & 2032
- Figure 32: South America KSA Manned Security Market Volume (K Unit), by Service 2024 & 2032
- Figure 33: South America KSA Manned Security Market Revenue Share (%), by Service 2024 & 2032
- Figure 34: South America KSA Manned Security Market Volume Share (%), by Service 2024 & 2032
- Figure 35: South America KSA Manned Security Market Revenue (Million), by End-user 2024 & 2032
- Figure 36: South America KSA Manned Security Market Volume (K Unit), by End-user 2024 & 2032
- Figure 37: South America KSA Manned Security Market Revenue Share (%), by End-user 2024 & 2032
- Figure 38: South America KSA Manned Security Market Volume Share (%), by End-user 2024 & 2032
- Figure 39: South America KSA Manned Security Market Revenue (Million), by Country 2024 & 2032
- Figure 40: South America KSA Manned Security Market Volume (K Unit), by Country 2024 & 2032
- Figure 41: South America KSA Manned Security Market Revenue Share (%), by Country 2024 & 2032
- Figure 42: South America KSA Manned Security Market Volume Share (%), by Country 2024 & 2032
- Figure 43: Europe KSA Manned Security Market Revenue (Million), by Service 2024 & 2032
- Figure 44: Europe KSA Manned Security Market Volume (K Unit), by Service 2024 & 2032
- Figure 45: Europe KSA Manned Security Market Revenue Share (%), by Service 2024 & 2032
- Figure 46: Europe KSA Manned Security Market Volume Share (%), by Service 2024 & 2032
- Figure 47: Europe KSA Manned Security Market Revenue (Million), by End-user 2024 & 2032
- Figure 48: Europe KSA Manned Security Market Volume (K Unit), by End-user 2024 & 2032
- Figure 49: Europe KSA Manned Security Market Revenue Share (%), by End-user 2024 & 2032
- Figure 50: Europe KSA Manned Security Market Volume Share (%), by End-user 2024 & 2032
- Figure 51: Europe KSA Manned Security Market Revenue (Million), by Country 2024 & 2032
- Figure 52: Europe KSA Manned Security Market Volume (K Unit), by Country 2024 & 2032
- Figure 53: Europe KSA Manned Security Market Revenue Share (%), by Country 2024 & 2032
- Figure 54: Europe KSA Manned Security Market Volume Share (%), by Country 2024 & 2032
- Figure 55: Middle East & Africa KSA Manned Security Market Revenue (Million), by Service 2024 & 2032
- Figure 56: Middle East & Africa KSA Manned Security Market Volume (K Unit), by Service 2024 & 2032
- Figure 57: Middle East & Africa KSA Manned Security Market Revenue Share (%), by Service 2024 & 2032
- Figure 58: Middle East & Africa KSA Manned Security Market Volume Share (%), by Service 2024 & 2032
- Figure 59: Middle East & Africa KSA Manned Security Market Revenue (Million), by End-user 2024 & 2032
- Figure 60: Middle East & Africa KSA Manned Security Market Volume (K Unit), by End-user 2024 & 2032
- Figure 61: Middle East & Africa KSA Manned Security Market Revenue Share (%), by End-user 2024 & 2032
- Figure 62: Middle East & Africa KSA Manned Security Market Volume Share (%), by End-user 2024 & 2032
- Figure 63: Middle East & Africa KSA Manned Security Market Revenue (Million), by Country 2024 & 2032
- Figure 64: Middle East & Africa KSA Manned Security Market Volume (K Unit), by Country 2024 & 2032
- Figure 65: Middle East & Africa KSA Manned Security Market Revenue Share (%), by Country 2024 & 2032
- Figure 66: Middle East & Africa KSA Manned Security Market Volume Share (%), by Country 2024 & 2032
- Figure 67: Asia Pacific KSA Manned Security Market Revenue (Million), by Service 2024 & 2032
- Figure 68: Asia Pacific KSA Manned Security Market Volume (K Unit), by Service 2024 & 2032
- Figure 69: Asia Pacific KSA Manned Security Market Revenue Share (%), by Service 2024 & 2032
- Figure 70: Asia Pacific KSA Manned Security Market Volume Share (%), by Service 2024 & 2032
- Figure 71: Asia Pacific KSA Manned Security Market Revenue (Million), by End-user 2024 & 2032
- Figure 72: Asia Pacific KSA Manned Security Market Volume (K Unit), by End-user 2024 & 2032
- Figure 73: Asia Pacific KSA Manned Security Market Revenue Share (%), by End-user 2024 & 2032
- Figure 74: Asia Pacific KSA Manned Security Market Volume Share (%), by End-user 2024 & 2032
- Figure 75: Asia Pacific KSA Manned Security Market Revenue (Million), by Country 2024 & 2032
- Figure 76: Asia Pacific KSA Manned Security Market Volume (K Unit), by Country 2024 & 2032
- Figure 77: Asia Pacific KSA Manned Security Market Revenue Share (%), by Country 2024 & 2032
- Figure 78: Asia Pacific KSA Manned Security Market Volume Share (%), by Country 2024 & 2032
List of Tables
- Table 1: Global KSA Manned Security Market Revenue Million Forecast, by Region 2019 & 2032
- Table 2: Global KSA Manned Security Market Volume K Unit Forecast, by Region 2019 & 2032
- Table 3: Global KSA Manned Security Market Revenue Million Forecast, by Service 2019 & 2032
- Table 4: Global KSA Manned Security Market Volume K Unit Forecast, by Service 2019 & 2032
- Table 5: Global KSA Manned Security Market Revenue Million Forecast, by End-user 2019 & 2032
- Table 6: Global KSA Manned Security Market Volume K Unit Forecast, by End-user 2019 & 2032
- Table 7: Global KSA Manned Security Market Revenue Million Forecast, by Region 2019 & 2032
- Table 8: Global KSA Manned Security Market Volume K Unit Forecast, by Region 2019 & 2032
- Table 9: Global KSA Manned Security Market Revenue Million Forecast, by Country 2019 & 2032
- Table 10: Global KSA Manned Security Market Volume K Unit Forecast, by Country 2019 & 2032
- Table 11: KSA Manned Security Market Revenue (Million) Forecast, by Application 2019 & 2032
- Table 12: KSA Manned Security Market Volume (K Unit) Forecast, by Application 2019 & 2032
- Table 13: Global KSA Manned Security Market Revenue Million Forecast, by Country 2019 & 2032
- Table 14: Global KSA Manned Security Market Volume K Unit Forecast, by Country 2019 & 2032
- Table 15: KSA Manned Security Market Revenue (Million) Forecast, by Application 2019 & 2032
- Table 16: KSA Manned Security Market Volume (K Unit) Forecast, by Application 2019 & 2032
- Table 17: Global KSA Manned Security Market Revenue Million Forecast, by Country 2019 & 2032
- Table 18: Global KSA Manned Security Market Volume K Unit Forecast, by Country 2019 & 2032
- Table 19: KSA Manned Security Market Revenue (Million) Forecast, by Application 2019 & 2032
- Table 20: KSA Manned Security Market Volume (K Unit) Forecast, by Application 2019 & 2032
- Table 21: Global KSA Manned Security Market Revenue Million Forecast, by Country 2019 & 2032
- Table 22: Global KSA Manned Security Market Volume K Unit Forecast, by Country 2019 & 2032
- Table 23: KSA Manned Security Market Revenue (Million) Forecast, by Application 2019 & 2032
- Table 24: KSA Manned Security Market Volume (K Unit) Forecast, by Application 2019 & 2032
- Table 25: Global KSA Manned Security Market Revenue Million Forecast, by Service 2019 & 2032
- Table 26: Global KSA Manned Security Market Volume K Unit Forecast, by Service 2019 & 2032
- Table 27: Global KSA Manned Security Market Revenue Million Forecast, by End-user 2019 & 2032
- Table 28: Global KSA Manned Security Market Volume K Unit Forecast, by End-user 2019 & 2032
- Table 29: Global KSA Manned Security Market Revenue Million Forecast, by Country 2019 & 2032
- Table 30: Global KSA Manned Security Market Volume K Unit Forecast, by Country 2019 & 2032
- Table 31: United States KSA Manned Security Market Revenue (Million) Forecast, by Application 2019 & 2032
- Table 32: United States KSA Manned Security Market Volume (K Unit) Forecast, by Application 2019 & 2032
- Table 33: Canada KSA Manned Security Market Revenue (Million) Forecast, by Application 2019 & 2032
- Table 34: Canada KSA Manned Security Market Volume (K Unit) Forecast, by Application 2019 & 2032
- Table 35: Mexico KSA Manned Security Market Revenue (Million) Forecast, by Application 2019 & 2032
- Table 36: Mexico KSA Manned Security Market Volume (K Unit) Forecast, by Application 2019 & 2032
- Table 37: Global KSA Manned Security Market Revenue Million Forecast, by Service 2019 & 2032
- Table 38: Global KSA Manned Security Market Volume K Unit Forecast, by Service 2019 & 2032
- Table 39: Global KSA Manned Security Market Revenue Million Forecast, by End-user 2019 & 2032
- Table 40: Global KSA Manned Security Market Volume K Unit Forecast, by End-user 2019 & 2032
- Table 41: Global KSA Manned Security Market Revenue Million Forecast, by Country 2019 & 2032
- Table 42: Global KSA Manned Security Market Volume K Unit Forecast, by Country 2019 & 2032
- Table 43: Brazil KSA Manned Security Market Revenue (Million) Forecast, by Application 2019 & 2032
- Table 44: Brazil KSA Manned Security Market Volume (K Unit) Forecast, by Application 2019 & 2032
- Table 45: Argentina KSA Manned Security Market Revenue (Million) Forecast, by Application 2019 & 2032
- Table 46: Argentina KSA Manned Security Market Volume (K Unit) Forecast, by Application 2019 & 2032
- Table 47: Rest of South America KSA Manned Security Market Revenue (Million) Forecast, by Application 2019 & 2032
- Table 48: Rest of South America KSA Manned Security Market Volume (K Unit) Forecast, by Application 2019 & 2032
- Table 49: Global KSA Manned Security Market Revenue Million Forecast, by Service 2019 & 2032
- Table 50: Global KSA Manned Security Market Volume K Unit Forecast, by Service 2019 & 2032
- Table 51: Global KSA Manned Security Market Revenue Million Forecast, by End-user 2019 & 2032
- Table 52: Global KSA Manned Security Market Volume K Unit Forecast, by End-user 2019 & 2032
- Table 53: Global KSA Manned Security Market Revenue Million Forecast, by Country 2019 & 2032
- Table 54: Global KSA Manned Security Market Volume K Unit Forecast, by Country 2019 & 2032
- Table 55: United Kingdom KSA Manned Security Market Revenue (Million) Forecast, by Application 2019 & 2032
- Table 56: United Kingdom KSA Manned Security Market Volume (K Unit) Forecast, by Application 2019 & 2032
- Table 57: Germany KSA Manned Security Market Revenue (Million) Forecast, by Application 2019 & 2032
- Table 58: Germany KSA Manned Security Market Volume (K Unit) Forecast, by Application 2019 & 2032
- Table 59: France KSA Manned Security Market Revenue (Million) Forecast, by Application 2019 & 2032
- Table 60: France KSA Manned Security Market Volume (K Unit) Forecast, by Application 2019 & 2032
- Table 61: Italy KSA Manned Security Market Revenue (Million) Forecast, by Application 2019 & 2032
- Table 62: Italy KSA Manned Security Market Volume (K Unit) Forecast, by Application 2019 & 2032
- Table 63: Spain KSA Manned Security Market Revenue (Million) Forecast, by Application 2019 & 2032
- Table 64: Spain KSA Manned Security Market Volume (K Unit) Forecast, by Application 2019 & 2032
- Table 65: Russia KSA Manned Security Market Revenue (Million) Forecast, by Application 2019 & 2032
- Table 66: Russia KSA Manned Security Market Volume (K Unit) Forecast, by Application 2019 & 2032
- Table 67: Benelux KSA Manned Security Market Revenue (Million) Forecast, by Application 2019 & 2032
- Table 68: Benelux KSA Manned Security Market Volume (K Unit) Forecast, by Application 2019 & 2032
- Table 69: Nordics KSA Manned Security Market Revenue (Million) Forecast, by Application 2019 & 2032
- Table 70: Nordics KSA Manned Security Market Volume (K Unit) Forecast, by Application 2019 & 2032
- Table 71: Rest of Europe KSA Manned Security Market Revenue (Million) Forecast, by Application 2019 & 2032
- Table 72: Rest of Europe KSA Manned Security Market Volume (K Unit) Forecast, by Application 2019 & 2032
- Table 73: Global KSA Manned Security Market Revenue Million Forecast, by Service 2019 & 2032
- Table 74: Global KSA Manned Security Market Volume K Unit Forecast, by Service 2019 & 2032
- Table 75: Global KSA Manned Security Market Revenue Million Forecast, by End-user 2019 & 2032
- Table 76: Global KSA Manned Security Market Volume K Unit Forecast, by End-user 2019 & 2032
- Table 77: Global KSA Manned Security Market Revenue Million Forecast, by Country 2019 & 2032
- Table 78: Global KSA Manned Security Market Volume K Unit Forecast, by Country 2019 & 2032
- Table 79: Turkey KSA Manned Security Market Revenue (Million) Forecast, by Application 2019 & 2032
- Table 80: Turkey KSA Manned Security Market Volume (K Unit) Forecast, by Application 2019 & 2032
- Table 81: Israel KSA Manned Security Market Revenue (Million) Forecast, by Application 2019 & 2032
- Table 82: Israel KSA Manned Security Market Volume (K Unit) Forecast, by Application 2019 & 2032
- Table 83: GCC KSA Manned Security Market Revenue (Million) Forecast, by Application 2019 & 2032
- Table 84: GCC KSA Manned Security Market Volume (K Unit) Forecast, by Application 2019 & 2032
- Table 85: North Africa KSA Manned Security Market Revenue (Million) Forecast, by Application 2019 & 2032
- Table 86: North Africa KSA Manned Security Market Volume (K Unit) Forecast, by Application 2019 & 2032
- Table 87: South Africa KSA Manned Security Market Revenue (Million) Forecast, by Application 2019 & 2032
- Table 88: South Africa KSA Manned Security Market Volume (K Unit) Forecast, by Application 2019 & 2032
- Table 89: Rest of Middle East & Africa KSA Manned Security Market Revenue (Million) Forecast, by Application 2019 & 2032
- Table 90: Rest of Middle East & Africa KSA Manned Security Market Volume (K Unit) Forecast, by Application 2019 & 2032
- Table 91: Global KSA Manned Security Market Revenue Million Forecast, by Service 2019 & 2032
- Table 92: Global KSA Manned Security Market Volume K Unit Forecast, by Service 2019 & 2032
- Table 93: Global KSA Manned Security Market Revenue Million Forecast, by End-user 2019 & 2032
- Table 94: Global KSA Manned Security Market Volume K Unit Forecast, by End-user 2019 & 2032
- Table 95: Global KSA Manned Security Market Revenue Million Forecast, by Country 2019 & 2032
- Table 96: Global KSA Manned Security Market Volume K Unit Forecast, by Country 2019 & 2032
- Table 97: China KSA Manned Security Market Revenue (Million) Forecast, by Application 2019 & 2032
- Table 98: China KSA Manned Security Market Volume (K Unit) Forecast, by Application 2019 & 2032
- Table 99: India KSA Manned Security Market Revenue (Million) Forecast, by Application 2019 & 2032
- Table 100: India KSA Manned Security Market Volume (K Unit) Forecast, by Application 2019 & 2032
- Table 101: Japan KSA Manned Security Market Revenue (Million) Forecast, by Application 2019 & 2032
- Table 102: Japan KSA Manned Security Market Volume (K Unit) Forecast, by Application 2019 & 2032
- Table 103: South Korea KSA Manned Security Market Revenue (Million) Forecast, by Application 2019 & 2032
- Table 104: South Korea KSA Manned Security Market Volume (K Unit) Forecast, by Application 2019 & 2032
- Table 105: ASEAN KSA Manned Security Market Revenue (Million) Forecast, by Application 2019 & 2032
- Table 106: ASEAN KSA Manned Security Market Volume (K Unit) Forecast, by Application 2019 & 2032
- Table 107: Oceania KSA Manned Security Market Revenue (Million) Forecast, by Application 2019 & 2032
- Table 108: Oceania KSA Manned Security Market Volume (K Unit) Forecast, by Application 2019 & 2032
- Table 109: Rest of Asia Pacific KSA Manned Security Market Revenue (Million) Forecast, by Application 2019 & 2032
- Table 110: Rest of Asia Pacific KSA Manned Security Market Volume (K Unit) Forecast, by Application 2019 & 2032
Frequently Asked Questions
1. What is the projected Compound Annual Growth Rate (CAGR) of the KSA Manned Security Market?
The projected CAGR is approximately 10.51%.
2. Which companies are prominent players in the KSA Manned Security Market?
Key companies in the market include APSG Group, AL FAREEQ SECURITY SERVICES, The Arab Security and Safety Services Company (AMNCO), ETH Security Solutions Company LLC (ETH SSC), Sharaf Din Security Services Co (Sharaf Din Group), Securitas AB.
3. What are the main segments of the KSA Manned Security Market?
The market segments include Service, End-user.
4. Can you provide details about the market size?
The market size is estimated to be USD XX Million as of 2022.
5. What are some drivers contributing to market growth?
4.; Growing Construction Activity in the Commercial and Industrial Domain4.; Rising Awareness of the Need to Outsource Manned Security Services to Competent Vendors4.; Changing Geopolitical Scenario in the Region Expected to Drive Growth.
6. What are the notable trends driving market growth?
Growing Construction Activity in the Commercial and Industrial Domain is Expected to Drive the Market.
7. Are there any restraints impacting market growth?
4.; Adoption of Alternative Technology-based Video Surveillance and Advanced Access Control.
8. Can you provide examples of recent developments in the market?
June 2023: Neom finalized contracts amounting to SAR 21 billion (USD 5.60 billion) with investors for the first phase of its residential communities' expansion. This social infrastructure project is expected to house the region's growing workforce.
9. What pricing options are available for accessing the report?
Pricing options include single-user, multi-user, and enterprise licenses priced at USD 3800, USD 4500, and USD 5800 respectively.
10. Is the market size provided in terms of value or volume?
The market size is provided in terms of value, measured in Million and volume, measured in K Unit.
11. Are there any specific market keywords associated with the report?
Yes, the market keyword associated with the report is "KSA Manned Security Market," which aids in identifying and referencing the specific market segment covered.
12. How do I determine which pricing option suits my needs best?
The pricing options vary based on user requirements and access needs. Individual users may opt for single-user licenses, while businesses requiring broader access may choose multi-user or enterprise licenses for cost-effective access to the report.
13. Are there any additional resources or data provided in the KSA Manned Security Market report?
While the report offers comprehensive insights, it's advisable to review the specific contents or supplementary materials provided to ascertain if additional resources or data are available.
14. How can I stay updated on further developments or reports in the KSA Manned Security Market?
To stay informed about further developments, trends, and reports in the KSA Manned Security Market, consider subscribing to industry newsletters, following relevant companies and organizations, or regularly checking reputable industry news sources and publications.
Methodology
Step 1 - Identification of Relevant Samples Size from Population Database


Step 2 - Approaches for Defining Global Market Size (Value, Volume* & Price*)

Note*: In applicable scenarios
Step 3 - Data Sources
Primary Research
- Web Analytics
- Survey Reports
- Research Institute
- Latest Research Reports
- Opinion Leaders
Secondary Research
- Annual Reports
- White Paper
- Latest Press Release
- Industry Association
- Paid Database
- Investor Presentations

Step 4 - Data Triangulation
Involves using different sources of information in order to increase the validity of a study
These sources are likely to be stakeholders in a program - participants, other researchers, program staff, other community members, and so on.
Then we put all data in single framework & apply various statistical tools to find out the dynamic on the market.
During the analysis stage, feedback from the stakeholder groups would be compared to determine areas of agreement as well as areas of divergence
